3364
Assessment of the reproducibility of structural brain networks derived using different edge-weighting strategies1Medicine, Cardiff University, Cardiff, United Kingdom, 2Psychology, Cardiff University, Cardiff, United Kingdom, 3Psychology, Australian Catholic University, Melbourne, Australia
Synopsis
Structural brain networks derived from diffusion Magnetic Resonance Imaging data can use various tract metrics to weigh the network edges. In this work we use the Human Connectome Project test-retest diffusion MRI data to assess the reproducibility of structural brain networks, their edges and their graph-theoretical measures derived using different edge-weighting strategies.
Introduction
Structural brain network reproducibility is an underlying assumption in longitudinal studies and in studies comparing healthy participants to patients. Graphs representing structural networks of a given participant derived from diffusion MRI data acquired at different times should be stable, so that any observed differences can be attributed to maturation or to true differences between populations respectively, rather than to fluctuations resulting from data acquisition or analysis. Additionally, more stable measurements result in smaller within-subject variance and higher statistical power. In this work we assessed the reproducibility of structural brain networks, their edges and their graph-theoretical metrics in healthy participants, for scans separated by a few months, for graphs generated using different edge-weighting strategies.Methods
We used the Human Connectome Project test-retest diffusion MRI data1,2 from 37 healthy participants who underwent scans with 90 gradient directions (b=2000 s/mm2). Whole-brain constrained spherical deconvolution (CSD) tractography and network analysis were performed using ExploreDTI-4.8.63 . The AAL atlas4 was used to define the nodes of the networks. This resulted in connectivity matrices for each scan of each participant, each matrix having edges weighted by different metrics of the white matter tracts (fractional anisotropy (FA), mean diffusivity (MD), number of streamlines (NS), streamline density (SD), tract length (TL)). We used a method recently described5 to generate integrated graphs representing the structural networks from each scan of each participant. The method has two benefits: a) it integrates these metrics to generate edge weights that maximize the information included in each edge, and b) the threshold applied to the graph (to trim the less significant edges) is defined in a data-driven manner to minimize the cost and maximize the efficiency of the network, instead of being set arbitrarily. We explored several combinations of the FA, NS, MD, SD and TL. We also constructed networks that use only the NS, only the FA and only the MD as edge weights, because these metrics have been extensively used in the literature as edge weights. For each participant, we calculated the network reproducibility as the similarity of the matrices representing the test and retest networks. We also calculated the intra-class correlation coefficient (ICC), i.e. the correlation between measures at different times, for each edge of the graphs. Finally, we computed graph theoretical metrics for the networks using the Brain Connectivity Toolbox6 .Results
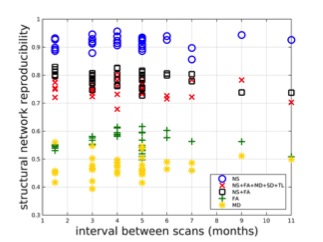
Using the NS as edge weights resulted in the highest reproducibility (comparable to 7,8). Combining NS and FA (denoted 'NS+FA') to form integrated graphs resulted in the second highest reproducibility (Figure 1). The reproducibility of the FA- and MD-weighted graphs was very low. Interestingly, the reproducibility of the NS+FA integrated graphs was negatively correlated (r = -0.45, p =0.0048) with the time interval between test and retest scans. Further analysis focused on the graphs that use as edge weights a) only the NS, b) the NS+FA combination. In the NS-graphs, there were 16 edges common across both scans of all participants, while in the NS+FA integrated graphs there were 28 such edges.
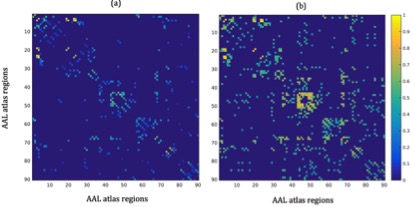
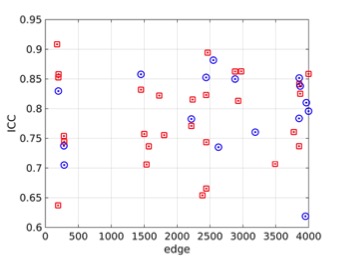
A representative graph for the structural network of one participant is shown in Figure 2, where (a) shows the NS-graph and (b) shows the NS+FA integrated graph. The ICC for the edges that appear in all participants is shown in Figure 3 (blue circles for the NS-graph and red squares for the NS+FA integrated graph). The ICCs were comparable for the NS and the NS+FA networks. Additionally, for both the NS-graphs and the NS+FA integrated graphs, the edge ICC was statistically significantly correlated with the mean number (over participants and over the two scans) of streamlines of the edge (p-values of 10-7 and 10-28, and correlation coefficients of 0.28 and 0.39, for the NS- and the (NS+FA) graphs respectively). The ICC for the global efficiency of the graphs was 0.77 for the NS-networks and 0.54 for the NS+FA networks. The lower value of the ICC in the latter case was driven by larger differences in participants for whom the scans differ by more than 6 months.
Conclusions
Reproducibility of the graphs representing structural networks is dependent on the metric, or combination of metrics, used to weigh the graph edges. The poor reproducibility of graphs constructed using exclusively FA or MD as edge weights dictates that these metrics should be used with extreme caution, because the high variability can lead to erroneous differences or changes. Using the NS or the NS+FA combination as edge-weights results in high reproducibility. The dependence of the edge ICCs on the edge NS indicates that connections with more streamlines are reproduced more consistently between scans.Acknowledgements
The work was partly funded by the BRAIN Unit, which is funded by Health and Care Research Wales. The authors also wish to acknowledge support by the Wellcome trust.References
[1] D. C. Van Essen, S. M. Smith, D. M. Barch, T. E. J. Behrens, E. Yacoub, K. Ugurbil, for the WU-Minn HCP Consortium. The WU-Minn Human Connectome Project: An overview. NeuroImage, 80:62-79, 2013.
[2] M. F. Glasser, S. N.Sotiropoulos, J. A. Wilson, T. S.Coalson, B. Fischld, J. L. Andersson, J. Xu, S. Jbabdi, M. Webster, J. R. Polimeni, D. C. Van Essen, M. Jenkinson for the WU-Minn HCP Consortium. The minimal preprocessing pipelines for the Human Connectome Project. NeuroImage, 80:105-124, 2013.
[3] A. Leemans, B. Jeurissen, J. Sijbers, and D.K. Jones. ExploreDTI: a graphical toolbox for processing, analyzing, and visualizing diffusion MR data. 17th Annual Meeting of Intl Soc Mag Reson Med, p. 3537, Hawaii, USA, 2009.
[4] N. Tzourio-Mazoyer, B. Landeau, D. Papathanassiou, F. Crivello, O. Étard, N. Delcroix, B. Mazoyer, and M. Joliot. Automated Anatomical Labeling of Activations in SPM Using a Macroscopic Anatomical Parcellation of the MNI MRI Single-Subject Brain. NeuroImage, 15 :273-289, 2002.
[5] S. I. Dimitriadis, M. Drakesmith, S. Bells, G. D. Parker, D. E. Linden and D. K. Jones. Improving the Reliability of Network Metrics in Structural Brain Networks by Integrating Different Network Weighting Strategies into a Single Graph. Frontiers in Neuroscience, 11:694, 2017.
[6] M. Rubinov and O. Sporns. Complex network measures of brain connectivity: Uses and interpretations. NeuroImage 52:1059-69, 2010.
[7] T. Roine, B. Jeurissen, D. Perrone, J. Aelterman, W. Philips, J. Sijbers, A. Leemans. Reproducibility and intercorrelation of graph theoretical measures in structural brain connectivity networks. Medical Image Analysis. article in press.
[8] S.-Y. Tsai. Reproducibility of structural brain connectivity and network metrics using probabilistic diffusion tractography. Scientific Reports, Volume 8, Article number: 11562 (2018).
Figures