3350
Complex-valued diffusion MRI data processing: Application to neural soma imaging1Centre for Medical Image Computing, University College London, London, United Kingdom, 2Cardiff University Brain Research Imaging Centre, Cardiff University, Cardiff, United Kingdom, 3Great Ormond Street Institute of Child Health, University College London, London, United Kingdom, 4Department of Radiology, New York University School of Medicine, New York, NY, United States, 5School of Psychology, Australian Catholic University, Melbourne, Australia
Synopsis
Microscopic diffusion anisotropy imaging requires averaging the diffusion signal over the gradient directions to regress out the unwanted effects of the fibre orientation distribution. However, Rician noise biases the mean signal calculations especially in the high b-value regime and subsequently the estimation of microstructural tissue features. In this work we develop new data processing methods using complex-valued MRI data that remove the background phase and hence retain the Gaussian characteristics of the signal noise, which is demonstrated in neural soma imaging, a novel application of the Spherical Mean Technique (SMT).
Introduction
Diffusion MRI has enabled clinicians to assess microscopic features much below the nominal image resolution. It is standard practice to use only the magnitude signal, whose noise regime is governed by a Rician distribution1, even though the induced signal bias may adversely affect the quantitative recovery of microstructural tissue parameters2,3. Here we propose a total generalised variation (TGV) technique4 to remove the background phase in complex-valued diffusion images, which (i) avoids the complications of biased parameter estimation and (ii) greatly enhances the contrast-to-noise ratio. These benefits are showcased in neural soma imaging, a new microscopic diffusion anisotropy mapping method we introduce in this work based on the Spherical Mean Technique (SMT)5,6 and deep-learning model fitting7.Methods
Experiment design. We conducted a human pilot study with a healthy male volunteer (aged 36 years) after written informed consent had been obtained. The Stejskal–Tanner experiment was measured on a 3T Siemens Connectom system equipped with a 32-channel head coil and an ultra-high gradient insert with 300 mT/m maximum gradient strength. We acquired 20 b-shells evenly ranging from 500 to 10000 s/mm2 and 60 uniformly distributed gradient directions each, keeping the other sequence parameters of the EPI scan (TR=4.9 s, TE=79 s, 1.5 mm isotropic, GRAPPA/2, SMS/28) fixed. The magnitude and phase image data were saved.
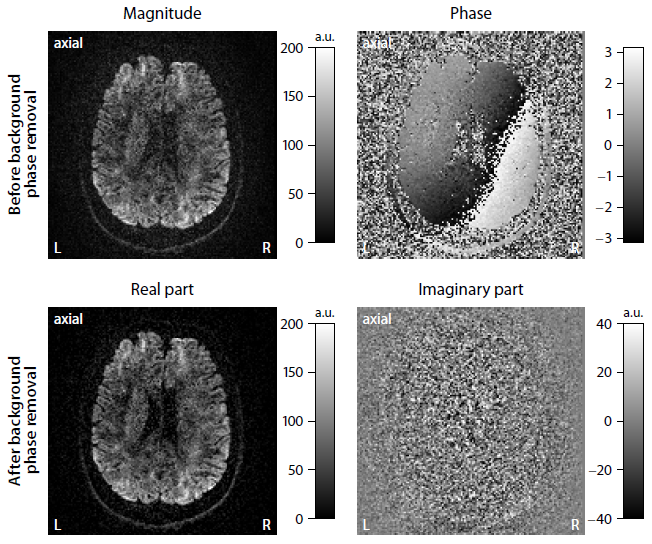
Background phase removal. After unwrapping the signal phase9, we estimate slice by slice the background phase using TGV regularisation4, which produces piecewise smooth maps without the notorious staircasing effect like in traditional total variation10,11. The estimated background phase is removed from the complex-valued MRI signal, which is projected onto the real part (Figure 1). The imaginary signal component contains white noise after background phase removal. Subsequently, the dataset is corrected for susceptibility distortions, eddy-current artefacts and subject motion12. The resulting diffusion images retain the Gaussian noise regime.
Neural soma model. Recent results15,16 show the potential influence of cell bodies on the signal. Here we devise a biophysical model for the estimation of neurites and neural soma that aims to discriminate between cylindrical and spherical geometries. The voxel-scale diffusion signal is produced by a large population of tissue microenvironments that have an orientation distribution. The microscopic signal from a single microenvironment with orientation ω may be modelled using a second-order approximation$$h_b(g,\omega)=f_{\mathrm{cyl}}h^{\mathrm{cyl}}_b(g,\omega)+f_{\mathrm{sph}}h^{\mathrm{sph}}_b(g,\omega)+f_{\mathrm{ext}} h^{\mathrm{ext}}_b(g,\omega),$$where b and g denote the b-value and gradient direction, respectively. The signal from thin cylindrical compartments, such as neurites13, may be described by$$h^{\mathrm{cyl}}_b(g,\omega)=\exp(-b\langle g,\omega\rangle^2\lambda)$$with the intrinsic diffusivity λ; the signal from spherical compartments, such as neural soma, in terms of$$h^{\mathrm{sph}}_b(g,\omega)=\exp(-b\lambda_{\mathrm{sph}})$$with the soma diffusivity λsph ≤ λ; and the microscopic signal from the extra-cellular compartment as$$h^{\mathrm{ext}}_b(g,\omega)=\exp(-b\langle g,\omega\rangle^2\lambda_\parallel^{\mathrm{ext}})\exp(-b(1-\langle g,\omega\rangle^2)\lambda_\perp^{\mathrm{ext}}),$$where the parallel and perpendicular extra-cellular diffusivities $$$\lambda_\parallel^{\mathrm{ext}}$$$ and $$$\lambda_\perp^{\mathrm{ext}}$$$ are modelled using a tortuosity approximation14. The corresponding signal fractions fcyl, fsph and fext sum up to one.
Deep-learning model fitting. For fast and robust estimation of the model parameters in the presence of orientational heterogeneity and Gaussian noise, we use (i) SMT5,6 to factor out the confounding orientational effects, and (ii) a neural network of three fully connected layers with rectified linear unit activation functions7 which guarantees by design that the estimated parameters are in their biophysically plausible range. The network is trained with a mean squared error loss criterion using synthesised data from the forward model and a stochastic gradient descent optimiser.
Results
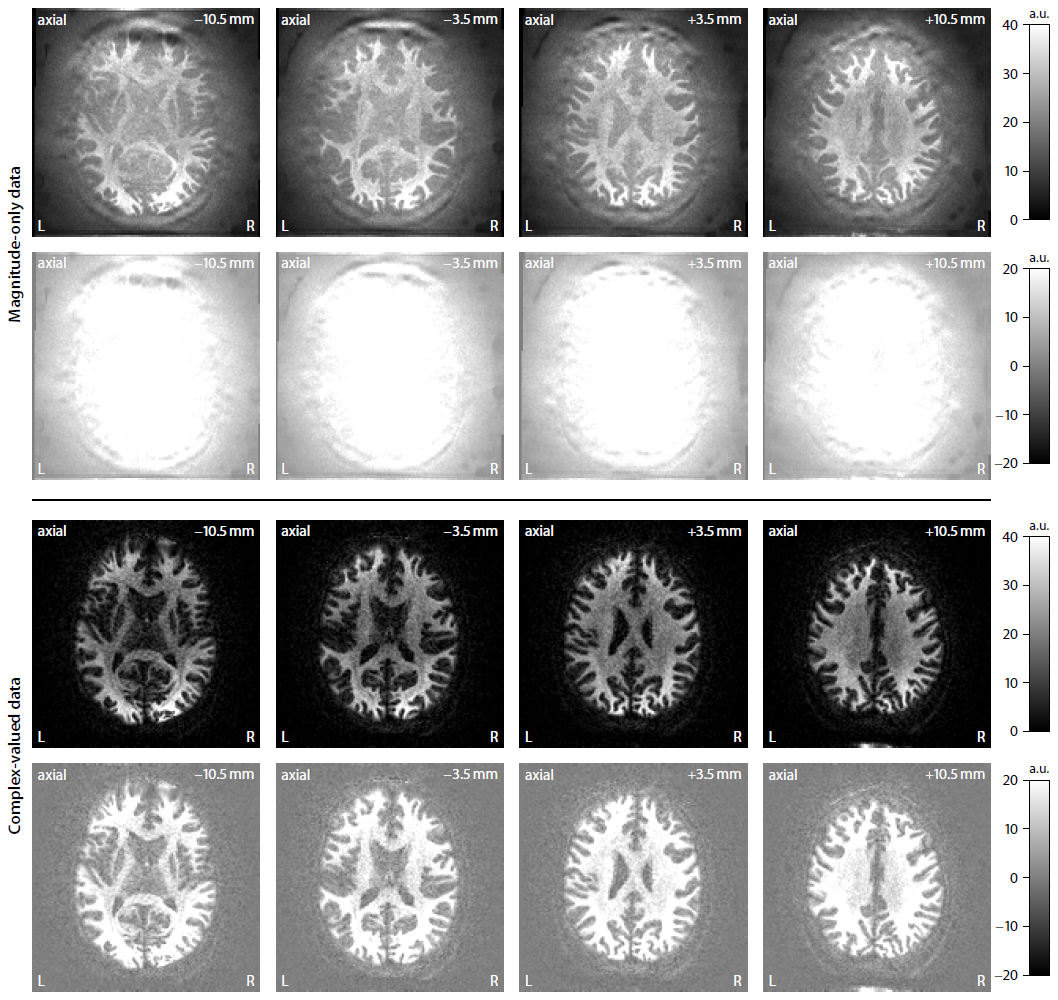
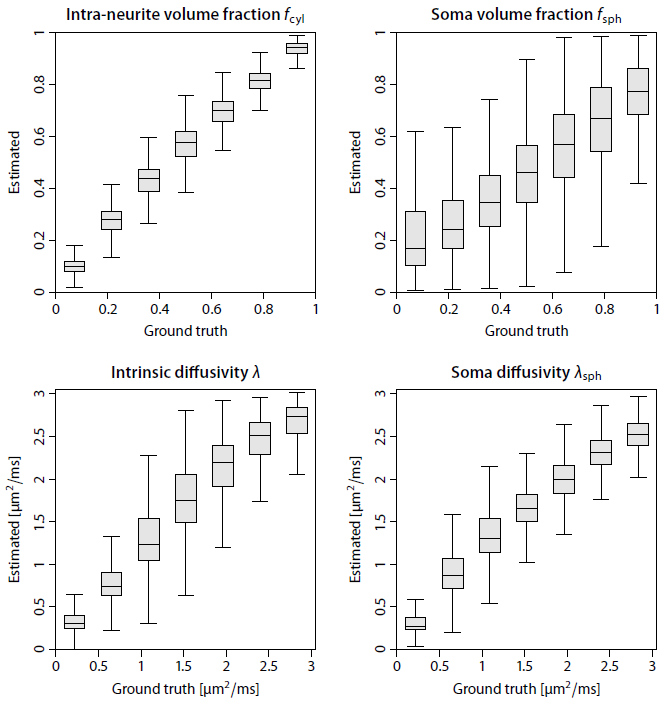
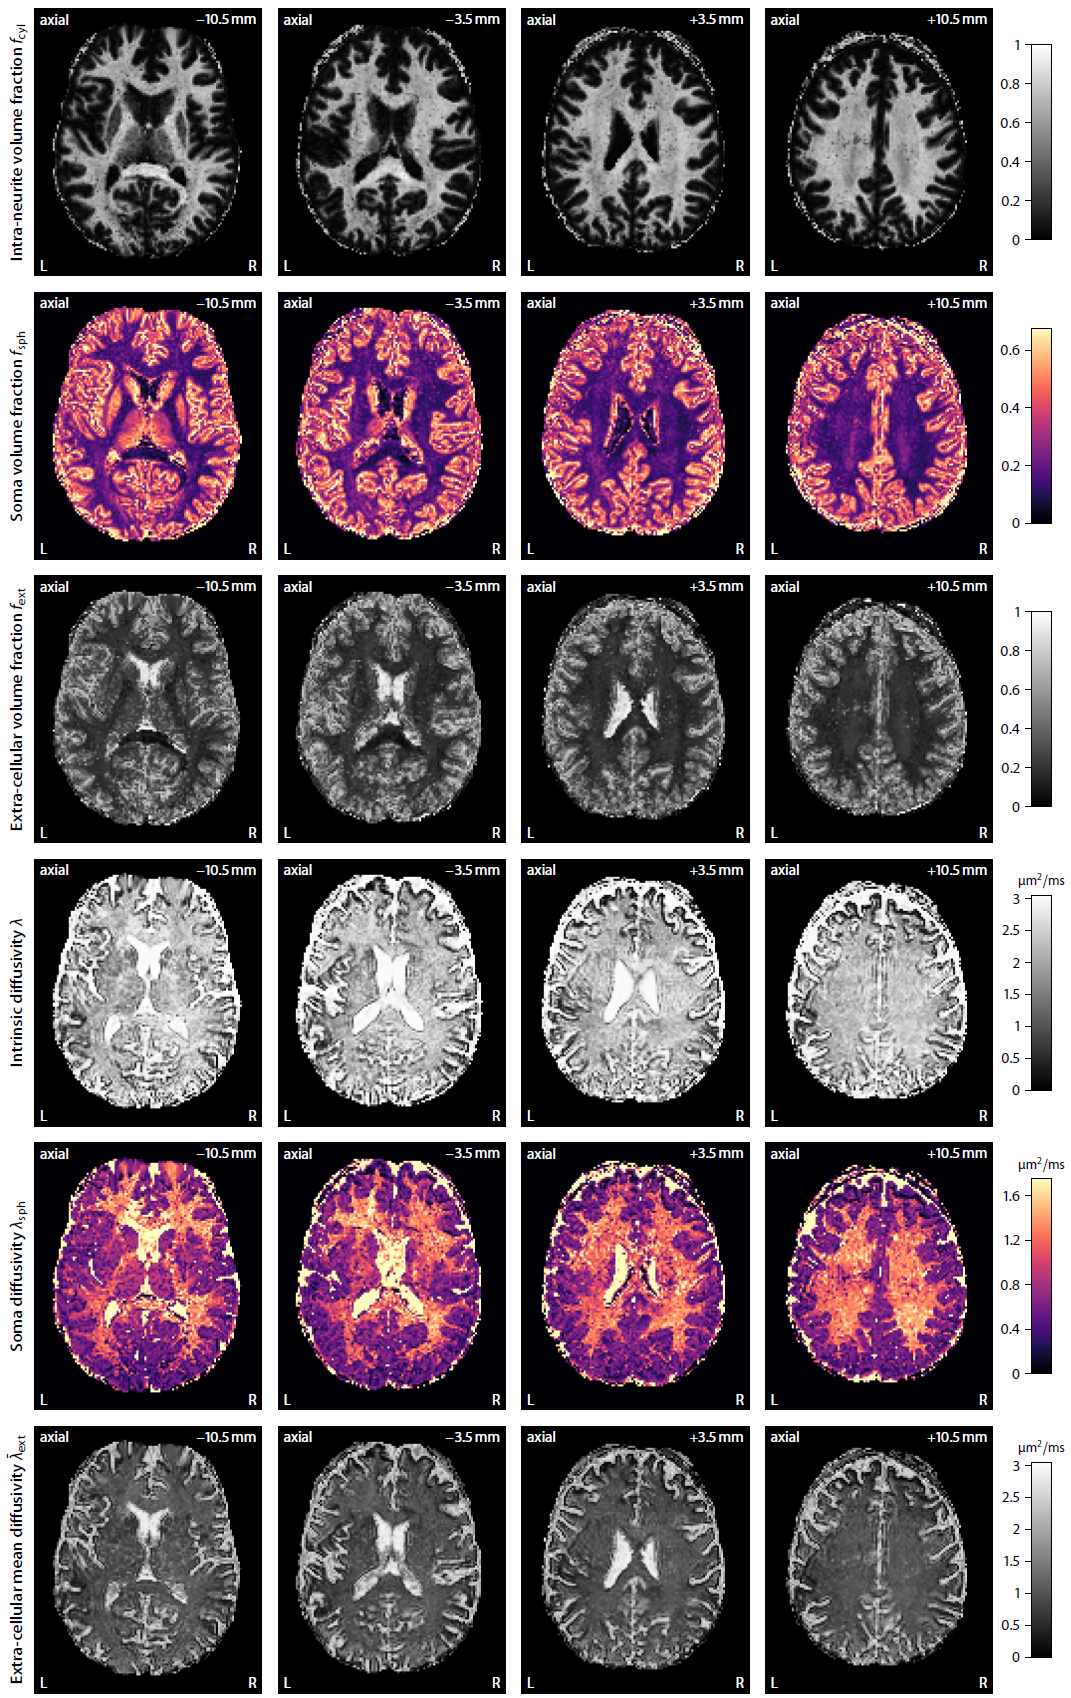
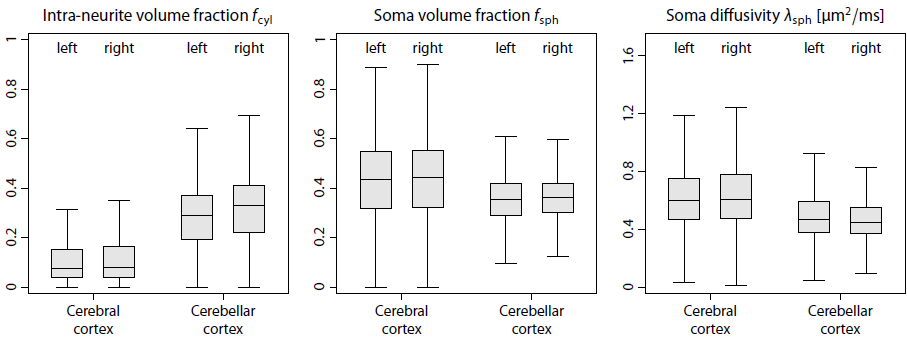
Figure 2 shows that complex-valued MRI data processing removes the Rician noise bias and thus yields a significantly higher contrast-to-noise ratio. For example, the mean signal over the gradient directions is on average zero in the ventricles at b-value of 10000 s/mm2. In Figure 3 we demonstrate in a simulation study that the trained neural network is able to recover the four independent microstructural (i.e. non-orientational) parameters albeit with moderate precision at signal-to-noise ratio of 20. Figure 4 maps various microscopic tissue parameters, including soma volume fraction and soma diffusivity, which takes only seconds to compute once the neural network is trained. Lastly, Figure 5 shows that the intra-neurite volume fraction is higher and soma diffusivity lower in the cortical grey matter of the cerebellum compared to the cerebrum, presumably due to the large dendritic trees of Purkinje cells and the large number of small granule cells in the cerebellum15–17.Discussion
Complex-valued diffusion MRI data processing is key for the quantitative estimation of tissue microstructure. It eliminates the Rician noise bias and vastly enhances the image contrast. In addition, we have introduced neural soma imaging, a new application of SMT-based microscopic diffusion anisotropy mapping. This technique potentially allows us to assess neuronal loss in neurodegenerative disorders such as Alzheimer's disease non-invasively. The deep-learning framework provides the parameter maps within a few seconds, which is crucial for clinical deployment.Acknowledgements
We thank the Martinos Center for Biomedical Imaging, Massachusetts General Hospital for sharing their Simultaneous MultiSlice (SMS) EPI sequence with Blipped-CAIPI. This work was supported by grants UK EPSRC EP/M020533/1, EP/N018702/1, EP/M029778/1, BBSRC BB/M009513/1, Wellcome Trust 096646/Z/11/Z, 104943/Z/14/Z and EU H2020 634541-2. The software is available online at https://ekaden.github.io.References
1. Gudbjartsson H and Patz S. The Rician distribution of noisy MRI data. Magnetic Resonance in Medicine, 34:910–914, 1995.
2. Rudrapatna SU, Bakker CJG, Viergever MA, van der Toorn A and Dijkhuizen RM. Improved estimation of MR relaxation parameters using complex-valued data. Magnetic Resonance in Medicine, 77:385–397, 2017.
3. Grussu F, Veraart J, Battiston M, Schneider T, Cohen-Adad J, Cardoso MJ, Wheeler-Kingshott CAG, Fieremans E, Alexander DC and Novikov DS. Magnitude versus complex-valued images for spinal cord diffusion MRI: which one is best? In Proceedings of the 26th Annual Meeting of the ISMRM, page 0466, 2018.
4. Bredies K, Kunisch K and Pock T. Total generalized variation. SIAM Journal of Imaging Sciences, 3: 492–526, 2010.
5. Kaden E, Kruggel F and Alexander DC. Quantitative mapping of the per-axon diffusion coefficients in brain white matter. Magnetic Resonance in Medicine, 75:1752–1763, 2016.
6. Kaden E, Kelm ND, Carson RP, Does MD and Alexander DC. Multi-compartment microscopic diffusion imaging. NeuroImage, 139:346–359, 2016.
7. Goodfellow I, Bengio Y and Courville A. Deep Learning. MIT Press, 2016.
8. Setsompop K, Gagoski BA, Polimeni JR, Witzel T, Wedeen VJ and Wald LL. Blipped-controlled aliasing in parallel imaging for simultaneous multislice echo planer imaging with reduced g-factor penalty. Magnetic Resonance in Medicine, 67:1210–1224, 2012.
9. Bioucas-Dias JM and Valadao G. Phase unwrapping via graph cuts. IEEE Transactions on Image Processing, 16:698–709, 2007.
10. Eichner C, Cauley SF, Cohen-Adad J, Moller HE, Turner R, Setsompop K and Wald LL. Real diffusion-weighted MRI enabling true signal averaging and increased diffusion contrast. NeuroImage, 122:373–384, 2015.
11. Fan Q, Nummenmaa A, Witzel T, Ohringer N, Tian Q, Wald LL, Huang SY and Klawiter EC. Axon diameter mapping independent of crossing structures using Spherical Mean Technique. In Proceedings of the 26th Annual Meeting of the ISMRM, page 5244, 2018.
12. Andersson JLR and Sotiropoulos SN. An integrated approach to correction for off-resonance effects and subject movement in diffusion MR imaging. NeuroImage, 125:1063–1078, 2016.
13. Behrens TEJ, Woolrich MW, Jenkinson M, Johansen-Berg H, Nunes RG, Clare S, Matthews PM, Brady JM and Smith SM. Characterization and propagation of uncertainty in diffusion-weighted MR imaging. Magnetic Resonance in Medicine, 50:1077–1088, 2003.
14. Stanisz GJ, Szafer A, Wright GA and Henkelman RM. An analytical model of restricted diffusion in bovine optic nerve. Magnetic Resonance in Medicine, 37:103–111, 1997.
15. Palombo M, Shemesh N, Ianus A, Alexander DC and Zhang H. A compartment based model for non-invasive cell body imaging by diffusion MRI. In Proceedings of the 26th Annual Meeting of the ISMRM, page 1096, 2018.
16. Palombo M, Shemesh N, Ianus A, Alexander DC and Zhang H. Abundance of cell bodies can explain the stick model’s failure in grey matter at high b-value. In Proceedings of the 26th Annual Meeting of the ISMRM, page 0892, 2018.
17. Tax CMW, Szczepankiewicz F, Nilsson M and Jones DK. The dot... wherefore art thou? Search for the isotropic restricted diffusion compartment in the brain with spherical tensor encoding and strong gradients. In Proceedings of the 26th Annual Meeting ISMRM, page 0253, 2018.
Figures