3336
Characterisation of ageing effects using multiparametric quantitative imaging1Institute of Neuroscience and Medicine - 4, INM-4, Forschungszentrum Jülich, Jülich, Germany, 2Authors with equal contributions, Jülich, Germany, 3Institute of Neuroscience and Medicine - 11, INM-11, Forschungszentrum Jülich, Jülich, Germany, 4Jara - BRAIN -Translational Medicine, Aachen, Germany, 5Department of Neurology, RWTH Aachen University, Aachen, Germany
Synopsis
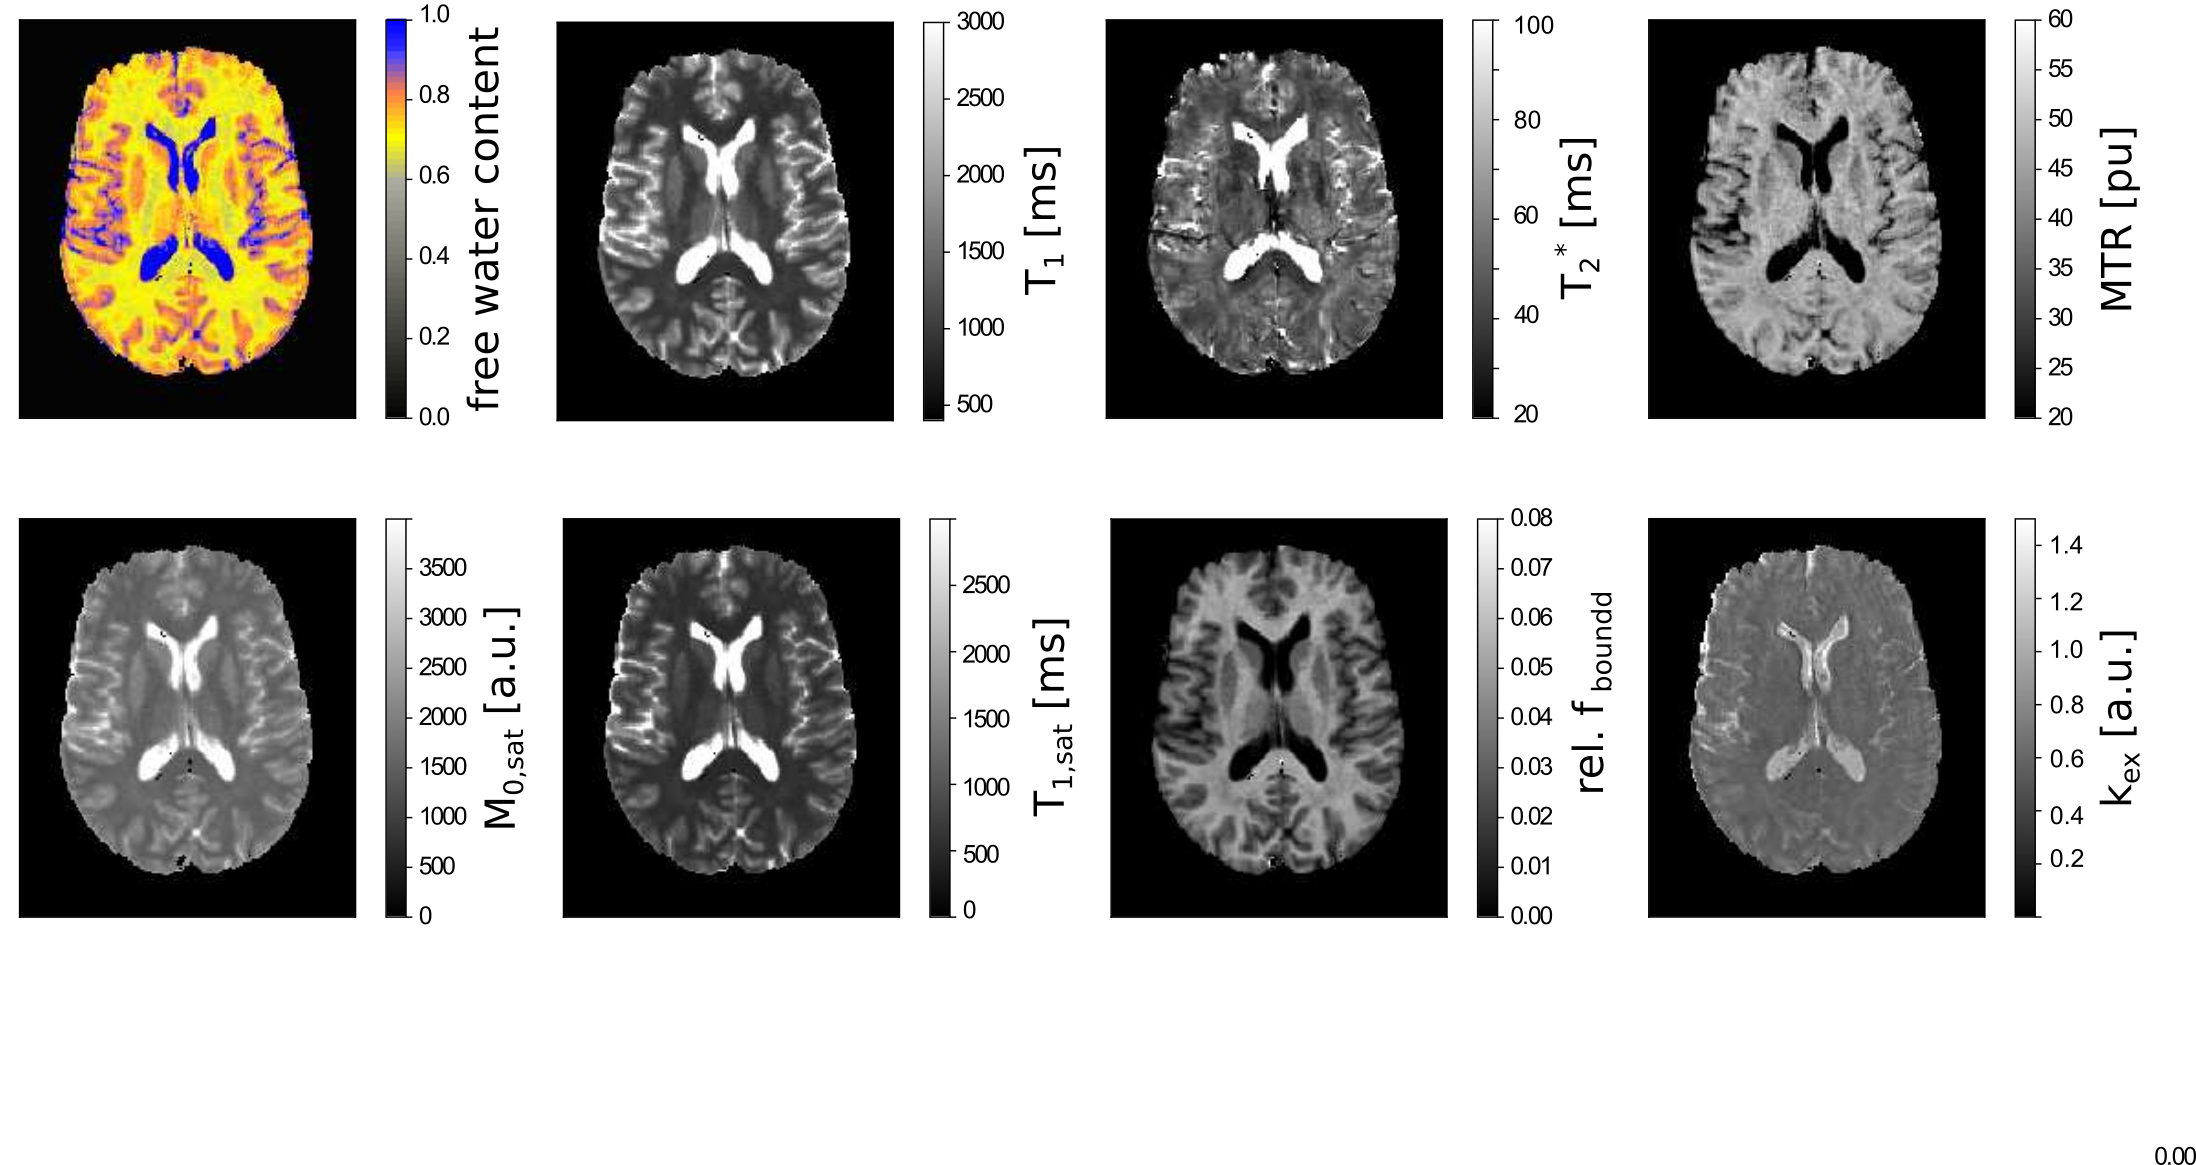
A multiparametric, quantitative method was implemented in a population-based study of normal ageing - the 1000Brains study. Several parameters are derived with whole-brain, high-resolution imaging in TA=21min: these included water content, T1 and T2* relaxation times, their changes in the presence of saturation and calculated qMT parameters - MTR, bound proton fraction fboundand forward magnetization exchange rate (kex). Methodological precision is high allowing for detecting of ageing effects as illustrated by several parameters (T1, T2*, H2O, fbound) from data sets of 25 healthy subjects (mean age 53±16 years, from 27 to 80, 18 male).
Introduction
The study of the effects of healthy aging on the human brain is a fundamental goal of neuroscience. The cortical and subcortical correlates of normal aging have been extensively investigated using several modalities including volumetric MRI, quantitative MRI (qMRI), cortical thickness measures and diffusion tensor imaging (DTI)1.
Multi-parametric, quantitative information, however, can be used to characterize changes related to ageing in a healthy population and subsequently identify pathology with better precision and accuracy. With the aim of identifying quantitative parameter changes and characterising the microscopic nature thereof, we implemented a multiparametric quantitative method in the MRI protocol of 1000Brains, a population-based study of normal ageing2. Nine separate magnitude-based parameters were measured in a session, providing intrinsically coregistered maps. In addition to measuring quantitative H2O (water content), T1 and T2*3, quantitative MT parameters were also derived; MT is now part of the standard toolkit for research studies investigating brain development, aging, and disease4.
Materials and Methods
Four separate multiple-echo 3D GRE acquisitions were used, complemented by AFI5 for B1+ mapping. The derived quantitative parameters were: H2O, T1, T2*, equilibrium longitudinal magnetization and relaxation times in the presence of saturation M0sat, T1satand T2*sat. The Ernst equation of spoiled steady-state was applied to two acquisitions with same TR and different flip angles, providing M0 and T1. T2* was derived from fitting the echo train decay. In addition to the broadly used MTR, quantitative MT parameters can be derived in a straightforward manner using the simplifications from Wolff and Balaban6: fraction of bound protons fbound and first-order magnetization transfer rate kex.
The precision and accuracy of the method was investigated and optimized in a manner similar to Schall et al. (2018). The method is reported in more detail elsewhere7. For consistency, the acquisition parameters are listed in the caption to Fig. 1, and the equations used to derive qMT parameters are:
MTR = (1-M0sat/ M0 * 100 [pu],
and
fbound ≈ M0b / M0a ∝ MTR / T1
where [pu] denotes percent unit, M0b is the bound proton and M0a is the free proton equilibrium magnetization.
We selected from more than 150 quantitative data sets and here we include only data sets from individuals with no, or negligible, white matter hyperintensities (WMH) (Fazekas scale 0 or 1). The individual 3D scans were coregistered before calculating the maps if motion between scans was detected. All maps were registered to the MNI space. The John Hopkins University (JHU) atlas8 in the FSL package9 was used to segment the ROIs.
An age-dependence analysis of the parameters was performed for each ROI using a linear regression of the model:
$$ Q (quantitative parameter) = x_1 ·age + x_0. $$
If the regression yielded a p-value of p<0.05 the age-dependent change was deemed significant.
Results
Relevant maps from a representative volunteer are shown in Fig. 1
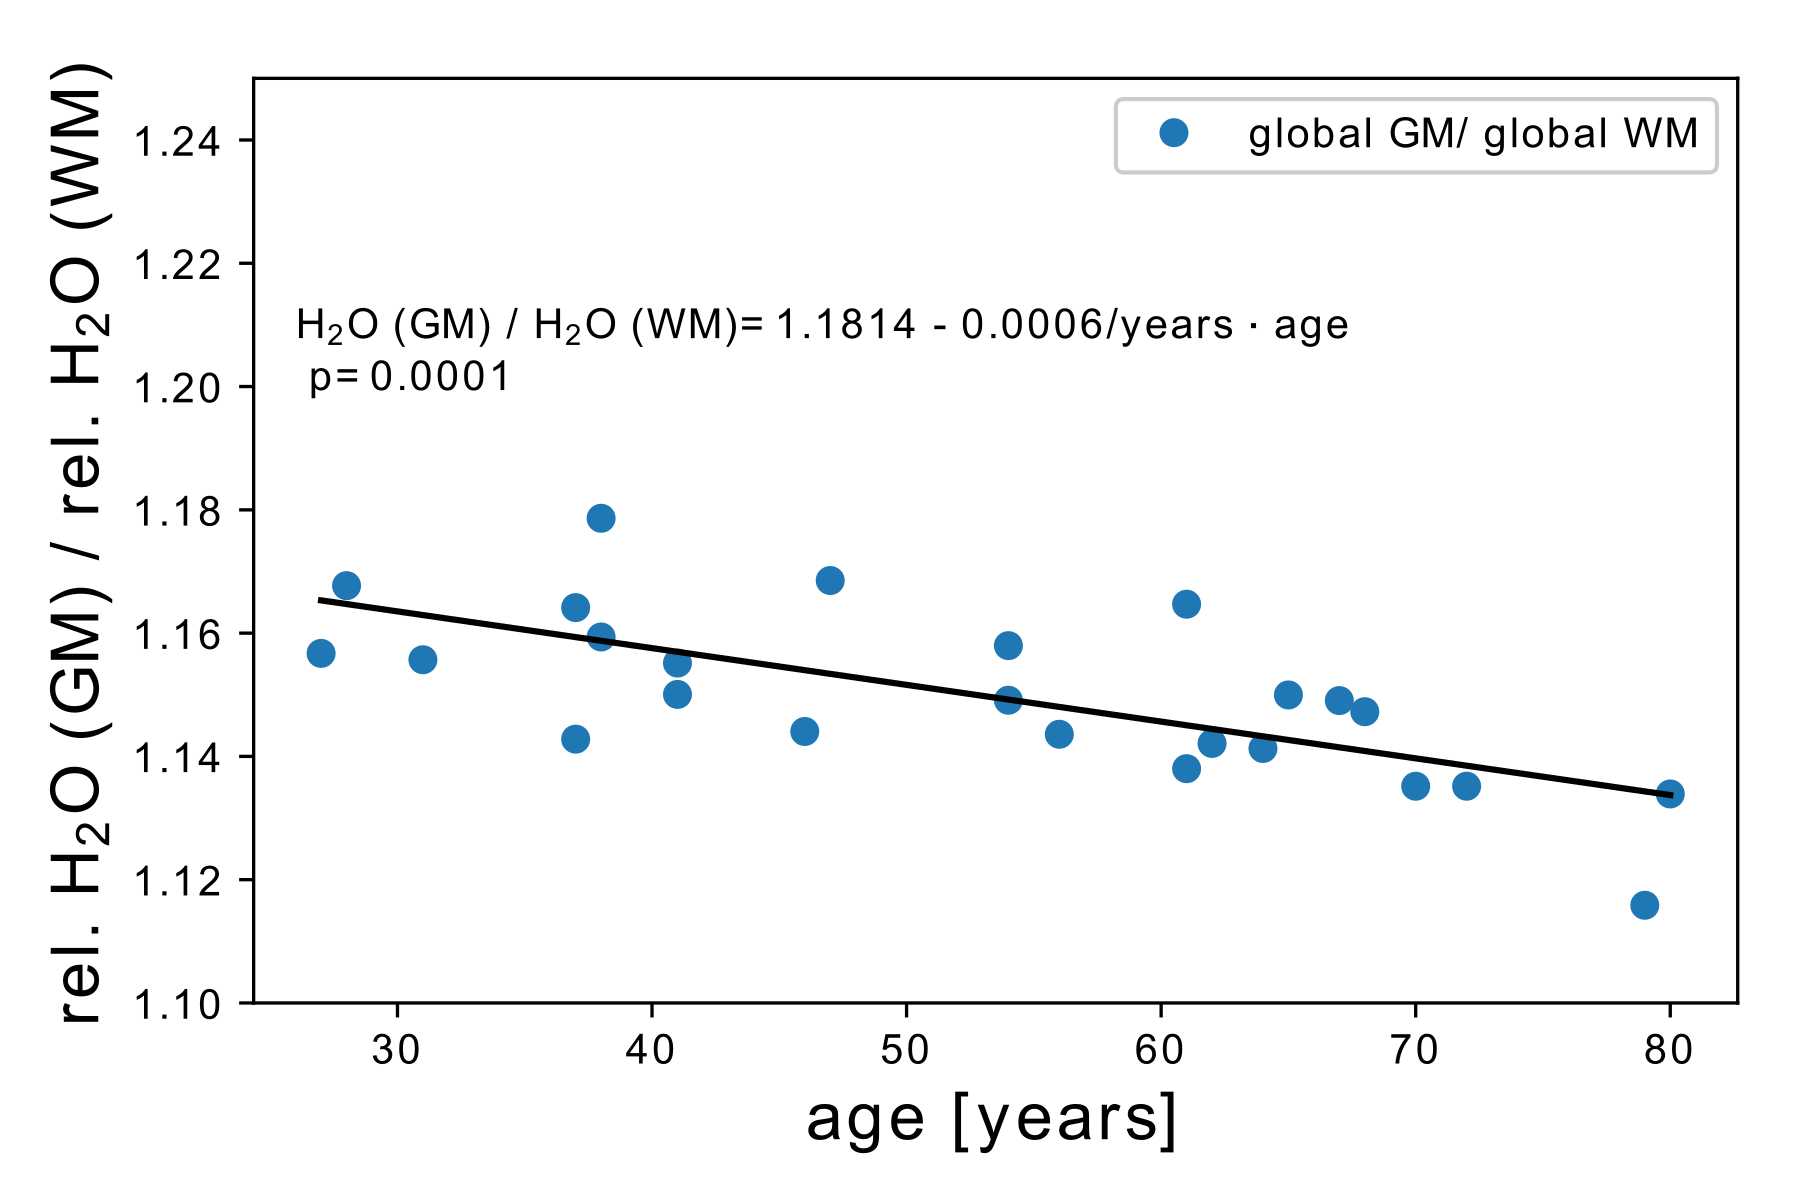
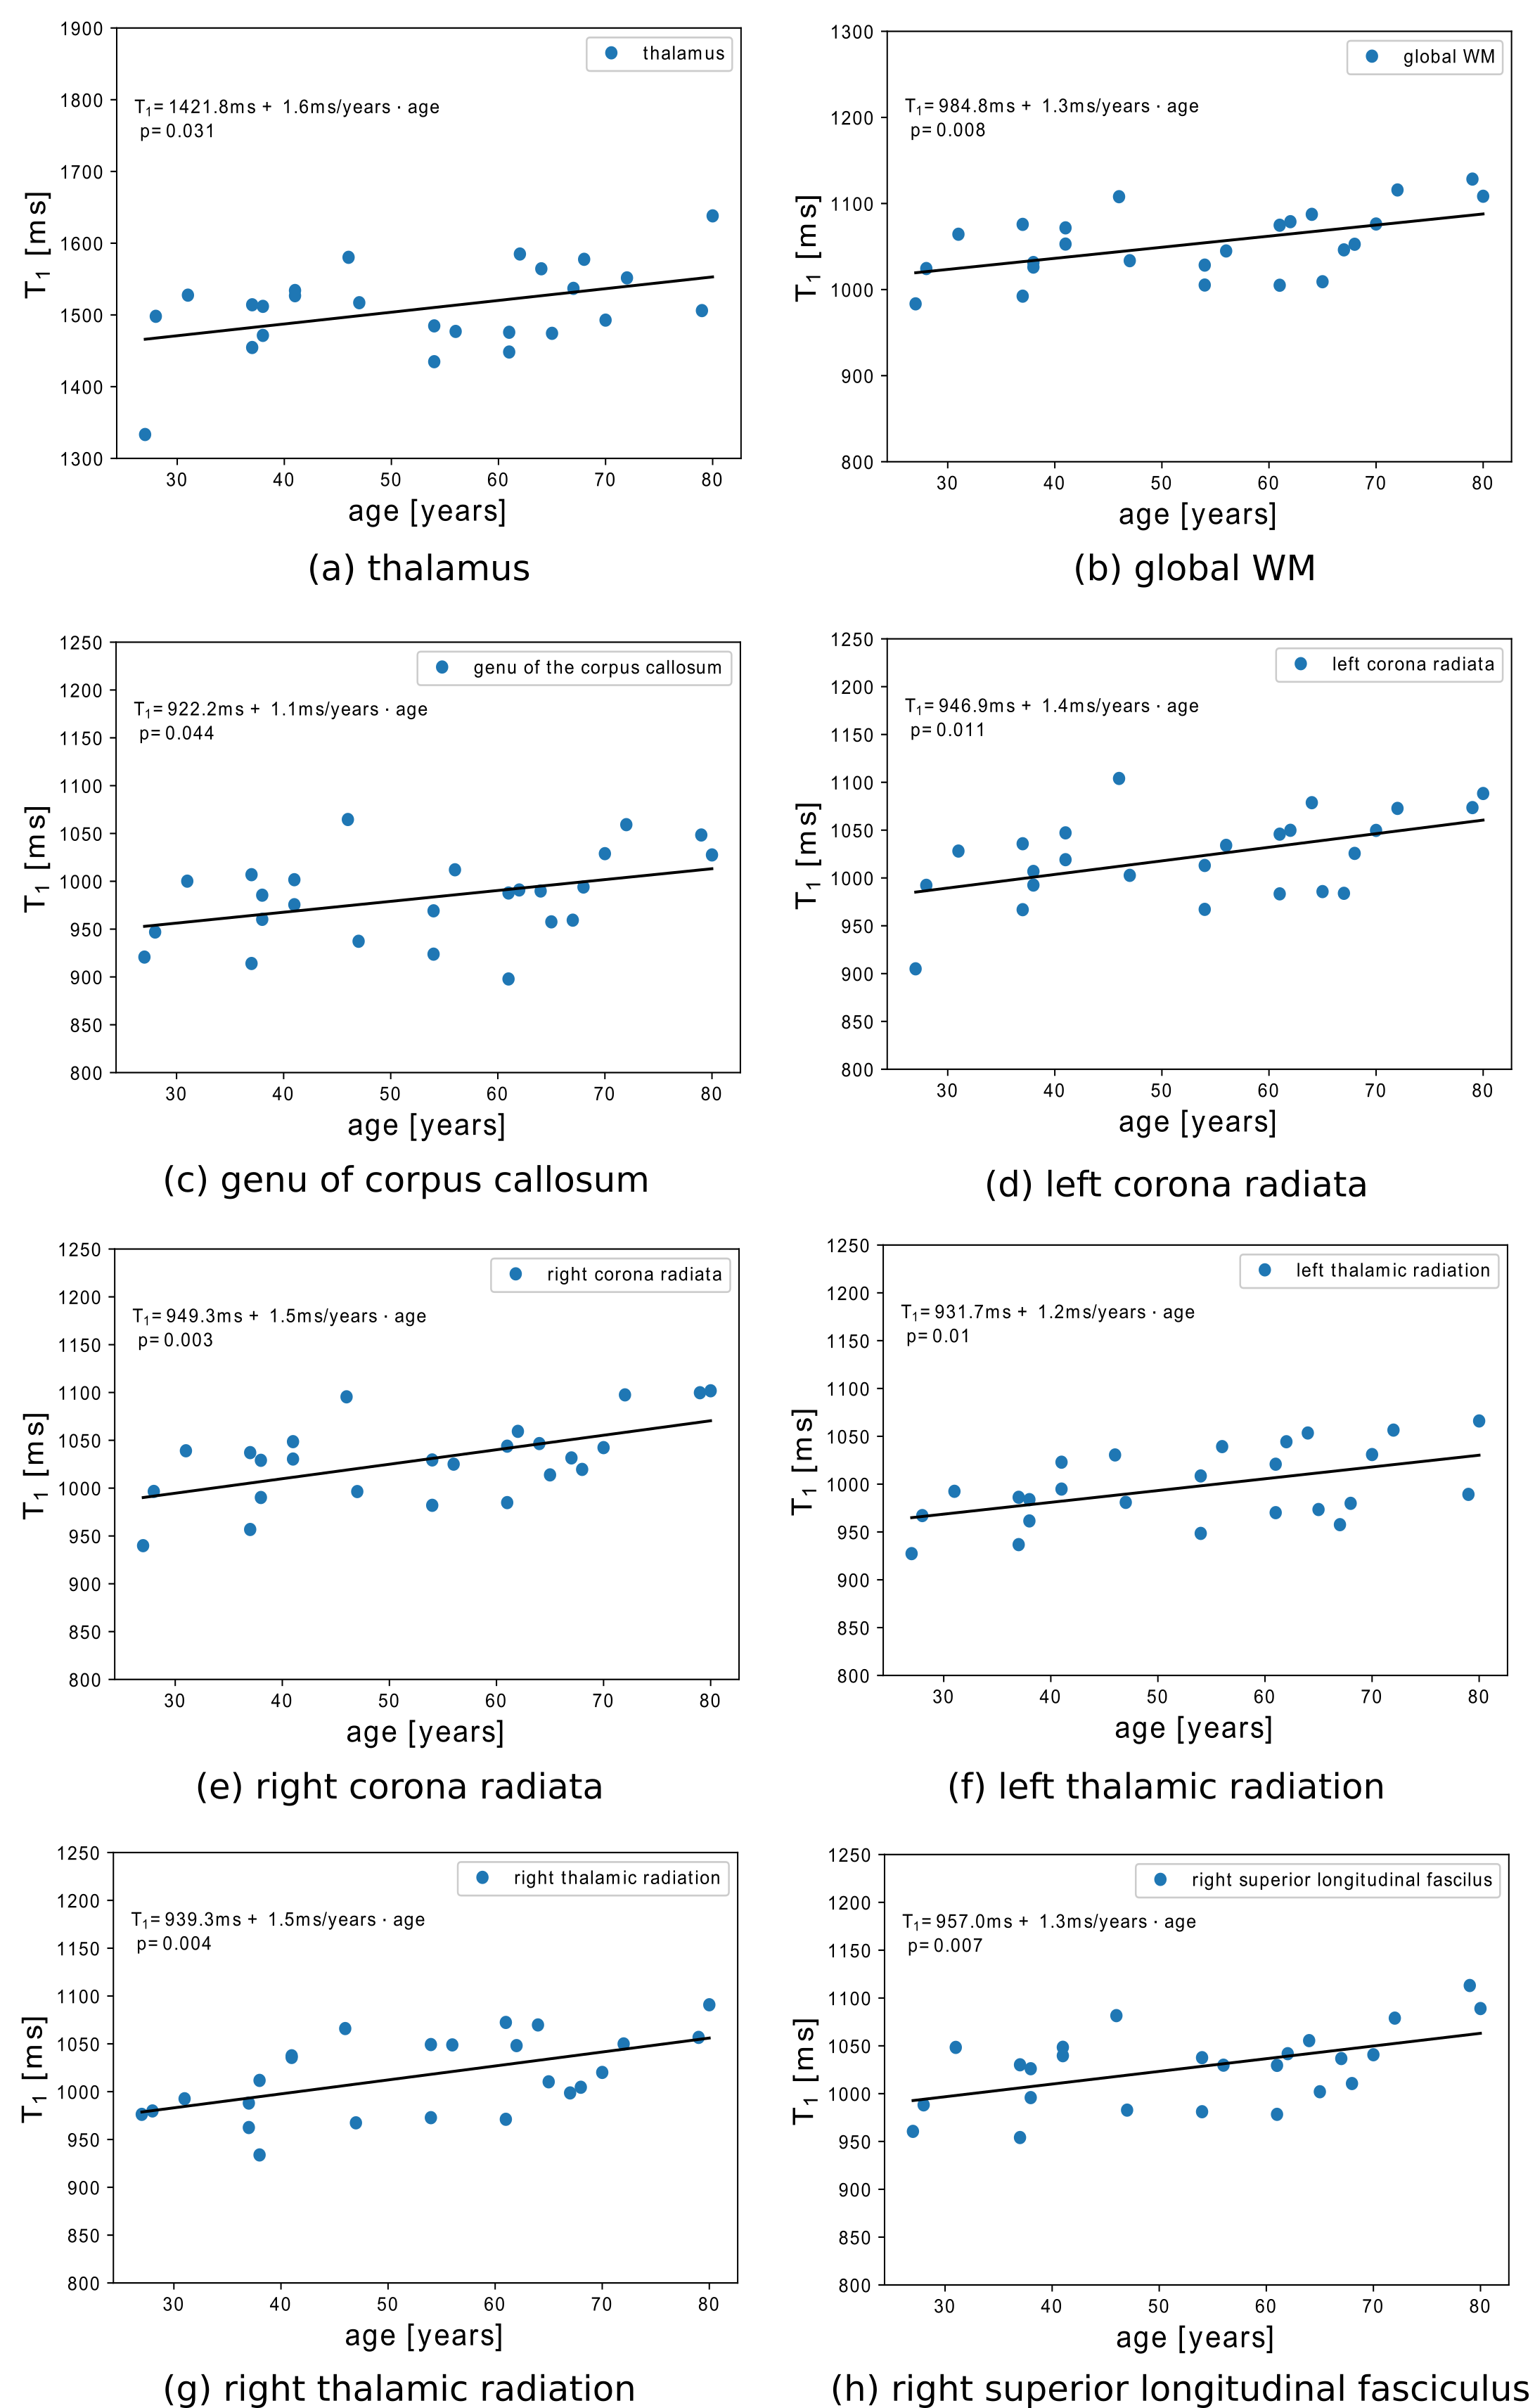
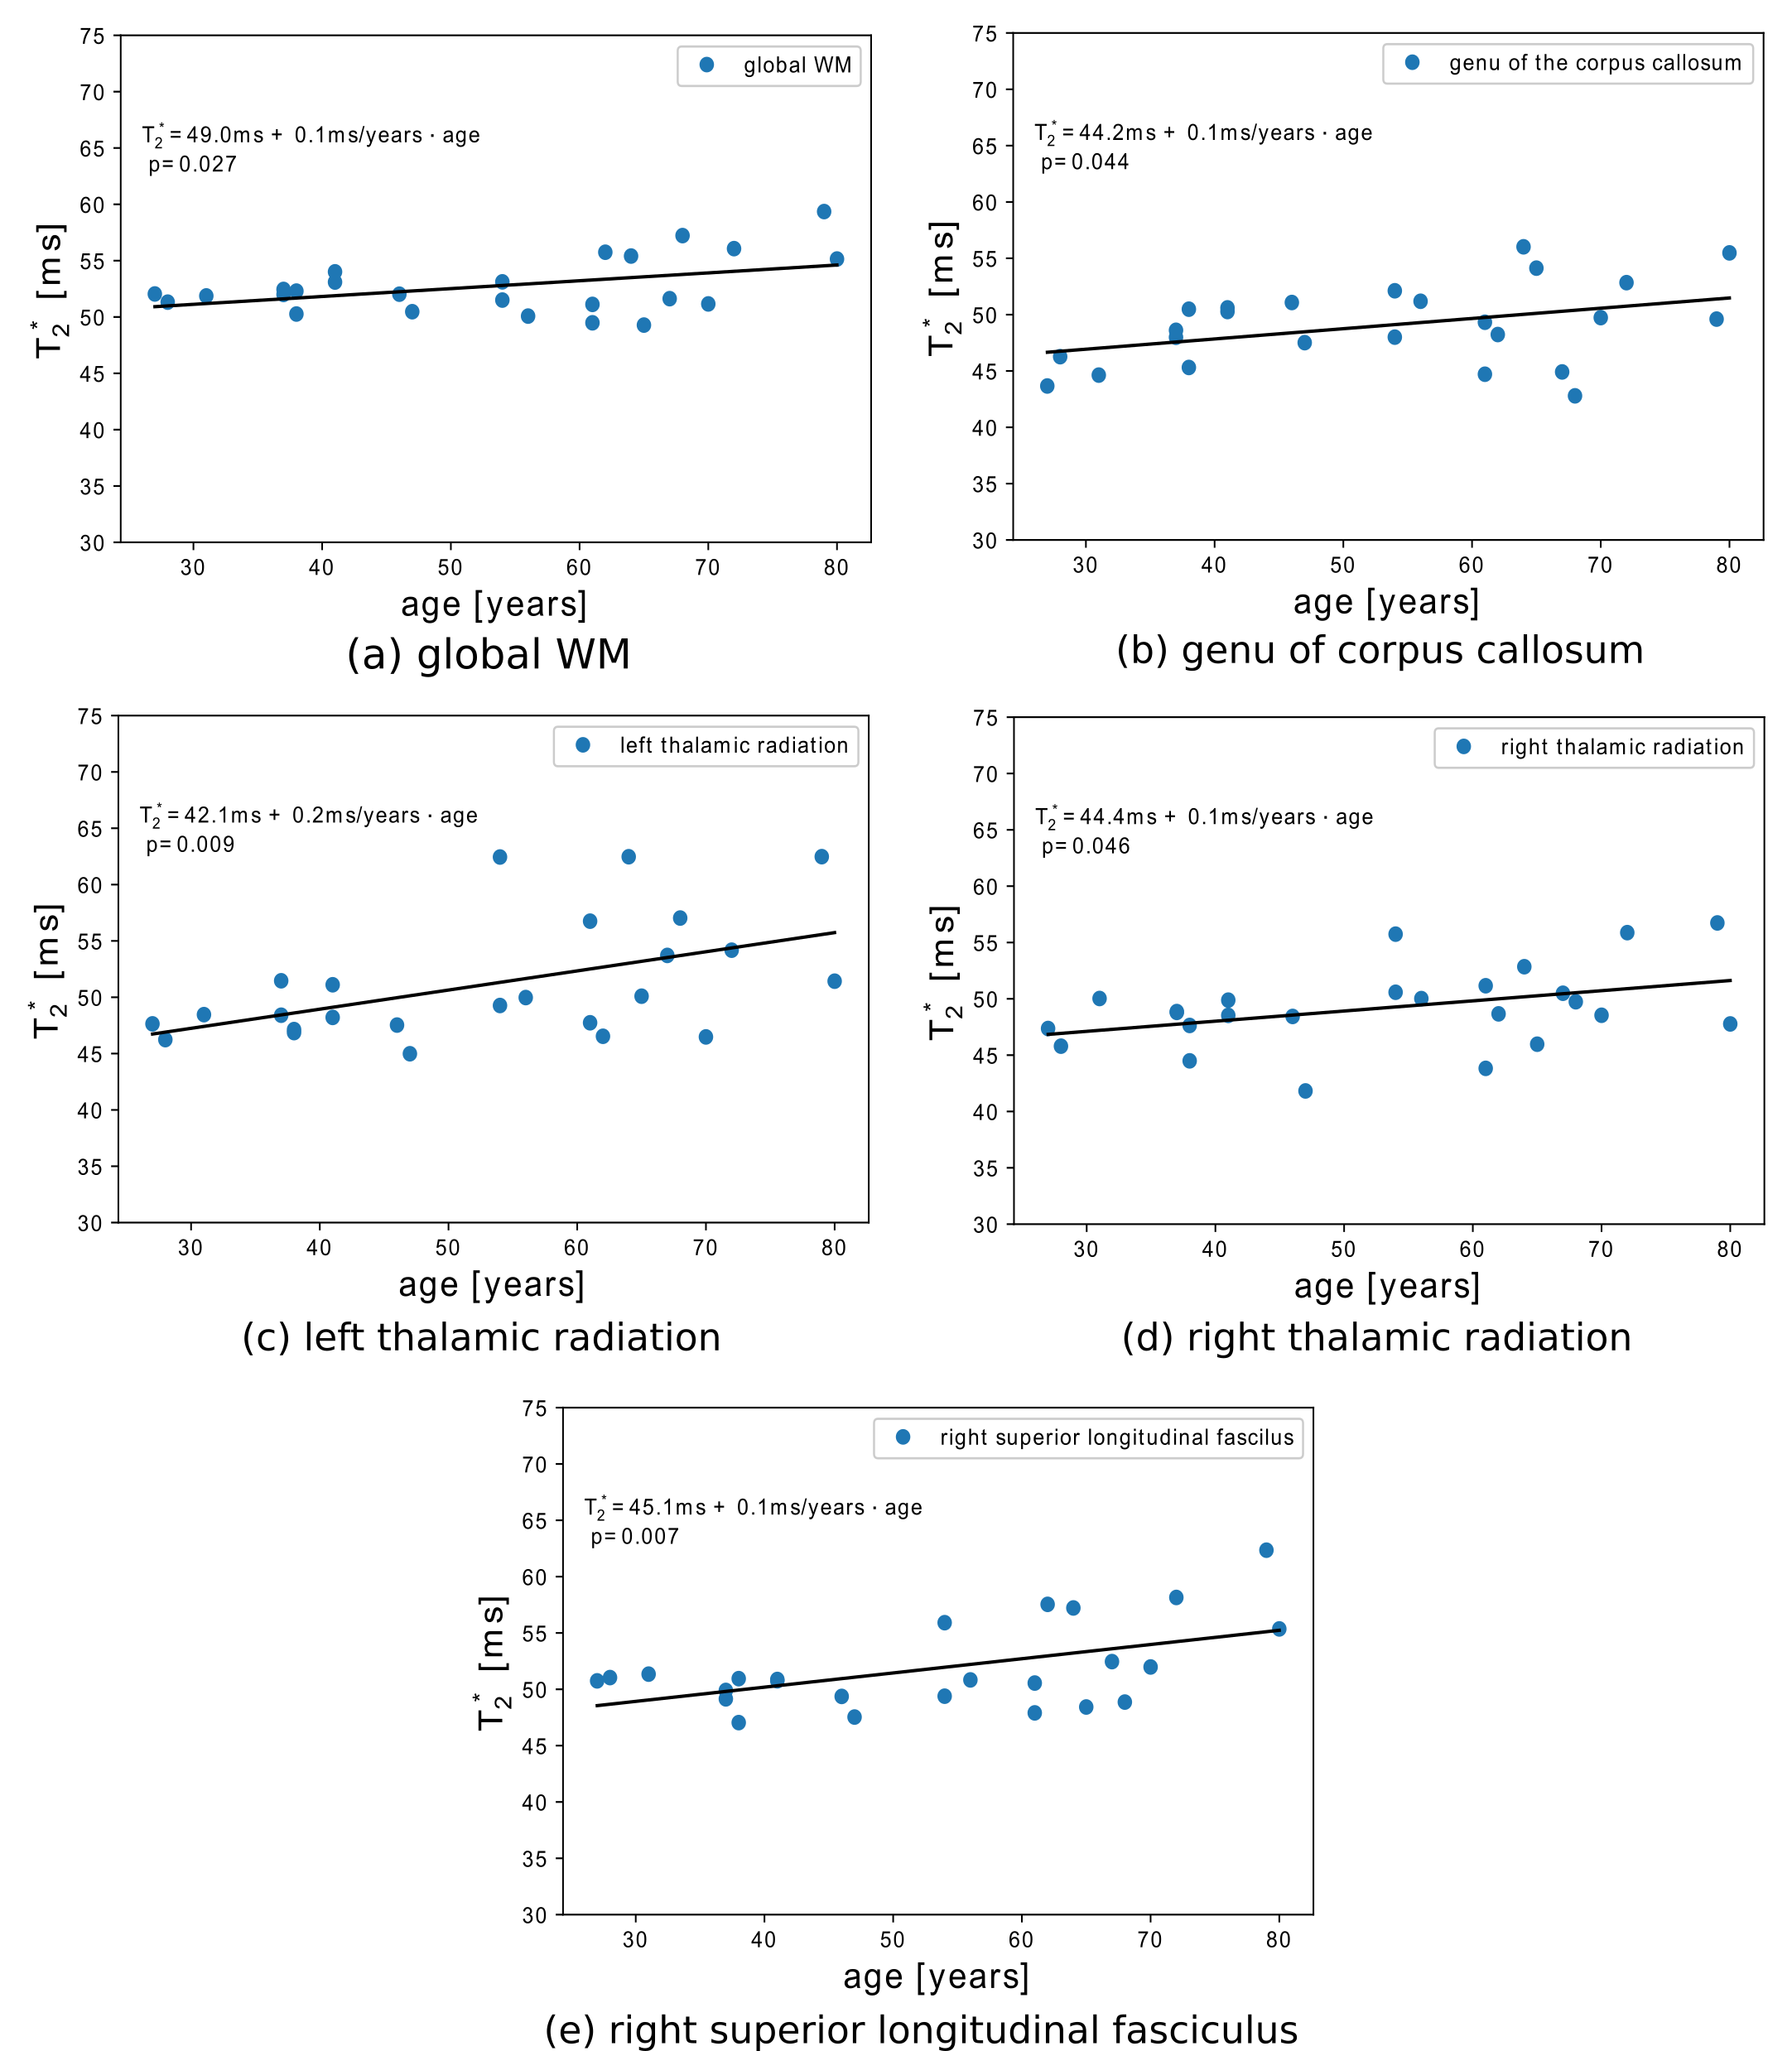
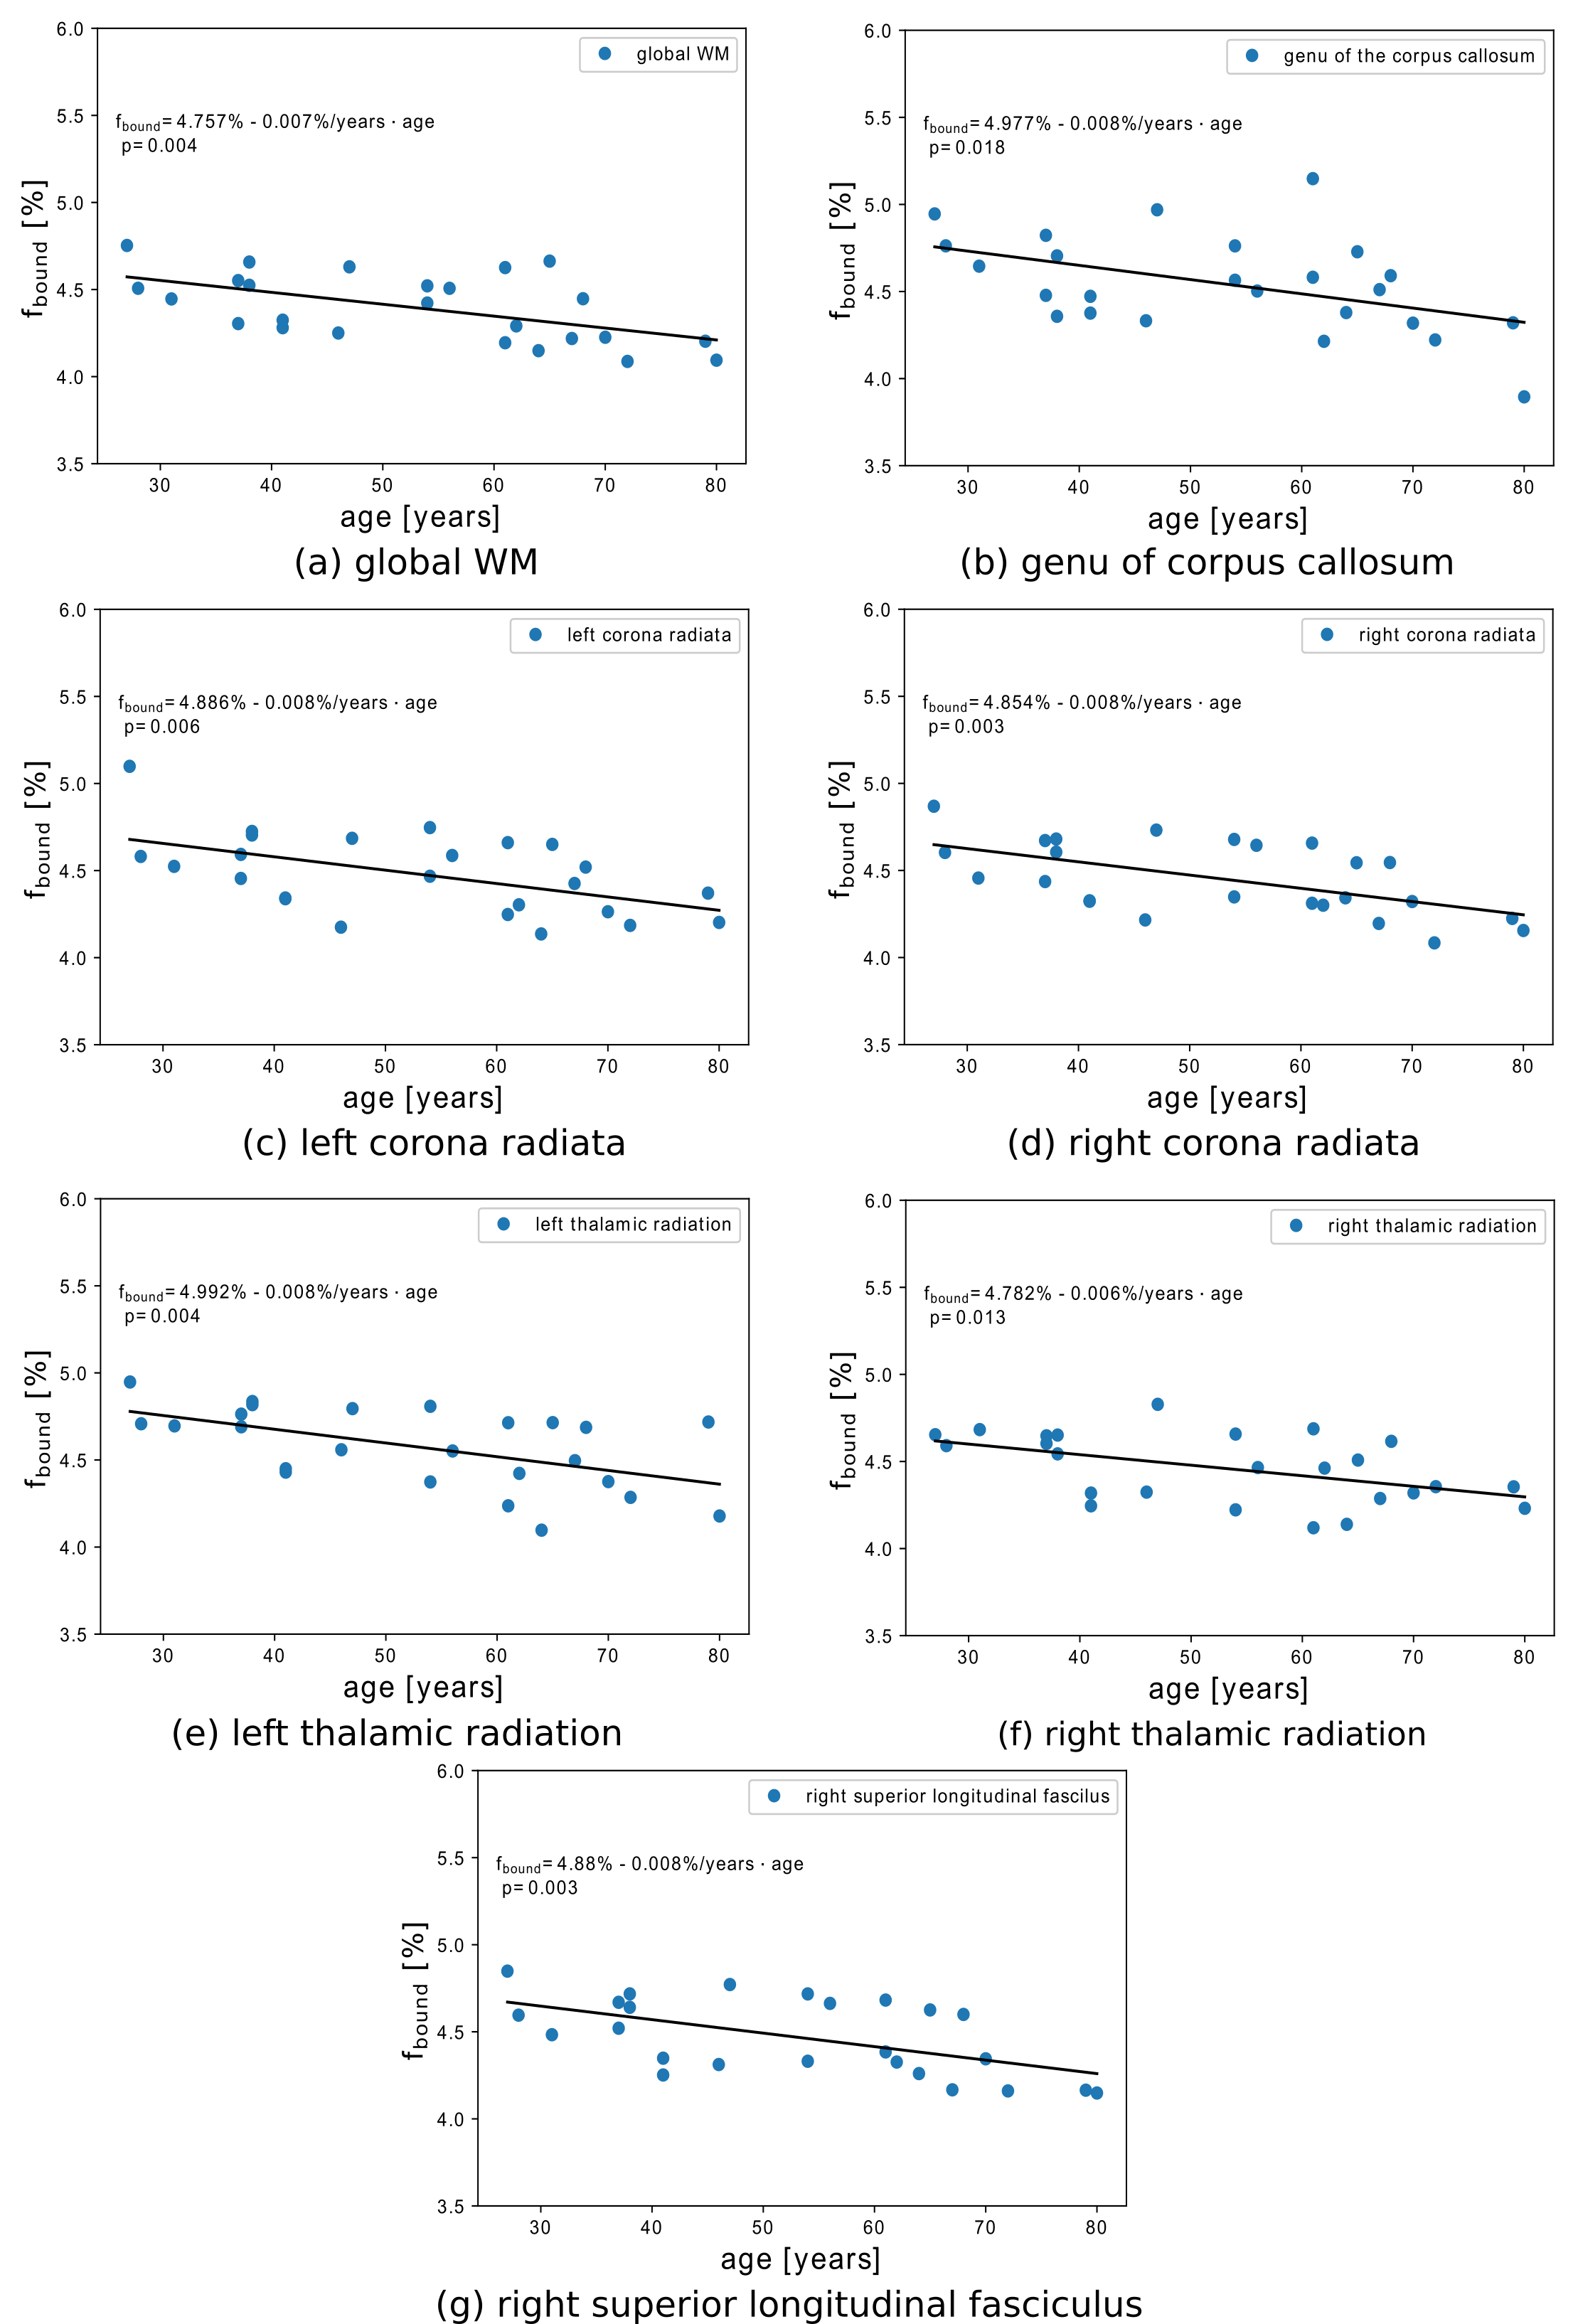
The ratio of H2Oin global GM to global WM was found to decrease significantly with age (-0.0006/year, p=0.0001) as shown in Fig. 2. However, changes in the separate global or ROI-based water content did not reach significance. The changes in T1are summarised in Fig. 3. T2*showed significant age-dependence in several regions, depicted in Fig. 4. Finally, a significant increase in fboundwas also demonstrated in several regions shown in Fig. 5. MTR did not change significantly with age in any region.
Discussion and Conclusions
The analysis yielded conclusive results mainly in WM regions. The increase in T1and T2*, together with a decrease in fbound, is consistent with demyelination occurring during the normal ageing process. While H2O did not change significantly, the ratio of H2O (GM) / H2O (WM) did decrease with age (p=0.0001). A decrease of H2O in GM during normal aging has been reported with a quadratic dependence and based on a larger population10. Our findings are more consistent with an increasein WM water content with age accompanied by unchanged H2O(GM).
Comparison with studies which did not exclude WMH can be expected to show differences, as water content in normal-appearing tissue was recently reported to correlate with WMH load11.
The limited size of our collective perhaps influenced conclusions related to MTR. Age-related changes of MTR were reported before1,12,13. MTR is, however, a hardware- and protocol-dependent parameter and only a surrogate marker of macromolecular content. Instead, the bound proton fraction fbound, derived here, was shown to display large and significant changes with age. Similar holds for T1 and T2*, markers of demyelination and iron accumulation.
Acknowledgements
References
1. Daniel Carey, Francesco Caprini, Micah Allen, Antoine Lutti, Nikolaus Weiskopf, Geraint Rees, Martina F. Callaghan, Frederic Dick, Quantitative MRI provides markers of intra-, inter-regional, and age-related differences in young adult cortical microstructure, NeuroImage, Volume 182, 2018, p 429-440
2. Caspers, S., Moebus, S., Lux, S., Pundt, N., Schütz, H., Mühleisen, T.W., Gras, V., Eickhoff, S.B., Romanzetti, S., Stöcker, T., Stirnberg, R., Kirlangic, M.E., Minnerop, M., Pieperhoff, P., Mödder, U., Das, S., Evans, A.C., Jöckel, K.H., Erbel, R., Cichon, S., Nöthen, M.M., Sturma, D., Bauer, A., Jon Shah, N., Zilles, K., Amunts, K., 2014. Studying variability in human brain aging in a population-based German cohort-rationale and design of 1000BRAINS. Front. Aging Neurosci. 6, 1–14
3. Schall, M., Zimmermann, M., Iordanishvili, E., Gu, Y., Shah, N.J., 2018. A 3D Two-Point Method for Whole-Brain Water Content and Relaxation Time Mapping : Comparison with Gold Standard Methods. PLoS One 13, 1–21
4. Henkelman, R.M., Stanisz, G.J. & Graham, S.J. Magnetization transfer in MRI: a review. NMR Biomed. 14, 57–64 (2001)
5. Yarnykh, V.L., 2007. Actual flip-angle imaging in the pulsed steady state: A method for rapid three-dimensional mapping of the transmitted radiofrequency field. Magn. Reson. Med. 57, 192–200
6. Wolff SD, Balaban RS. Magnetization Transfer Contrast (MTC) and Tissue Water Proton Relaxation In Vivo. Magn Reson Med 1989; 10: 135-144
7. A.M. Oros-Peusquens, M. Schall and N. Jon Shah. A high-resolution multi-parametric quantitative method to investigate tissue (micro)structure. Abstract submitted to present ISMRM
8. Mori, S., Wakana, S., Zijl, P.C.M. van, Nagae-Poetscher, L.M., 2005. MRI Atlas of Human White Matter, First Edit. ed. Elsevier Science
9. Woolrich, W., Jbabdi, S., Patenaude, B., Chappell, M., Makni, S., Behrens, T., Beckmann, C., Jenkinson, M., Smith, S.M., 2009. Bayesian analysis of neuroimaging data in FSL. Neuroimage 45, 173–186
10. Neeb, H., Zilles, K., Shah, N.J., 2006. Fully-automated detection of cerebral water content changes: Study of age- and gender-related H2O patterns with quantitative MRI. Neuroimage 29, 910–922
11. [0800] Iordanishvili, E., Schall, M., Loucao, R., Caspers, S., Kotetishvili, K., Shah, J., Oros-Peusquens, A. M. Quantitative Magnetic Resonance Imaging of the Human Brain with White Matter Hyperintensities: a New Approach towards Understanding the Underlying Pathology. Proc. Intl. Soc. Mag. Reson. Med. 26 (2018)
12. Ge, Y., Grossman, R.I., Babb, J.S., Rabin, M.L., Mannon, L.J., Kolson, D.L., 2002. Age-related total gray matter and white matter changes in normal adult brain. Part II: quantitative magnetization transfer ratio histogram analysis. AJNR Am J Neuroradiol 23, 1334–1341
13. Silver, N.C., Barker, G.J., MacManus, D.G., Tofts, P.S., Miller, D.H., 1997. Magnetisation transfer ratio of normal brain white matter: A normative datab ... J. ofNeurology, Neurosurgery, Psychiatry 62, 223–228
Figures