3334
Diagnosing MS using Central Veins at Clinically Relevant Image Resolutions1Faculty of Medicine & Health Sciences, The University of Nottingham, Nottingham, United Kingdom, 2Vall d'Hebron University Hospital, Barcelona, Spain, 3Nottingham University Hospitals NHS Trust, Nottingham, United Kingdom
Synopsis
The central vein sign is well documented as a biomarker for multiple sclerosis at high-resolution MRI. To investigate its potential at lower resolution and inform clinical MR protocol parameters, interpolation was used to demonstrate the effect of decreasing the resolution in 30 MS patients who underwent 7T-MRI. Finding were compared to 5 Non-MS groups (n = 82) at different resolutions using logistic regression. At half the original resolution the proportion of perivenular lesions changed considerably (73% to 47%), however, classification results remained unaffected provided the threshold (proportion of perivenular lesions) used for the differentiation decreased at lower resolution.
Introduction
Multiple sclerosis (MS) is a chronic, inflammatory and delaminating disease of the brain and spinal cord. Histological evidence supporting the primary vascular pathogenesis of MS makes the appearance of central veins in lesions highly sensitive to MS1-3. First demonstrated in-vivo 10 years ago4, current evidence from MRI studies indicates that the proportion of brain lesions with a central vein in MS is significantly higher than in other neurological conditions5-7.
Detection of central veins within lesions has been clearly demonstrated at high resolution 7T MRI but there are relatively few comparisons to lower resolution clinical scans8,9. There is a need to understand the effect image resolution has on the proportion of perivenular lesions and how this affects the differential diagnosis of MS from its mimics.
Methods
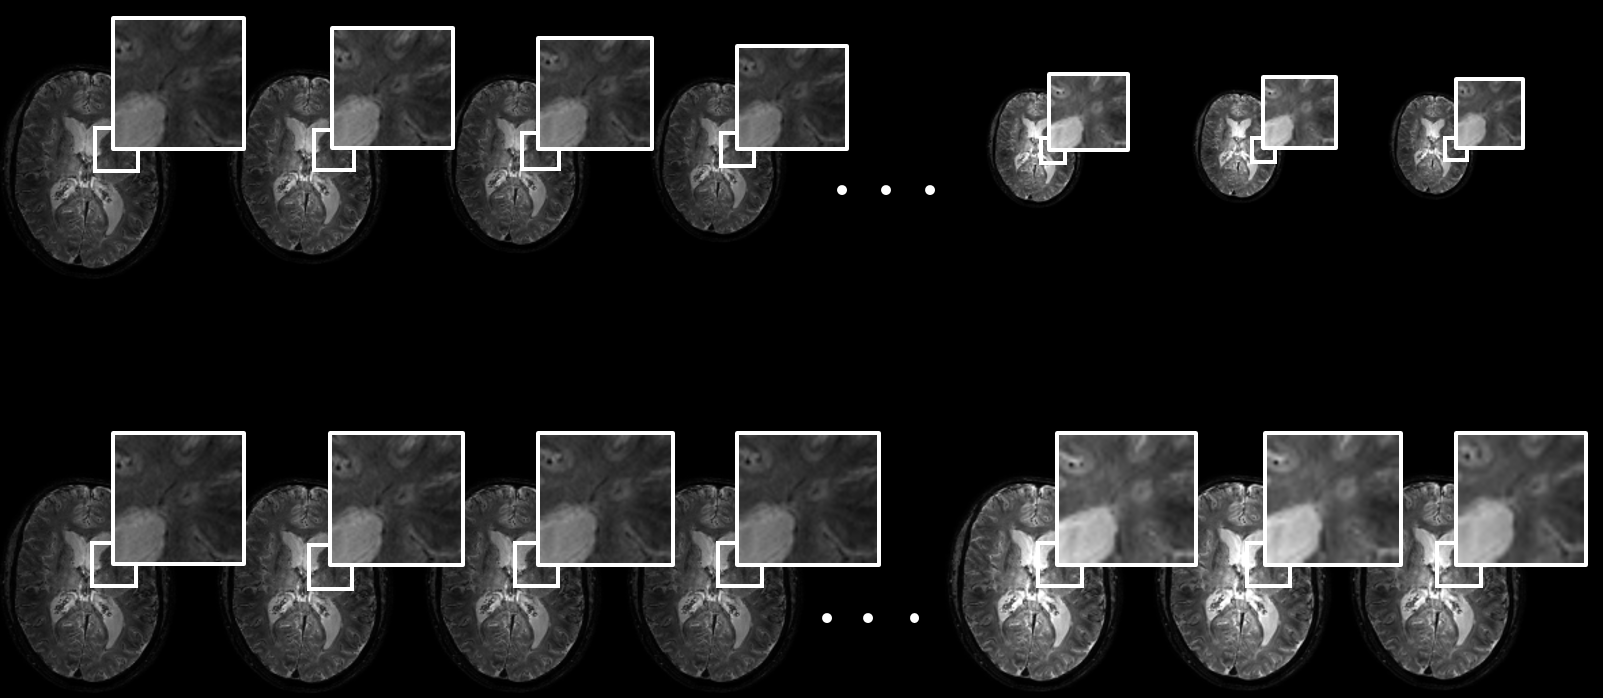
30 subjects with clinically defined MS and 8 subjects with cerebral vascular disease underwent high resolution (7T) T2* MRI. Image interpolation was used to downgrade the resolution of the 7T MRI scans over a clinically relevant range of resolutions (Figure 1, evaluation at 11 different resolution, range: 0.48-0.96mm isotropic voxels). At each resolution, the proportion of perivenous lesions was calculated for each subject based on the radiological definition given by the North American Imaging in Multiple Sclerosis Cooperative10.
Following a literature search of studies that used a T2* imaging protocol for the differential diagnosis of MS, previously published data on the proportion of perivenous lesions for individual patients with cerebral small vessel disease11 (CSVD, n = 17), migraine12 (n = 10), AQP4-IgG-postive neuromyelitis optica spectrum disorder13 (NMOSD, n = 16) and inflammatory vasculopathies14 (IV, n = 31) was collected. The change in the proportion of perivenous lesions with resolution observed in MS patients in our study was applied to the study data taken from literature for other neurological conditions.
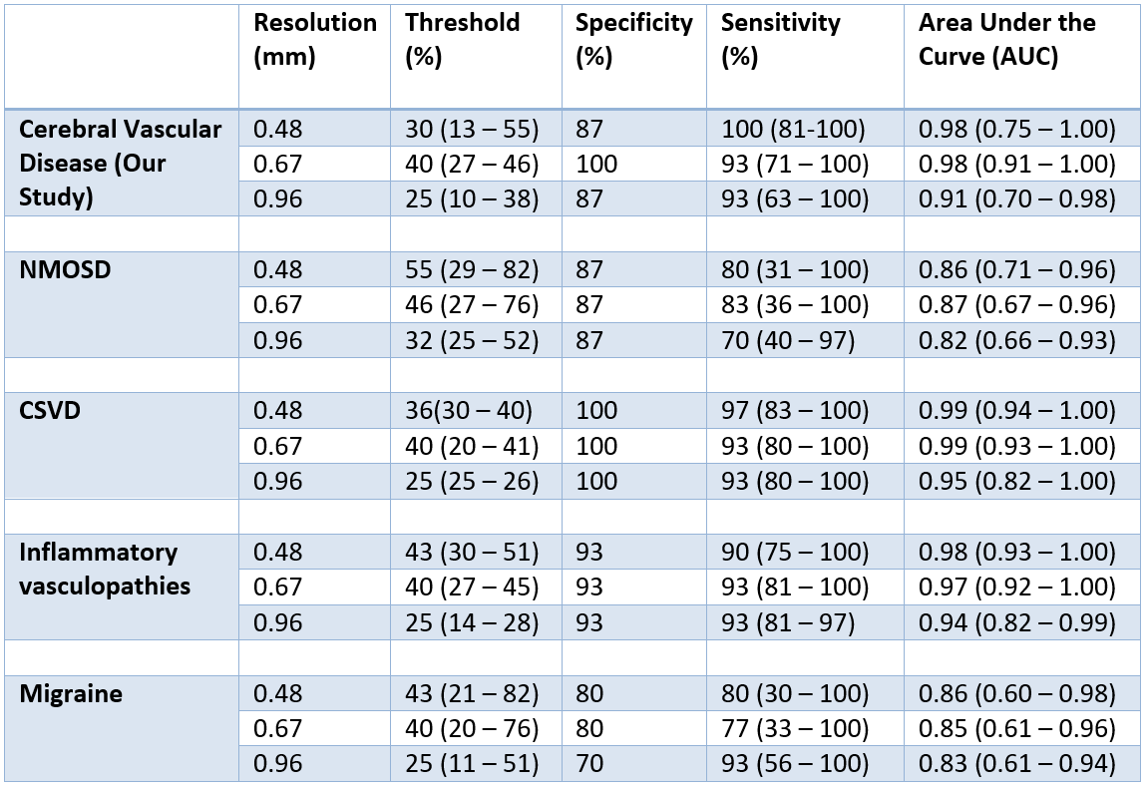
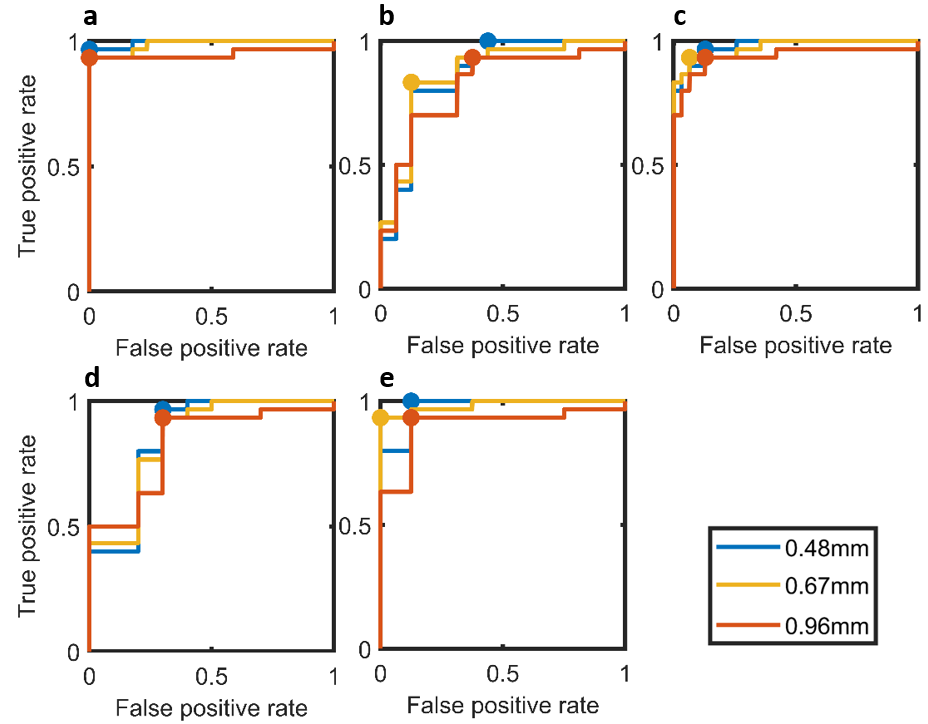
Logistic regression was used to compare the proportion of perivenous lesions in subjects with clinically defined MS to those with other neurological conditions. From the Receiver Operator Characteristic (ROC) curves the optimal threshold, sensitivity, specificity and Area Under the Curve (AUC) was obtained for high, medium and low resolutions (0.48, 0.68, 0.96mm respectively). For each group AUC values were compared for high-medium and height-low resolutions using a test for identical AUCs15.
Results
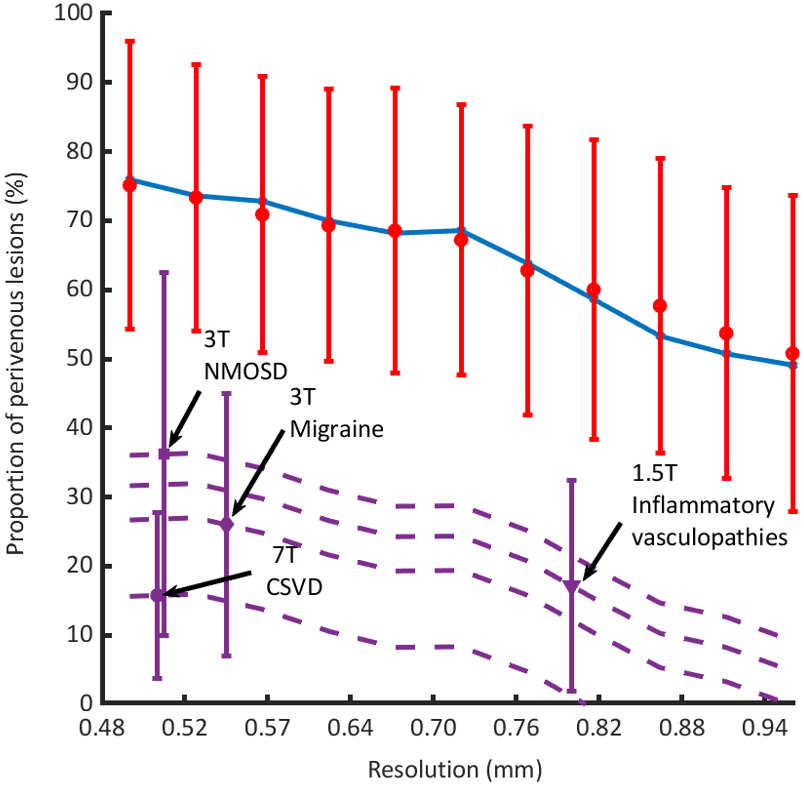
The proportion of perivenular lesions in the MS group and the groups acquired in the literature search are shown in Figure 2. The total proportion of perivenular lesions in the MS group decreased by 27% over the resolution range, while for the 8 subjects with cerebral vascular disease there was no evident change (mean of 13 – 16 %, with 95% CI range: 4 – 32%). Results from the logistic regression are presented in Figure 3 and Table 1. The inter-group comparison showed no significant difference between AUCs at high, medium and low resolutions.Discussion
Due to the low number of perivenular lesions and small sample size in our study the proportion of perivenous lesions in other neurological conditions was also taken from previous studies which used similar T2* weighted imaging protocols. It was assumed that the proportion of perivenular lesions in these conditions followed the trend set by the MS group in our study; however, this may not be the case for all diseases.
Interpolation results in lower Signal to Noise Ratio (SNR) than re-acquisition at lower resolution16,17; therefore in practice at least the same proportion of perivenular lesions should be detected. Also, the interpolation method doesn’t reflect sequence modifications to account for differing magnetic susceptibilities at various field strengths8,18.
Intra group AUC comparisons did not show significant differences in AUC values with resolution; this is likely because the threshold (the proportion of perivenular lesions) used to differentiate the groups changed. While this effect was not seen in our cerebral vascular group due to low numbers of perivenular lesions, the threshold decreased at lower resolutions for comparison of MS with the other groups. The results generated by comparing the MS group to MS-mimicking conditions suggests that high sensitivity and specificity is achievable, even at clinical resolutions.
Conclusion
A large decrease in the proportion of perivenular lesions was observed with resolution (73% to 47% over resolution range 0.48 to 0.96mm). At a clinically relevant resolution (0.67mm) the sensitivity and specificity for the diagnosis of MS from other neurological conditions appears good. Results were worst for migraine with sensitivity 77% (33 – 100%) at a specificity of 80%. To maintain a high diagnostic accuracy it is important to consider the effects of resolution on the threshold (proportion of perivenular lesions) used for the differentiation diagnosis of MS.Acknowledgements
No acknowledgement found.References
1. Fog, T. "On the vessel‐plaque relationships in the brain in multiple sclerosis." Acta Neurologica Scandinavica 40.S10 (1964): 9-15.
2. Putnam, Tracy J. "The pathogenesis of multiple sclerosis: a possible vascular factor." New England Journal of Medicine209.16 (1933): 786-790.
3. Frohman, Elliot M., Michael K. Racke, and Cedric S. Raine. "Multiple sclerosis—the plaque and its pathogenesis." New England Journal of Medicine 354.9 (2006): 942-955.
4. Hammond, K. E. et al. Quantitative in vivo magnetic resonance imaging of multiple sclerosis at 7 Tesla with sensitivity to iron. Ann. Neurol. 64, 707–713 (2008).
5. Mistry, N., Dixon, J., Tallantyre, E., Tench, C., Abdel-Fahim, R., Jaspan, T., Morgan, P.S., Morris, P. and Evangelou, N., 2013. Central veins in brain lesions visualized with high-field magnetic resonance imaging: a pathologically specific diagnostic biomarker for inflammatory demyelination in the brain. JAMA neurology, 70(5), pp.623-628.
6. Massacesi, L., 2016. Evaluation by brain Mri of white matter perivenular lesions in inflammatory micro-angiopatic ischemia and in demyelinating multiple sclerosis lesions. European Journal of Neurology, 23, p.86.
7. Wuerfel, J., Sinnecker, T., Ringelstein, E.B., Jarius, S., Schwindt, W., Niendorf, T., Paul, F., Kleffner, I. and Dörr, J., 2012. Lesion morphology at 7 Tesla MRI differentiates Susac syndrome from multiple sclerosis. Multiple Sclerosis Journal, 18(11), pp.1592-1599
8. Tallantyre, Emma C., et al. "A comparison of 3T and 7T in the detection of small parenchymal veins within MS lesions." Investigative radiology 44.9 (2009): 491-494.
9. Kollia, K., Maderwald, S., Putzki, N., Schlamann, M., Theysohn, J.M., Kraff, O., Ladd, M.E., Forsting, M. and Wanke, I., 2009. First clinical study on ultra-high-field MR imaging in patients with multiple sclerosis: comparison of 1.5 T and 7T. American Journal of Neuroradiology, 30(4), pp.699-702.
10. Sati, Pascal, et al. "The central vein sign and its clinical evaluation for the diagnosis of multiple sclerosis: a consensus statement from the North American Imaging in Multiple Sclerosis Cooperative." Nature Reviews Neurology (2016).
11. Tallantyre, E. C., et al. "Ultra-high-field imaging distinguishes MS lesions from asymptomatic white matter lesions." Neurology 76.6 (2011): 534-539.
12. Solomon, A.J., Schindler, M.K., Howard, D.B., Watts, R., Sati, P., Nickerson, J.P. and Reich, D.S., 2016. “Central vessel sign” on 3T FLAIR* MRI for the differentiation of multiple sclerosis from migraine. Annals of clinical and translational neurology, 3(2), pp.82-87.
13. Cortese, R., Magnollay, L., Tur, C., Abdel-Aziz, K., Jacob, A., De Angelis, F., Yiannakas, M.C., Prados, F., Ourselin, S., Yousry, T.A. and Barkhof, F., 2018. Value of the central vein sign at 3T to differentiate MS from seropositive NMOSD. Neurology, 90(14), pp.e1183-e1190.
14. Vuolo L, Sati P, Massacesi L, Reich DS. Efficiency of FLAIR* at 1.5T, 3T, and 7T for detecting perivenular lesions in multiple sclerosis (MS). [abstract P479]. Presented at the 31st Congress of the European Committee for Treatment and Research in Multiple Sclerosis (2015).
15. Hanley JA, McNeil BJ. The meaning and use of the area under a Receiver Operating Characteristic (ROC) curve. Radiology, 1982, 143, 29-36.
16. Vaseghi, S.V., 2008. Advanced digital signal processing and noise reduction. John Wiley & Sons
17. Haacke, E. Mark, et al. Magnetic resonance imaging: physical principles and sequence design. Vol. 82. New York: Wiley-Liss, 1999.
18. Kilsdonk, I.D., Lopez-Soriano, A., Kuijer, J.P., de Graaf, W.L., Castelijns, J.A., Polman, C.H., Luijten, P.R., Geurts, J.J., Barkhof, F. and Wattjes, M.P., 2014. Morphological features of MS lesions on FLAIR* at 7 T and their relation to patient characteristics. Journal of neurology, 261(7), pp.1356-1364.
Figures