3331
Neuromelanin-sensitive Magnetic Resonance Imaging Study of the Substantia Nigra in Huntington’s Disease1ISR-Lisbon/LARSyS and Department of Bioengineering, Instituto Superior Técnico - University of Lisbon, Lisbon, Portugal, 2Neurological Imaging Department, Hospital de Santa Maria - CHLN, Lisbon, Portugal, 3Instituto de Medicina Molecular, Faculdade de Medicina, University of Lisbon, Lisbon, Portugal, 4Department of Neurosciences and Mental Health, Neurology, Hospital de Santa Maria - CHLN, Lisbon, Portugal, 5CNS – Campus Neurológico Sénior, Torres Vedras, Portugal
Synopsis
Neuromelanin(NM)-sensitive MRI (NM-MRI) is a promising technique to study pathological changes in NM-containing structures, such as the substantia nigra pars compacta (SNc). This midbrain structure modulates the corticostriatal pathway through the striatum, which is known to degenerate in Huntington’s Disease (HD). Our study used NM-MRI for the first time to study HD, with a semi-automatic segmentation method to evaluate the SNc, compatible with dopaminergic neuronal loss in the SNc of HD patients. SNc NM correlated with the volumes of the caudate, putamen and globus pallidus, suggesting that SNc neuronal loss and basal ganglia atrophy may not be independent processes.
Introduction
Huntington’s Disease (HD) is an autosomal-dominant and fatal neurodegenerative disorder, caused by mutations in the huntingtin gene1. HD symptoms arise from degeneration and dysfunction of the corticostriatal pathway, associated with movement regulation2. Currently, there is no validated imaging biomarker for the study of HD progression3, nor any disease-modifying therapies4. Dopaminergic projections from Neuromelanin(NM)-containing neurons of the substantia nigra pars compacta (SNc) to the striatum modulate the corticostriatal pathway5. To the best of our knowledge, SNc NM changes have never been assessed in HD using magnetic resonance imaging (MRI). This study was aimed at evaluating the volume changes in the basal ganglia of HD patients, at quantifying indirectly the NM in the SNc in NM-sensitive MR (NM-MR) images, and at investigating the relation between these parameters.
Methods
8 HD patients and 12 healthy controls were imaged in a 3T Philips Achieva scanner with an 8 channel head-coil using a T1-weighted 3D Turbo Field Echo (TFE) sequence (TE/TR 4.6/9.6 ms, resolution 0.74x0.86x1.0 mm3, field of view – FOV 250x250 mm2) including an inversion recovery pulse, and with a NM-MRI 2D Fast Spin Echo (FSE) sequence with TE/TR 10/607 ms, turbo factor 3, resolution 0.40x0.40 mm2, slice thickness 2.5 mm, FOV 220x190 mm2, 20 slices and acquisition time 8:20 minutes.
Basal ganglia volumes and the intracranial volume (ICV) were measured using automatic segmentation (Freesurfer v.6.06). For each subject, the caudate, putamen and Globus Pallidus (GP) volumes were divided by the ICV to yield the relative volumes of each structure.
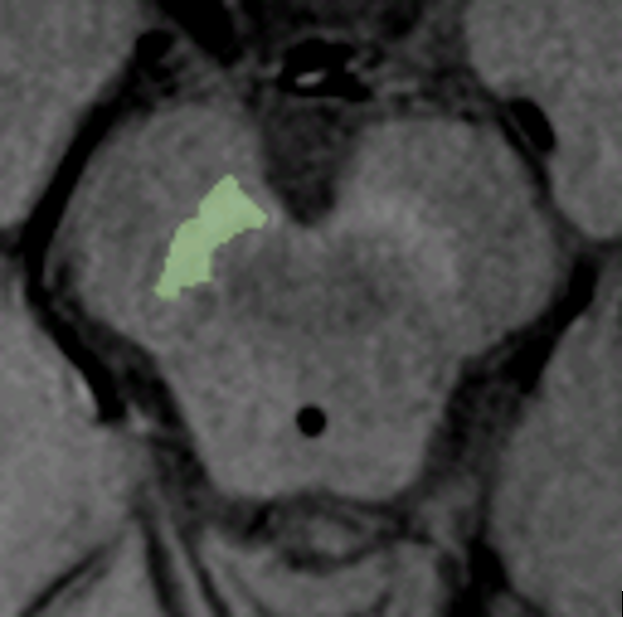
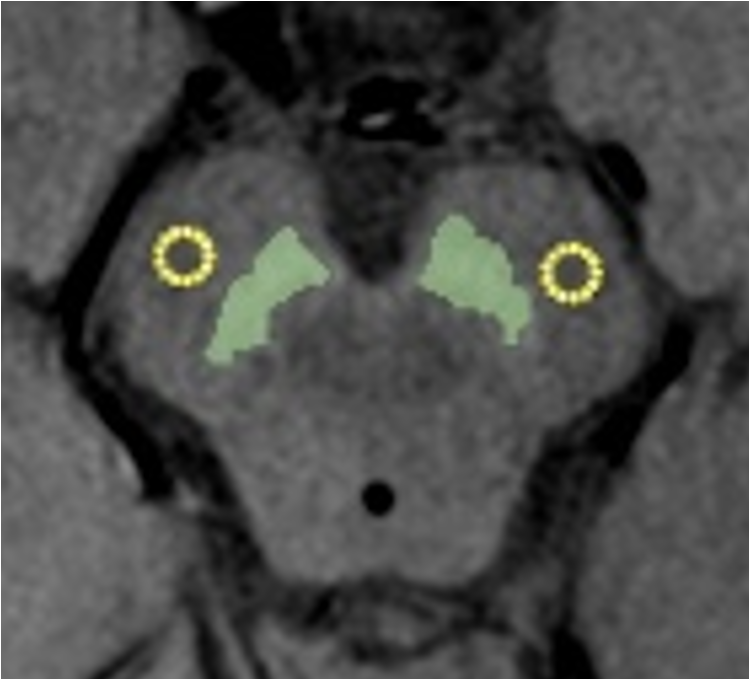
Single-slice SNc segmentation was performed using a semi-automatic region growing algorithm in NM-MR images after application of a Gaussian blur filter in the OsiriX software (Lite v.9.57). A semi-automatic SNc segmentation is exemplified in Figure 1. The midbrain area was manually segmented in the same slice and the ratio of SNc to midbrain areas was calculated for each hemisphere. The Contrast Ratio (CR) between each SNc area and a circular 8mm2-reference region-of-interest (ROI) placed in the central crus cerebri was determined, as shown in Figure 2:
$$ CR=I_{SNc}/I_{CC} ×100 $$
where $$$I_{SNc}$$$ is the mean intensity of the pixels contained in the SNc area and $$$I_{CC}$$$ is the mean intensity of the pixels included in the reference ROI.
All statistical analyses were performed with non-parametric tests in R (v.3.5.1). A p-value lower than 0.05 was considered significant. The Wilcoxon test for paired samples was used to assess differences in parameters measured in each brain hemisphere. Differences in the parameters between HD patients and controls were evaluated with the Mann-Whitney U test. The Spearman rank-order correlation test was used to investigate correlations between SNc ratios and basal ganglia volumes.
Results
8 HD patients with a median age of 46 (ranging 27-81) years and a disease duration of 7.5 (1-16) years, and 12 healthy controls with a median age of 62 (49-83) years were analysed.
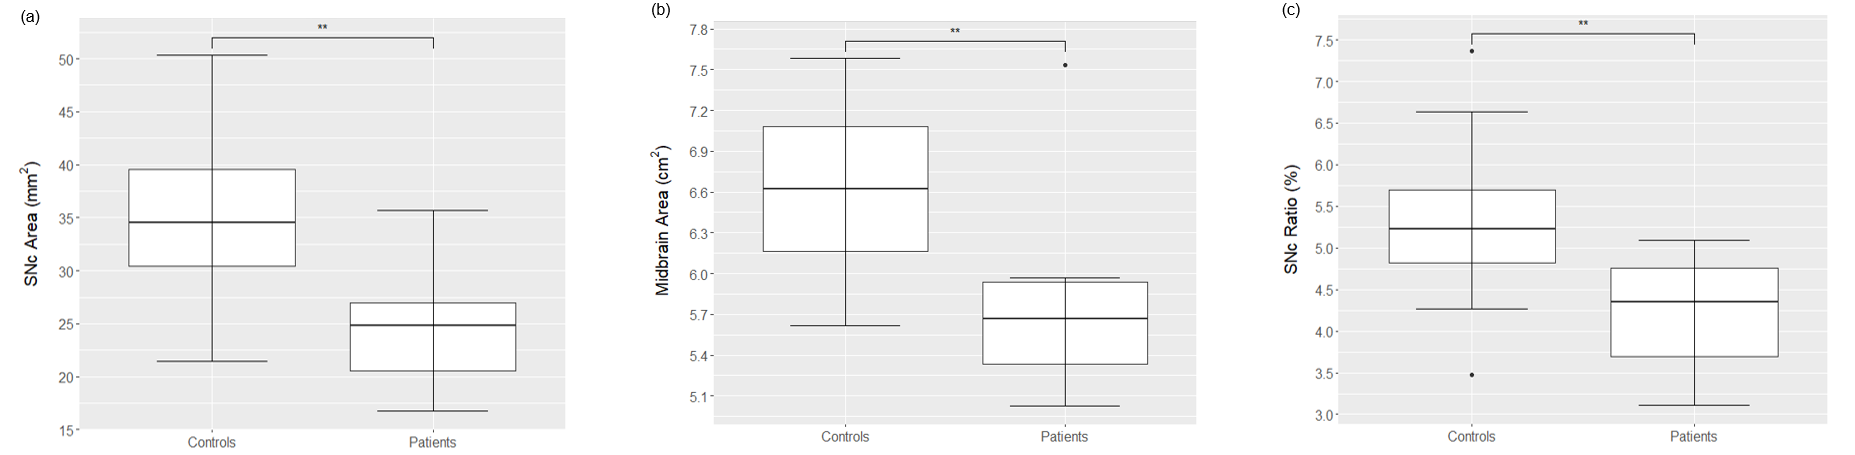
No significant differences were detected between left and right-sided SNc areas of controls (p=0.08) nor of HD patients (p=0.20). Significant reductions were detected in the average SNc areas (p<0.005), midbrain areas (p<0.01) and in the SNc ratios (p<0.01) of HD patients comparing to controls, as displayed in Figure 3. No significant asymmetry in the CR values of the SNc was found in controls (p=0.20) nor in subjects with HD (p=0.74). A median CR of 14% (ranging 11%-17%) was obtained for healthy subjects, while for HD patients a CR of 13% (8%-16%) was found. These differences were not statistically significant (p=0.57).
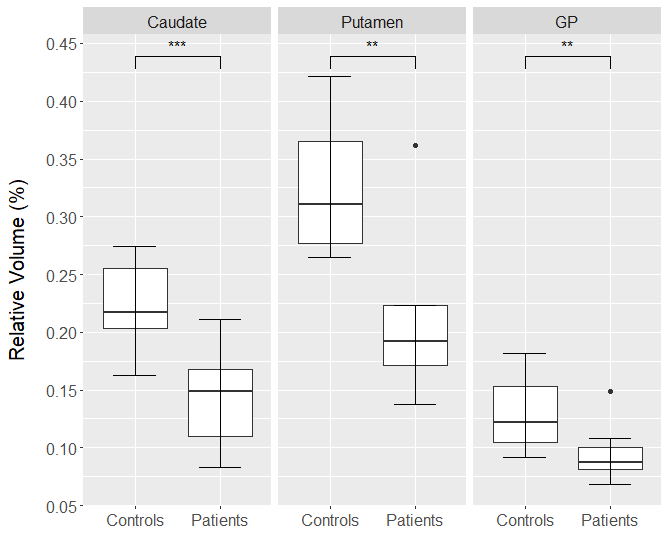
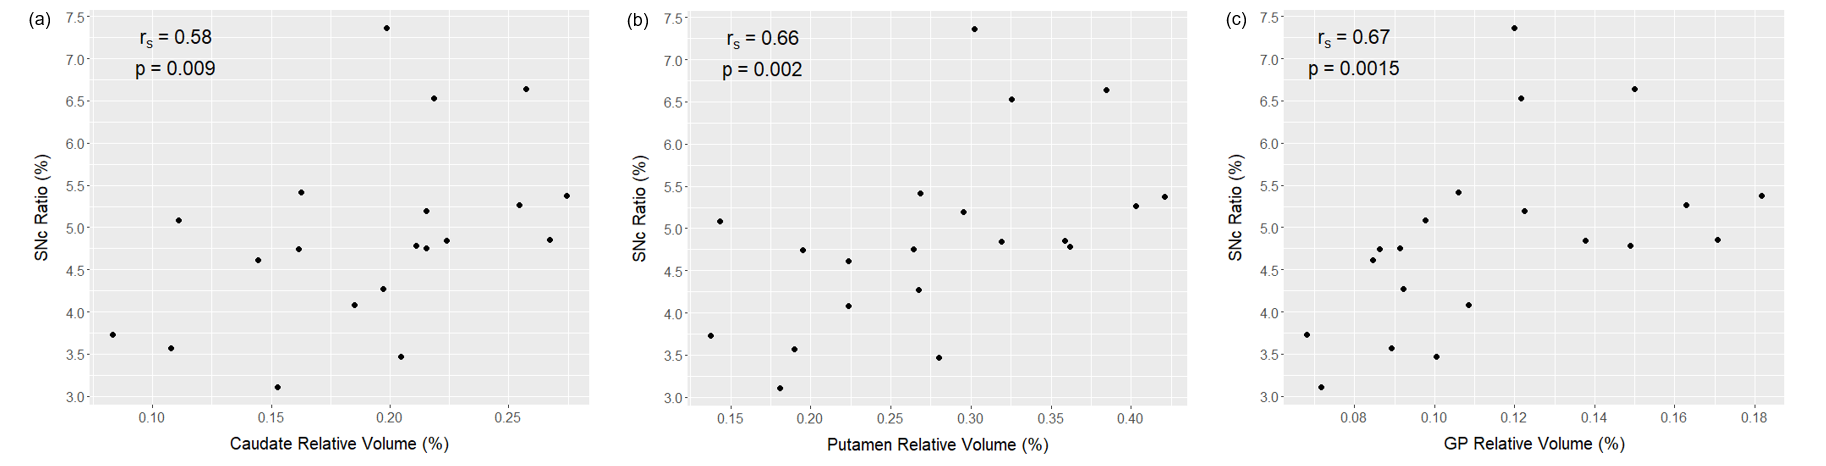
Significant reductions in the relative volumes of the caudate (mean percent change of -35%; p<0.001), putamen (-36%; p<0.05) and GP (-28%; p<0.01) were detected in the HD cohort, as displayed in Figure 4. Considering all subjects, the SNc ratios correlated significantly with the relative volumes of the caudate (r=0.58, p=0.009), putamen (r=0.66, p=0.002) GP (r=0.67, p=0.002), as shown in Figure 5.
Discussion
Basal ganglia volumes were reduced in HD patients, in agreement with previous studies8,9. The relative NM signal in the SNc, given by the CR, tended to be smaller in HD patients, but this difference did not reach statistical significance. A reduction of SNc areas in HD patients is compatible with a depletion of NM-containing neurons despite the reduction of midbrain area. The correlations between SNc ratios and basal ganglia volumes suggest that the loss of dopaminergic neurons and basal ganglia atrophy, which is an established feature of the disease, may not be independent processes.Conclusion
NM-MRI techniques were for the first time employed to study HD, suggesting dopaminergic neuronal loss in the SNc of patients that correlates with basal ganglia atrophy.
Acknowledgements
We acknowledge the Portuguese Foundation for Science and Technology for financial support through grants FCT - IF/00364/2013, UID/EEA/50009/2013.References
1. The Huntington’s Disease Collaborative Research Group. A novel gene containing a trinucleotide repeat that is expanded and unstable on Huntington’s disease chromosomes. Cell. 1993;72(6):971–983.
2. Rebec, G. V. Corticostriatal network dysfunction in huntington’s disease: Deficits in neural processing, glutamate transport, and ascorbate release. CNS Neurosci. Ther. 2018;24(4):281–291.
3. Niccolini, F. and Politis, M. Neuroimaging in Huntington’s disease. World J. Radiol. 2014;6(6):301-312.
4. Bates, G. P., Dorsey, R., Gusella, J. F. et al. Huntington disease. Nat. Rev. Dis. Primers 2015;1:15005.
5. Bunner, K. D. and Rebec, G. V. Corticostriatal Dysfunction in Huntington’s Disease: The Basics. Front. Hum. Neurosci. 2016;10:317.
6. Fischl, B. FreeSurfer. Neuroimage. 2012;62(2):774-781.
7. Rosset, A., Spadola, L. and Ratib, O. OsiriX: An open-source software for navigating in multidimensional DICOM images. J. Digit. Imaging. 2004;17(3):205-216.
8. Sánchez-Castañeda, C., Cherubini, A., Elifani, F. et al. Seeking huntington disease biomarkers by multimodal, cross-sectional basal ganglia imaging. Hum. Brain Mapp. 2013;34(7):1625-1635.
9. Rosas, H. D., Koroshetz, W. J., Chen, Y. I., et al. Evidence for more widespread cerebral pathology in early HD: an MRI-based morphometric analysis. Neurology. 2003;60(10):1615-1620.
Figures