3328
Diagnostic performance of a new multicontrast one minute full brain exam (EPIMix) in neuroradiology1Clinical Neuroscience, Karolinska, Stockholm, Sweden, 2Karolinska, Stockholm, Sweden, 3GE Healthcare, Stockholm, Sweden
Synopsis
This study assess if a new one minute multi contrast MRI method has comparable diagnostic performance as conventional MRI in brain imaging. Prospectively consecutively included patients (n=101) underwent a conventional clinical brain MRI in addition to a new 80 seconds multi contrast MRI sequence named EPIMix. The diagnostic performance to categorize a clinical brain MRI scan with EPIMix or conventional MRI as abnormal (symptom-causing lesion) was comparable between EPIMix (AUC 0.97 (95%CI 0.94-1.00) and 0.98 (95% CI 0.96-1.00)) and conventional MRI (AUC 1.00 (95% CI 1.00-1.00)), (n=96-101).
INTRODUCTION:
Various multi-contrast MRI techniques have been proposed recently for brain MRI1–3, aiming for reduced exam time by acquiring some or all of the image contrasts necessary for the particular patient. Recently, we proposed an improved version4 of our EPI-based multi-contrast sequence, "EPIMix", which can produce T1-FLAIR, T2-FLAIR, T2*w, T2w, DWI and ADC images in about 70-80 s with full brain coverage (34-36 slices). In this study, we have added EPIMix to our clinical brain MRI protocols to be able to compare the diagnostic performance by reading only the EPIMix data vs reading only the conventional MRI data in the same exam.
METHODS:
101 consecutive patients eligible for brain MRI were included after informed consent (January 2018-May 2018). The patients were enrolled without sub-grouping into different disease types. All included patients were first imaged with the relevant clinical protocol given their disease type, followed by an EPIMix scan. To assess the diagnostic confidence in determining an exam as normal or abnormal, two neuroradiologists were reading each exam twice. First, only using the six MR contrast from the EPIMix data, and then 2-3 weeks later, the conventional MR images were read. For each read, a form was filled in with presence of symptom-causing lesions, disease type (neoplastic, postoperative, ischemic, hemorrhagic, neuroinflammatory, vascular, or other), artifact levels etc. No patient history or clinical information were available to the neuroradiologists. The conventional MRI was used as gold standard. The diagnostic performance to categorize a clinical brain MRI scan with EPIMix or conventional MRI as abnormal (symptom-causing lesion) or normal was assessed via receiver operating characteristics (ROC) and the area under curve (AUC). The differences between ROC curves were estimated with DeLong’s test and comparison of confidence intervals (CI). All exams were performed on a 3T Discovery 750w and a Optima 450 1.5T MR system (GE Healthcare, WI, USA).RESULTS:
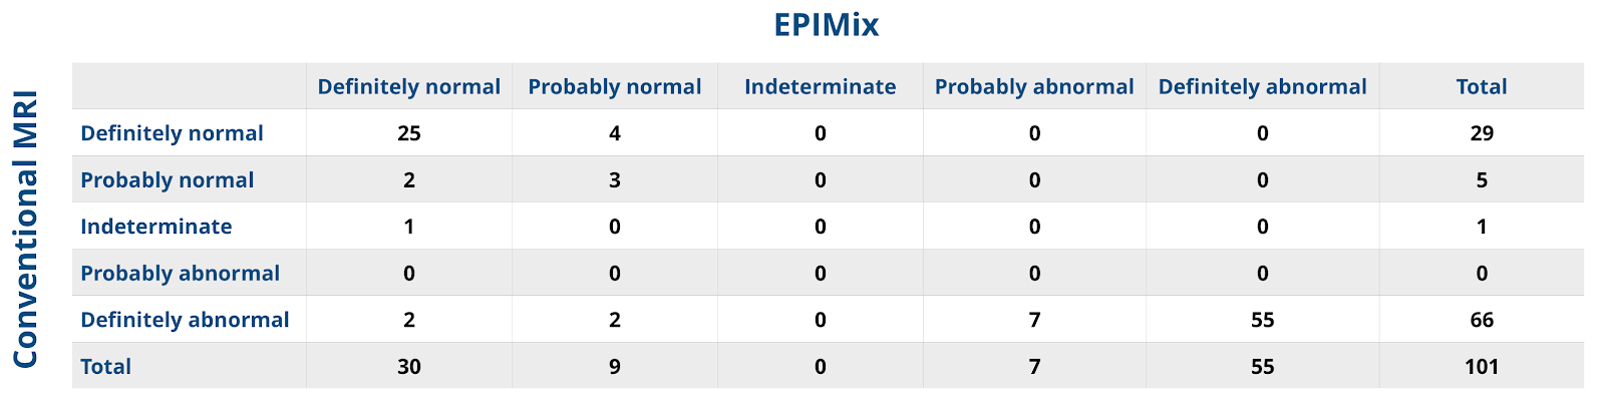
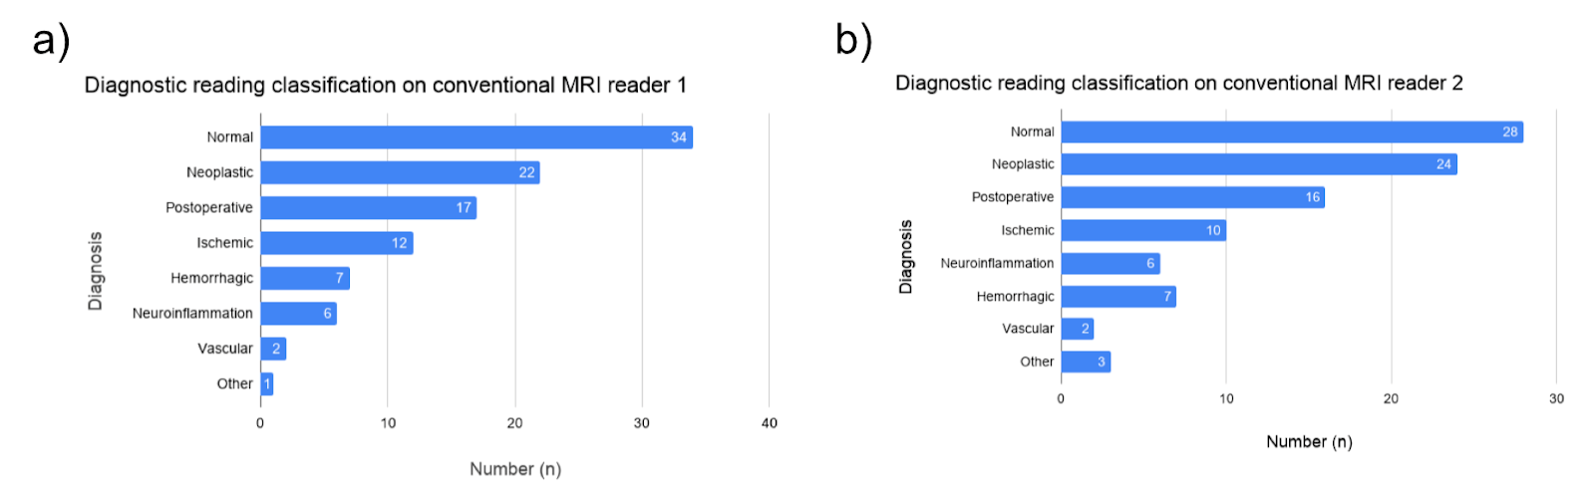
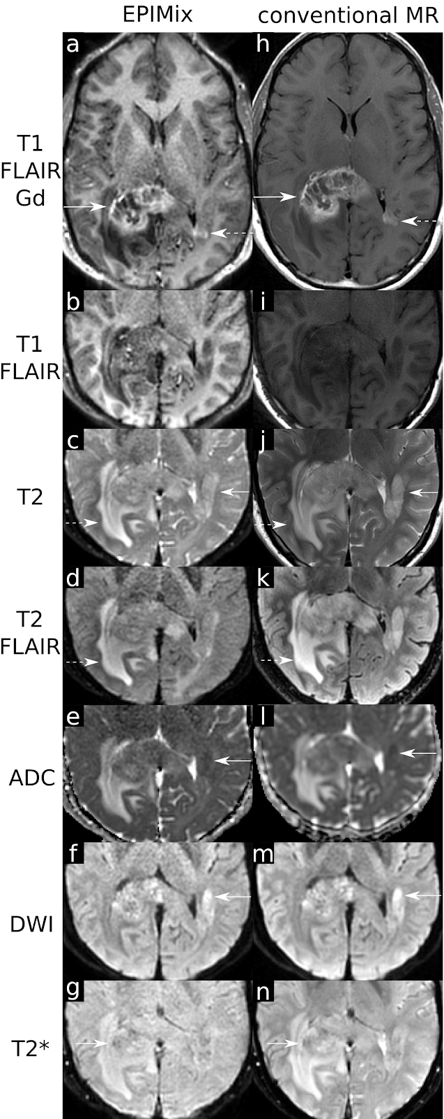
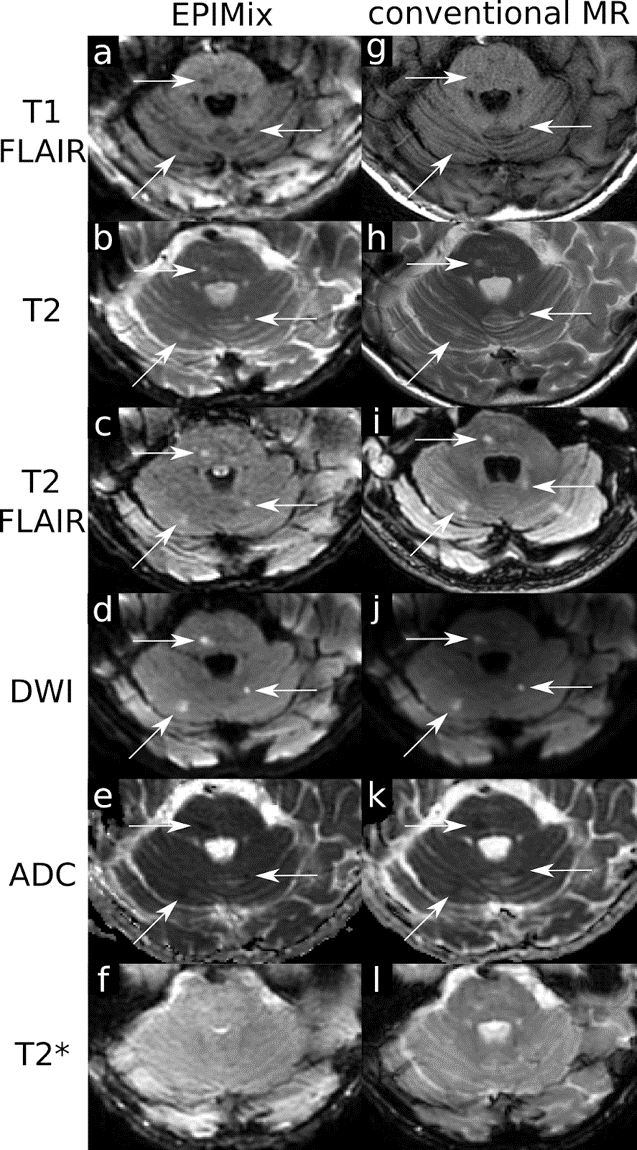
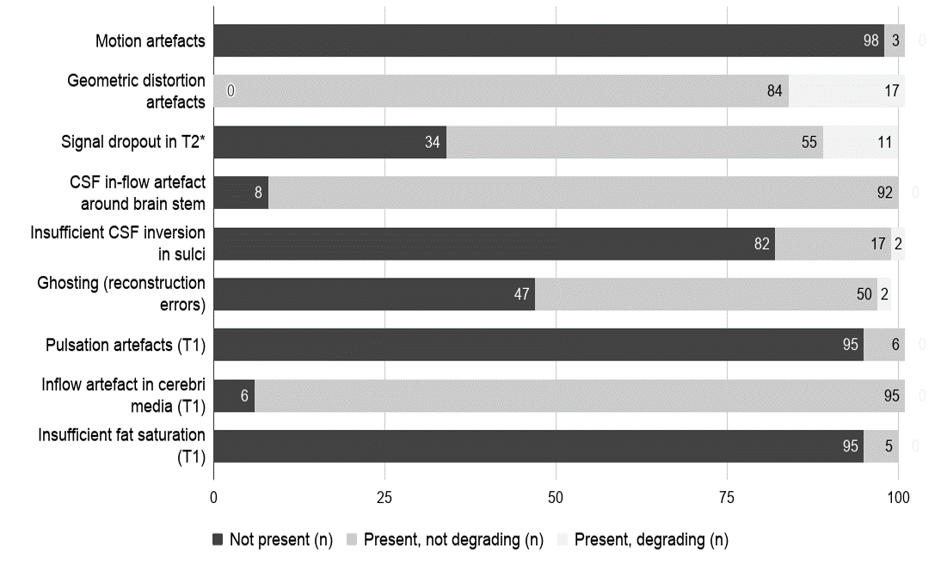
The diagnostic performance to categorize a full brain MRI investigation as abnormal or normal was comparable between EPIMix (AUC 0.97 (95%CI 0.94-1.00) and 0.98 (95% CI 0.96-1.00)) and conventional MRI , (n=96-101). The sensitivity was 93% (95% CI 85-99, reader 1) and 90% (95% CI 82-96, reader 2), and specificity 100% (95% CI 76-100, reader 1) and 100% (95% CI 82-100, reader 2). Fig. 1 summarizes the diagnostic performance of EPIMix in a pivot table. Disease categorization into pre-specified subgroups were congruent between EPIMix and conventional MRI in 91% (92 of 101) of the cases for reader 1 and in 88% (84 of 96) of the cases for reader 2. The disease categories based on the reference standard conventional MRI for both readers are detailed in Fig. 2. Among the false negative or false disease categorization cases, the pituitary region pathology was the most common. In Fig. 3-4, two patients are presented. Fig. 3 illustrates high correspondence between EPIMix and conventional MRI for all contrasts in visualizing common features of a glioblastoma. Fig. 4 illustrates EPIMix's ability to detect small lesions. In Fig. 5, the prevalences of artifacts reported while reading the EPIMix data are summarized in three categories: not present, present but not degrading diagnostic confidence, or present and degrading diagnostic confidence.
DISCUSSION:
In general, there was a good diagnostic capability of the new technique to classify a scan as normal or abnormal. Moreover, in most cases the same diagnosis could be made with EPIMix vs conventional MRI data. Patients with pituitary region pathology could not be classified with sufficient clinical confidence, which is expected as this is located at the tissue-air interface of the brain subject to large field inhomogeneities resulting in strong geometric distortions in the EPIMix data.CONCLUSION:
EPIMix has comparable diagnostic performance as conventional MRI in categorizing a clinical brain MRI as abnormal or normal.
Acknowledgements
Fredrik Granath
Yords Österman
Mitra Pedersen
Lars Blomberg
Maria Sandell
Yvonne Millstam
Amir Hossein Montazeri Najafabadi
Birgitta Löwegren
Yennie Gysell
Figures