3327
Quantitative pharmacokinetic comparison of adenoma and normal pituitary gland using high-temporal and spatial resolution dynamic contrast enhanced MRI1Radiology, Kagoshima University, Kagoshima, Japan, 2Neurosurgery, Kagoshima University, Kagoshima, Japan, 3Radiological Technology, Kagoshima University Hospital, Kagoshima, Japan, 4Siemens Healthcare K.K, Tokyo, Japan
Synopsis
Preoperative localization of the normal pituitary gland is important in patients with pituitary adenoma. Our aim was to evaluate the possible role of high-temporal and spatial resolution dynamic contrast enhanced MR imaging (DCE-MRI) and quantitative pharmacokinetic analysis in differentiation of the normal pituitary gland from pituitary adenoma. The normal pituitary gland showed significantly higher IAUC, Ktrans, kep and ve than pituitary adenoma. The ROC curve analysis showed significance for IAUC, Ktrans, kep and ve (AUC = 0.958, 0.882, 0.781 and 0.851, respectively). These quantitative parameters may be useful for differentiation of the normal pituitary gland from pituitary adenoma.
INTRODUCTION
Preoperative localization of the normal pituitary gland is important in patients with pituitary adenoma. The pituitary gland enhances more avidly than a pituitary adenoma as well described in previous literatures.1 Our aim was to evaluate the possible role of high-temporal and spatial resolution dynamic contrast enhanced MR imaging (DCE-MRI) and quantitative pharmacokinetic analysis in differentiation of the normal pituitary gland from pituitary adenoma.METHODS
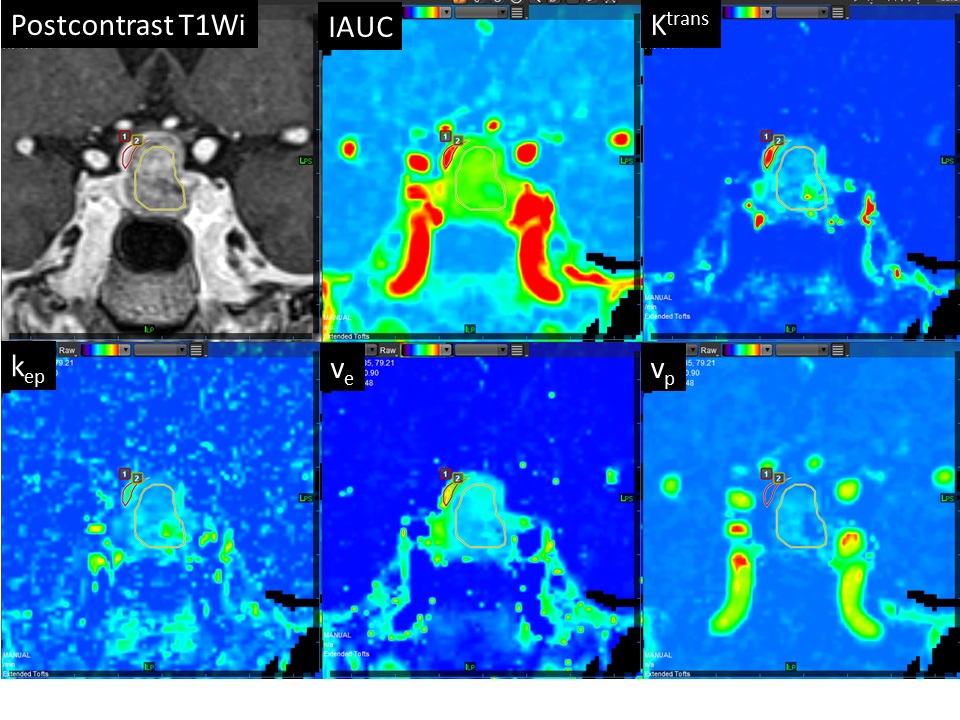
A retrospective study was performed using 13 patients with pituitary adenoma (mean age, 56.2 ± 10.8 years). All patients underwent MR imaging with a 3T system (MAGNETOM Prisma; Siemens Healthcare, Erlangen, Germany). A 20-channel head/neck coil was used. Imaging protocol included a coronal prototype sequence of VIBE with compressed sensing (CS) technique (TR/TE, 3.9/0.97 ms; in-plane resolution, 1.10 × 0.94 mm (reconstructed in 0.9 × 0.9 mm); slice thickness, 0.9 mm; 48 slices; FOV, 180 mm; flip angle, 10.0°; bandwidth, 640 Hz/pixel; image matrix, 145 × 192; CS factor, 7; temporal resolution, 5.00 seconds; acquisition time, 200 seconds). Reconstructed images were sent to the PACS and analyzed by using the software Vitrea (Canon Medical Systems Co.,Tochigi, Japan) to obtain signal-time curves and generate pharmacokinetic measurements, including initial area under the curve (IAUC), volume transfer constant between blood plasma and extracellular extravascular space (EES) (Ktrans), rate constant between EES and blood plasma (kep), volume of EES per unit volume of tissue (ve) and volume of plasma per unit volume of tissue (vp) (Fig 1).2 A region of interest measurements were performed in pituitary adenoma and the normal pituitary gland for each case. Each pharmacokinetic parameter was compared between pituitary adenomas and normal pituitary glands using Mann-Whitney U test. In addition, the diagnostic performances of the parameters were compared using receiver operating characteristic (ROC) curve analysis.RESULTS
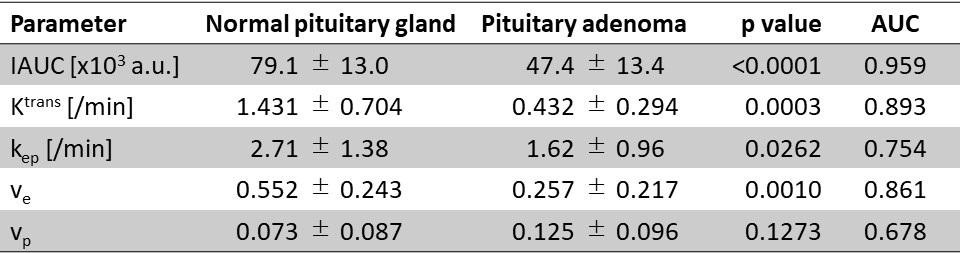
The normal pituitary gland showed significantly higher IAUC [×103 a.u.] (79.1 ± 13.0 vs. 47.4 ± 13.4, p < 0.0001), Ktrans [/min] (1.431 ± 0.704 vs. 0.432 ± 0.294, p = 0.0003), kep [/min] (2.71 ± 1.38 vs.1.62 ± 0.96, p = 0.0262) and ve (0.552 ± 0.243 vs. 0.257 ± 0.217, p = 0.0010) than pituitary adenoma, whereas no significant difference was found in vp (0.073 ± 0.087 vs. 0.125 ± 0.096, p = 0.1273) (Fig 2). The ROC curve analysis showed significance for IAUC, Ktrans, kep and ve (AUC = 0.959, 0.893, 0.754 and 0.861, respectively). The diagnostic performance of IAUC was significantly higher than that of kep, and there was no significant difference in diagnostic performance among other parameters.DISCUSSION
The current study exploited the potential of VIBE with CS technique in evaluating the pituitary gland with a high spatial (0.9 mm isotropic) and temporal (5.00 seconds) resolution, allowing for quantitative pharmacokinetic analysis of pituitary adenoma and the normal pituitary gland. According to our literature search, this is the first pituitary imaging study that has looked into the quantitative pharmacokinetic measures including Ktrans, kep,ve and vp. The results revealed that the IAUC, Ktrans, kep, and ve in the normal pituitary glands were distinctly different from those in pituitary adenomas. These quantitative results are consistent with the qualitative finding that the pituitary gland enhances more avidly than a pituitary adenoma. This technique may be useful to detect the normal pituitary gland in patients with preoperative pituitary macroadenoma. Furthermore, it may help find a small adenoma.CONCLUSION
VIBE with CS technique allowed for quantitative pharmacokinetic analysis of the pituitary gland. The normal pituitary gland was characterized by higher IAUC, Ktrans, kep, and ve. These quantitative parameters may be useful for differentiation of the normal pituitary gland from pituitary adenoma.Acknowledgements
No acknowledgement found.References
1. Lee HB, Kim ST, Kim HJ, et al. Usefulness of the dynamic gadolinium-enhanced magnetic resonance imaging with simultaneous acquisition of coronal and sagittal planes for detection of pituitary microadenomas. Eur Radiol. 2012 Mar;22(3):514–518.
2. Tofts PS, Brix G, Buckley DL, et al. Estimating kinetic parameters from dynamic contrast-enhanced T(1)-weighted MRI of a diffusable tracer: standardized quantities and symbols. Journal of Magnetic Resonance Imaging. 1999;10(3):223–232.
Figures