3323
Differentiation between Hemorrhage and Calcifications by Assessing the Dipole Patterns on Unwrapped Phase Images of Gradient-recalled Echo Sequence1Radiology, Gachon University College of Medicine, Incheon, Korea, Republic of, 2Department of Electrical and Computer Engineering, Seoul National University, Seoul, Korea, Republic of
Synopsis
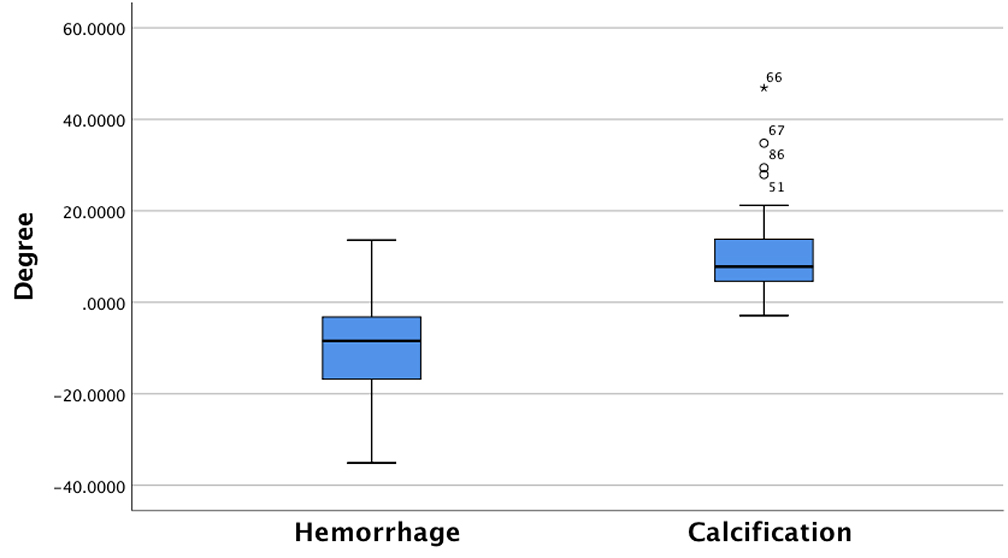
Both cerebral hemorrhages and calcifications may show similar internal heterogeneity on phase images, limiting its clinical utility. We assessed a dipole artifact (both the upper/lower poles and the equatorial region) on phase images in 123 patients with hemorrhages (n=119) and calcifications (n=75). All hemorrhagic lesions were perfectly determined, while all but one calcification showed a diamagnetic dipole pattern. The equatorial phase values (degree) were significantly different between hemorrhages and calcifications (-10.41±10.66 versus 10.86±9.53; P<0.0001). The signal intensities of both the lobes and the equatorial rim on GRE phase images accurately differentiate hemorrhages from calcifications irrespective of internal heterogeneity.
Introduction
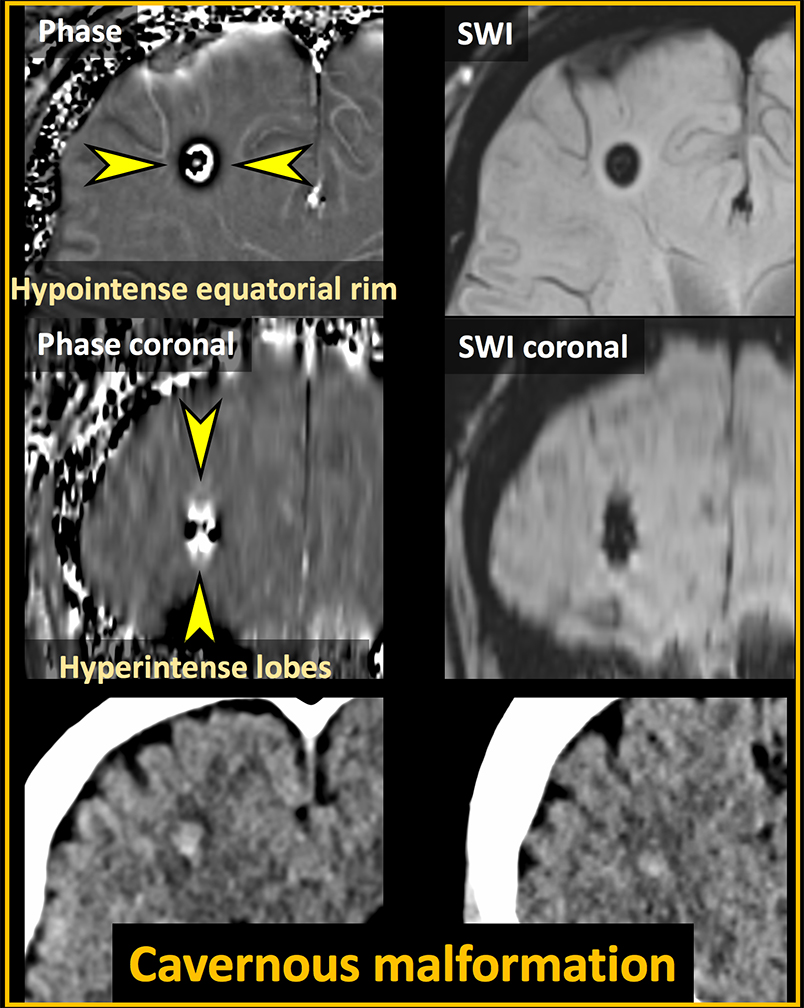
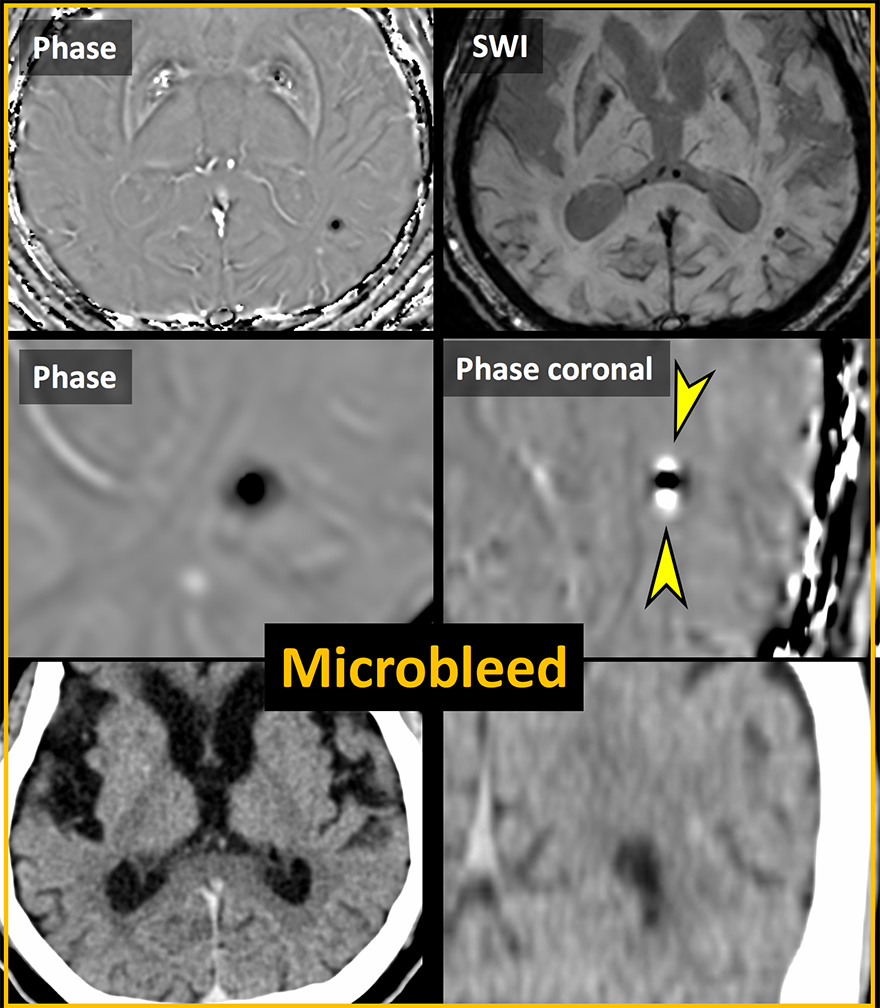
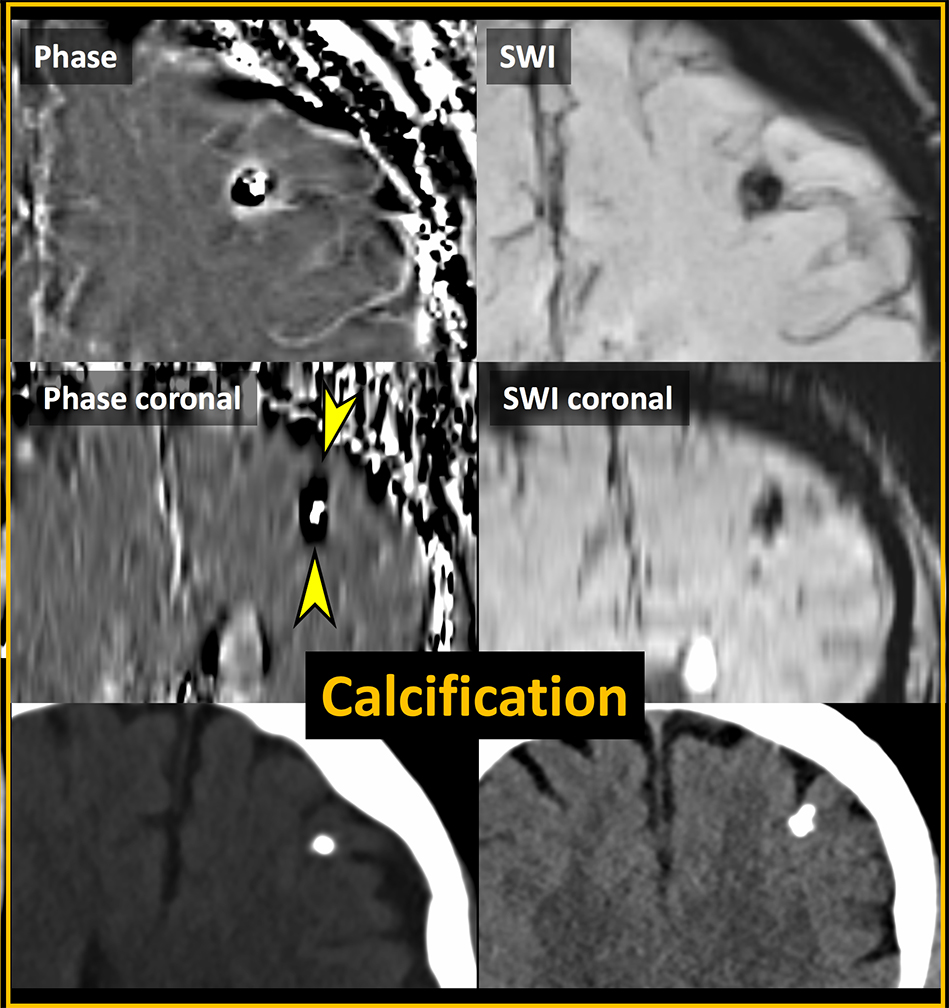
Gradient-recalled echo (GRE) phase images are known to be useful for differentiating calcifications from hemorrhages. In large lesions, however, internal heterogeneous signal intensity on GRE phase images makes it difficult to differentiate the two conditions, which is particularly the case in relatively large hemorrhages or calcifications. It has recently been reported that such a limitation can be overcome by using quantitative susceptibility mapping (QSM).1 Reconstructing QSM, however, needs extra work, making it difficult to apply it to daily routine practice. Thus, it would be desirable to have sufficient information by simple visual assessment of GRE phase images for this purpose. It has been shown that both upper and lower lobes of the lesion on GRE phase images show signal intensity similar to that of the lesion itself while the equatorial rim of the lesion exhibits opposite signal intensity.2,3 Such an observation has not been reproduced in a large number of patients with hemorrhages or calcifications. The purpose of our study was to test if evaluating both the upper and lower lobes and the equatorial rim of the lesions in the brain on GRE phase images may help differentiate calcifications from hemorrhages.Methods
We enrolled 123 patients with hemorrhages (n = 119) and calcifications (n = 75) (93 lesions < 5 mm) who underwent both GRE imaging at 3T (a 64-channel head coil, Skyra, Siemens) and unenhanced head CT. The unenhanced head CT was used to determine if the lesions on GRE imaging were calcifications or hemorrhages. Conventional single-echo (20 ms) GRE imaging was obtained, followed by unwrapping the phase images. The lesions in the globus pallidus were not included because physiologic calcifications may confound the results. Two independent reviewers visually assessed all lesions on GRE phase images at the window width/level = 500 ~ 1000/100 to determine the signal intensity patterns (hemorrhage or calcification) of both the upper and lower lobes and the equatorial rim on coronal reformatted images and axial images, respectively. They also recorded if the internal signal intensity was heterogeneous or homogeneous. Any discrepancies were resolved by consensus. For the lesions with internal heterogeneous signal intensity, the phase values were measured by drawing regions of interest on axial images, and these were compared between hemorrhages and calcifications.Results
There was only one lesion with discrepancy between the two reviewers, showing excellent interobserver agreement. All hemorrhages showed a paramagnetic dipole pattern (hyperintensity at the two lobes and hypointensity at the equatorial rim) (Figures 1 and 2). A diamagnetic dipole pattern was observed in all but one calcification (Figure 3). Internal heterogeneous signal intensity was noted in 95 of 194 lesions (49.0%; 45 calcifications) (Figure 2), in which the phase values (degree) were significantly different between hemorrhages and calcifications (Figure 4) (-10.41 ± 10.66 versus 10.86 ± 9.53; P < 0.0001).Conclusion
The signal intensities of both the lobes and the equatorial rim on GRE phase images accurately differentiate hemorrhages from calcifications irrespective of internal heterogeneity. Assessment of both the lobes and the equatorial rim on GRE phase images may obviate the need for quantitative susceptibility mapping to differentiate calcifications from hemorrhages.Acknowledgements
None.References
1. Chen W, Zhu W, Kovanlikaya I, et al. Intracranial calcifications and hemorrhages: characterization with quantitative susceptibility mapping. Radiology 2014;270:496-505
2. Yamada N, Imakita S, Sakuma T, et al. Intracranial calcification on gradient-echo phase image: depiction of diamagnetic susceptibility. Radiology 1996;198:171-178
3. Deistung A, Rauscher A, Sedlacik J, et al. Informatics in Radiology: GUIBOLD: a graphical user interface for image reconstruction and data analysis in susceptibility-weighted MR imaging. Radiographics 2008;28:639-651
Figures