3320
Quantitative Magnetization Transfer of the Human Locus Coeruleus1Neurology, Vanderbilt University Medical Center, Nashville, TN, United States, 2Vanderbilt University Institute of Imaging Science, Vanderbilt University, Nashville, TN, United States, 3Biomedical Engineering, Vanderbilt University, Nashville, TN, United States, 4Radiology and Radiological Sciences, Vanderbilt University, Nashville, TN, United States
Synopsis
The locus coeruleus (LC) is the major source of norepinephrine in the brain and it is affected in several neurodegenerative disorders. We used quantitative magnetization transfer (MT) imaging to create parametric maps of the macromolecular content of the LC and neighboring tissues. We found that the macromolecular content was lower in the LC compared to the surrounding pontine tegmentum, suggesting that LC contrast is related to MT effects.
Introduction
The locus coeruleus (LC), a small nucleus located in the dorsal aspect of the pons, is the major origin of norepinephrine in the brain. Degeneration of the LC occurs in several neurodegenerative disorders like Parkinson’s disease (PD) and Alzheimer’s disease (AD). Characterizing and quantifying early pathological changes of the LC and following progression by assessing LC integrity, may provide important advances to understanding diagnosis and clinical course of patients. Previous studies have shown that neuromelanin-sensitive MRI (NM-MRI) 1 can be used to visualize the LC 2, and several authors have suggested that the source of the LC contrast is associated with magnetization transfer (MT) effects 3. The aim of this study was to characterize MT effects in LC imaging by applying high-resolution quantitative MT (QMT) imaging to create parametric maps of the macromolecular content of the LC and surrounding tissues.Methods
Twelve healthy volunteers (9 females; 20-59 years old, mean age: 29±13 years) underwent brain MRI on a 3T scanner with a 32-channel head coil. QMT data were acquired using a 3D MT-prepared SPGR sequence (TR/TE/α = 42 ms/2.9 ms/16°, acquired/reconstructed resolution = 0.6×0.6 / 0.23×0.23 mm2, slice thickness = 1 mm, 4 signal averages). MT weighting was achieved using a 20-ms, single-lobed sinc-gauss pulse with Δω = 2 kHz and αMT = 850°. A reference image without MT weighting was also acquired. B0, B1 and T1maps were acquired using 3D SPGR techniques. Finally, we acquired a traditional NM scan consisting of a T1-weighted TSE sequence with MT preparation using a 20-ms single-lobed sinc-gauss pulse with Δω = 2 kHz and αMT of 600° (TR/TE = 670/12 ms, acquired/reconstructed resolution = 0.6×0.6 / 0.23×0.23 mm2, slice thickness = 2 mm, 8 signal averages). For each acquisition, the field-of-view was placed perpendicular to the floor of the fourth ventricle between the superior colliculi and the superior cerebellar peduncles.
All images were co-registered to the MT-weighted (MTw) image using FSL FLIRT. The signal intensities of the MTw images were normalized to the intensity of the reference image, and the nominal offset frequency and RF amplitudes were corrected using B0 and B1 maps. The pool-size ratio (PSR) was estimated for each voxel using a single-point approach 4–6 (with constraints as follows: kmf=10 Hz, R1fT2f=0.018, and T2m=10 µs).
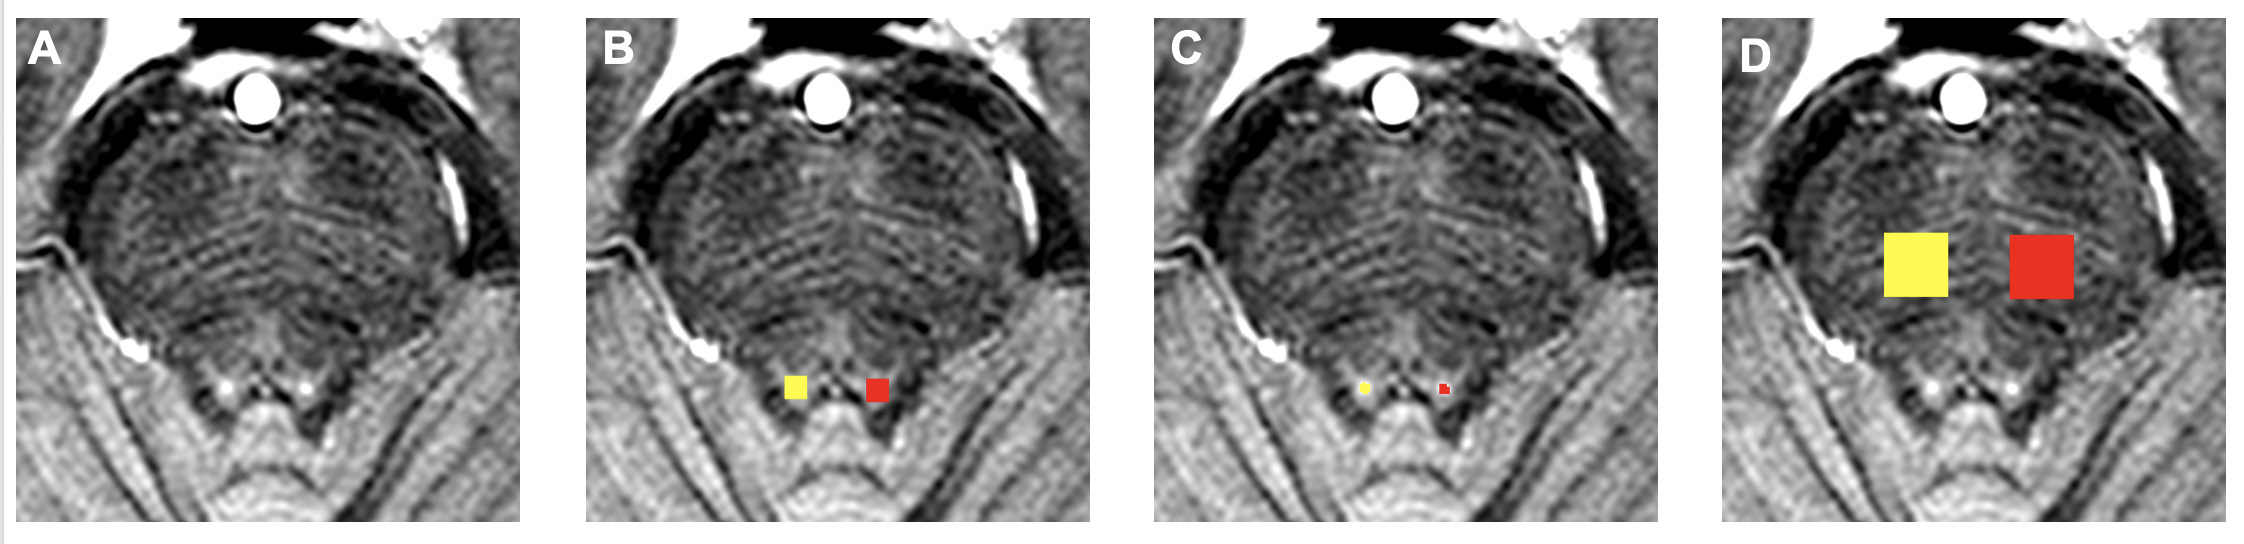
Regions-of-interest (ROIs) for the LC and the pontine tegmentum (PT) were segmented manually on each subject MTw image (Fig. 1), and were used to sample the PSR maps. The contrast ratio between the LC and the PT (CR=[SLC-SPT]/SPT, where SLC and SPT correspond to the mean signal intensity of the LC and PT) was calculated for the MTw (CRMT), reference (CRRef), and NM images (CRNM).
Results
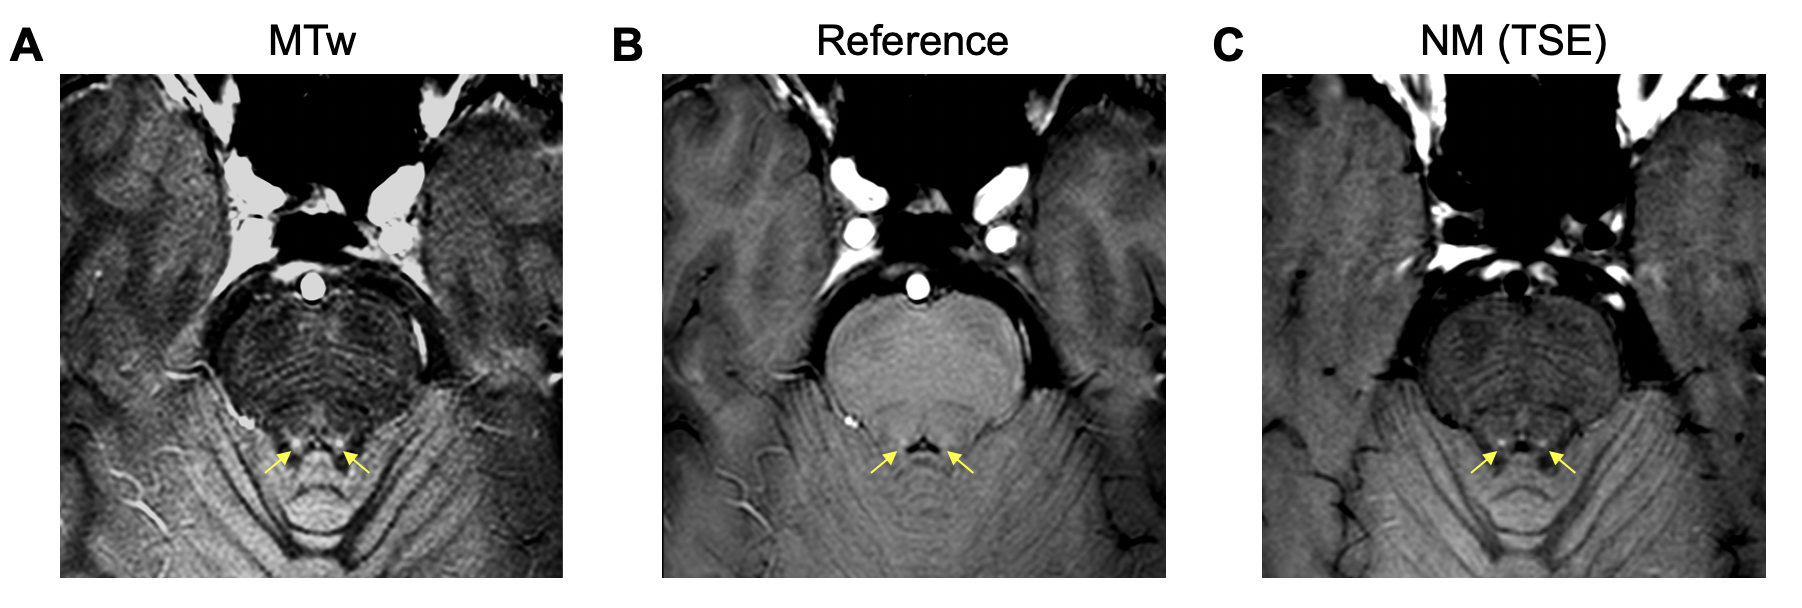
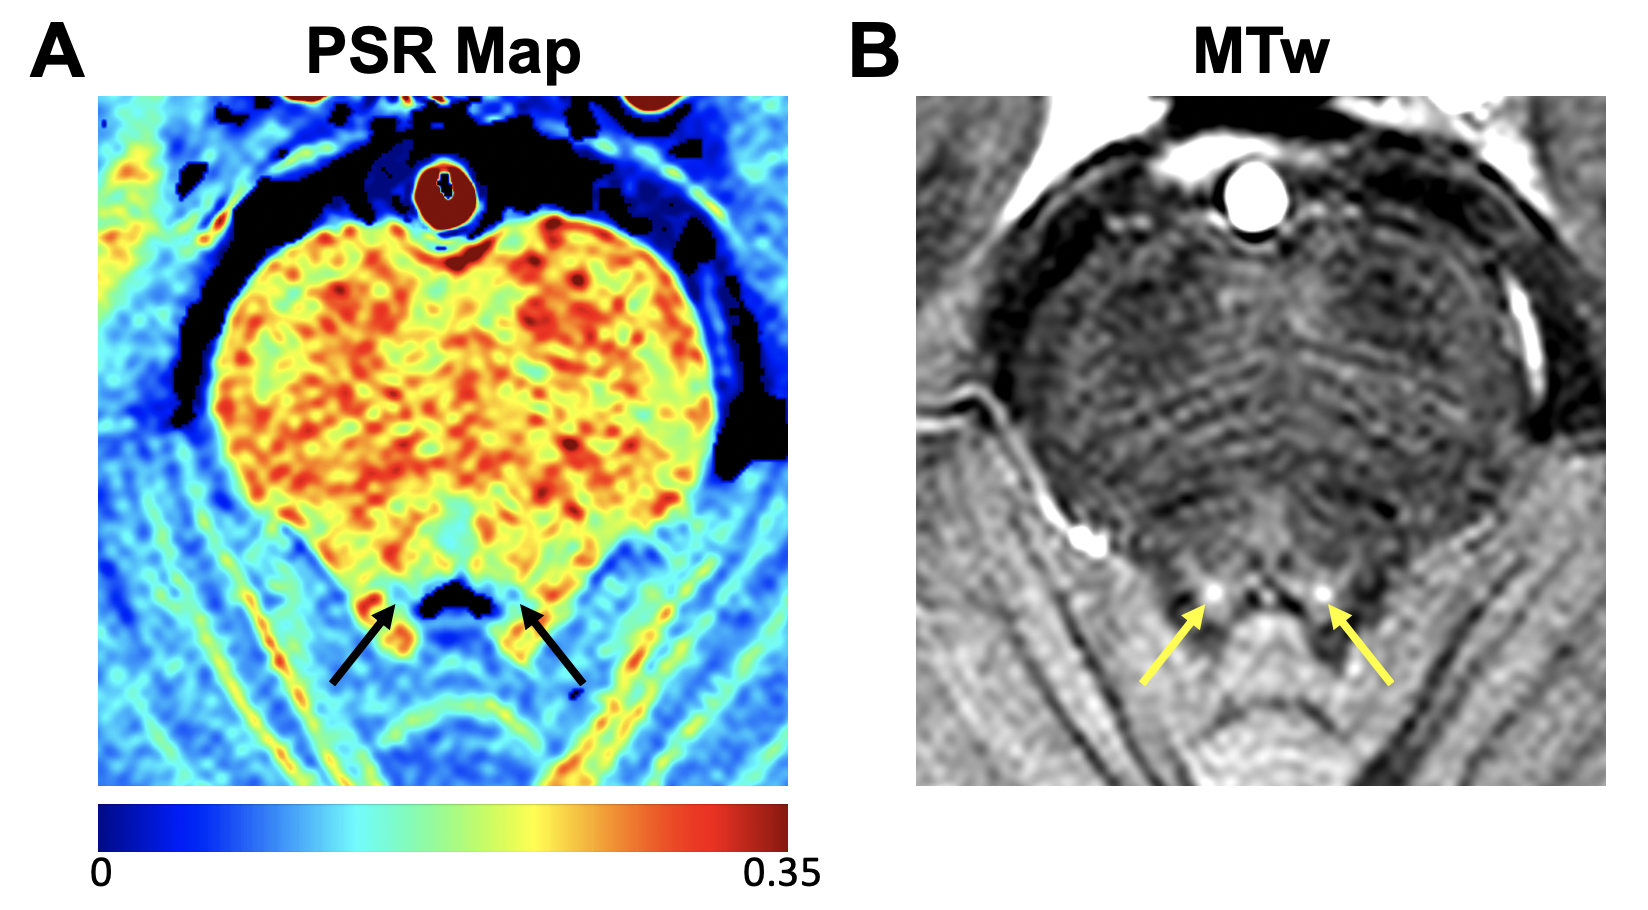
Areas of hyperintensity were detected in the position of the LC in the MTw and NM images (Fig. 2). The MTw images provided higher CR than the reference and NM images (CRMT=0.222±0.026, CRRef=0.005±0.023, CRNM=0.151±0.040). The PSR maps showed low values for the LC (0.108±0.008) and higher values for the surrounding tissues in the PT (0.206 ±0.031) (Fig. 3). The PSR values for the LC and PT varied across slices. The largest difference between the PSR values in the LC and PT was observed in the central slices, which also correspond to those with the highest CR. Finally, the difference in PSR between the PT and LC was significantly positively correlated with the CRMT (Spearman’s rho=0.60, p<0.0001).Discussion
Previous studies had suggested that the source of image contrast in the LC was predominantly related to MT effects, and here we provide a quantitative description of such effects. We found that high-resolution 3D MT-prepared images offer the highest CR compared to the images without MT preparation and traditional NM images. Using the MT-prepared images, we applied QMT fitting to estimate the PSR, a measurement of the macromolecular content in tissue, and found that PSR was lower in the LC compared to surrounding PT. Furthermore, we found that the difference in PSR between the PT and LC was significantly correlated with the CR.Conclusion
Our results suggest that the LC contrast is related to the difference in macromolecular content between tissues which is detected in MT-weighted imaging. QMT is a promising approach to quantitatively assess pathological changes to the LC in-vivo, with potential application as biomarker of neurodegeneration.Acknowledgements
We thank Mrs. Kristen George-Durrett, Mrs. Leslie McIntosh, Mrs. Clair Jones, and Mr. Christopher Thompson for their invaluable assistance with the data acquisition. This work was supported by grants DOD W81XWH-13-0073, NIH/NIBIB R21 NS087465, NIH/NIBIB R01 EY023240 and The National MS Society (to SAS), and by grants NIH/NINDS K23 NS080988, and NIH/NINDS 1R01NS097783-01 (to DOC).References
1. Sasaki M, Shibata E, Tohyama K, et al. Neuromelanin magnetic resonance imaging of locus ceruleus and substantia nigra in Parkinson’s disease. Neuroreport. 2006;17:1215–1218.
2. Liu KY, Marijatta F, Hämmerer D, Acosta-Cabronero J, Düzel E, Howard RJ. Magnetic resonance imaging of the human locus coeruleus: A systematic review. Neurosci Biobehav Rev. 2017;83:325–355.
3. Priovoulos N, Jacobs HIL, Ivanov D, Uludağ K, Verhey FRJ, Poser BA. High-resolution in vivo imaging of human locus coeruleus by magnetization transfer MRI at 3T and 7T. Neuroimage. 2018;168:427–436.
4. Smith AK, Dortch RD, Dethrage LM, Smith SA. Rapid, high-resolution quantitative magnetization transfer MRI of the human spinal cord. Neuroimage. 2014;95:106–116.
5. Trujillo P, Summers PE, Smith AK, et al. Pool size ratio of the substantia nigra in Parkinson’s disease derived from two different quantitative magnetization transfer approaches. Neuroradiology. 2017;59:1251–1263.
6. Yarnykh VL. Fast macromolecular proton fraction mapping from a single off-resonance magnetization transfer measurement. Magn Reson Med. 2012;68:166–178.
Figures