3318
Tractography of complex white matter bundles: limitations of diffusion MRI data upsampling1Cardiff University Brain Research Imaging Centre (CUBRIC), Division of Clinical Neurosciences and Psychological Medicine, School of Medicine, Cardiff University, Cardiff, United Kingdom, 2Cardiff University Brain Research Imaging Centre (CUBRIC), School of Psychology, Cardiff University, Cardiff, United Kingdom
Synopsis
Diffusion MRI images for fiber tractography are often acquired at low spatial resolution which may lead to underestimation of smaller tracts with complex morphology. Although upsampling may improve results, this has had mixed observations in the literature. We compared three datasets (2×2×2 mm3, 1.5×1.5×1.5 mm3, and 2×2×2 mm3 upsampled to 1.5×1.5×1.5 mm3) obtained and processed using state-of-the-art hardware and methodology. By evaluating the appearances and streamline metrics of the corticospinal tract, anterior commissure and small subcortical U-shaped fibers as test bundles, we demonstrated that the original high-resolution dataset outperformed both the low-resolution and upsampled data in resolving complex regional anatomy.
Introduction
Acquisition of diffusion MRI (dMRI) images for fiber tractography is widely performed at a relatively low spatial resolution (LR) to maintain practical scanning and subsequent computational times. Larger voxels have more partial volume effect (PVE) which makes resolving crossing and bending fibers more difficult, 1,2 although other factors, like angular resolution, play a role.3 Smaller tracts with more complex morphology (e.g., the subcortical U-shaped fibers) may be particularly affected, 2 with direct relevance to investigation and surgical planning of non-lesional epileptic disorders.4 Interpolation of post-acquisition dMRI data to a higher resolution (HR), or upsampling, may have advantages for fiber tractography1 although this has had mixed results.5 The aim of this work is to assess the effect of spatial resolution on fiber tractography in datasets acquired and processed using state-of-the-art hardware and methodology.Methods
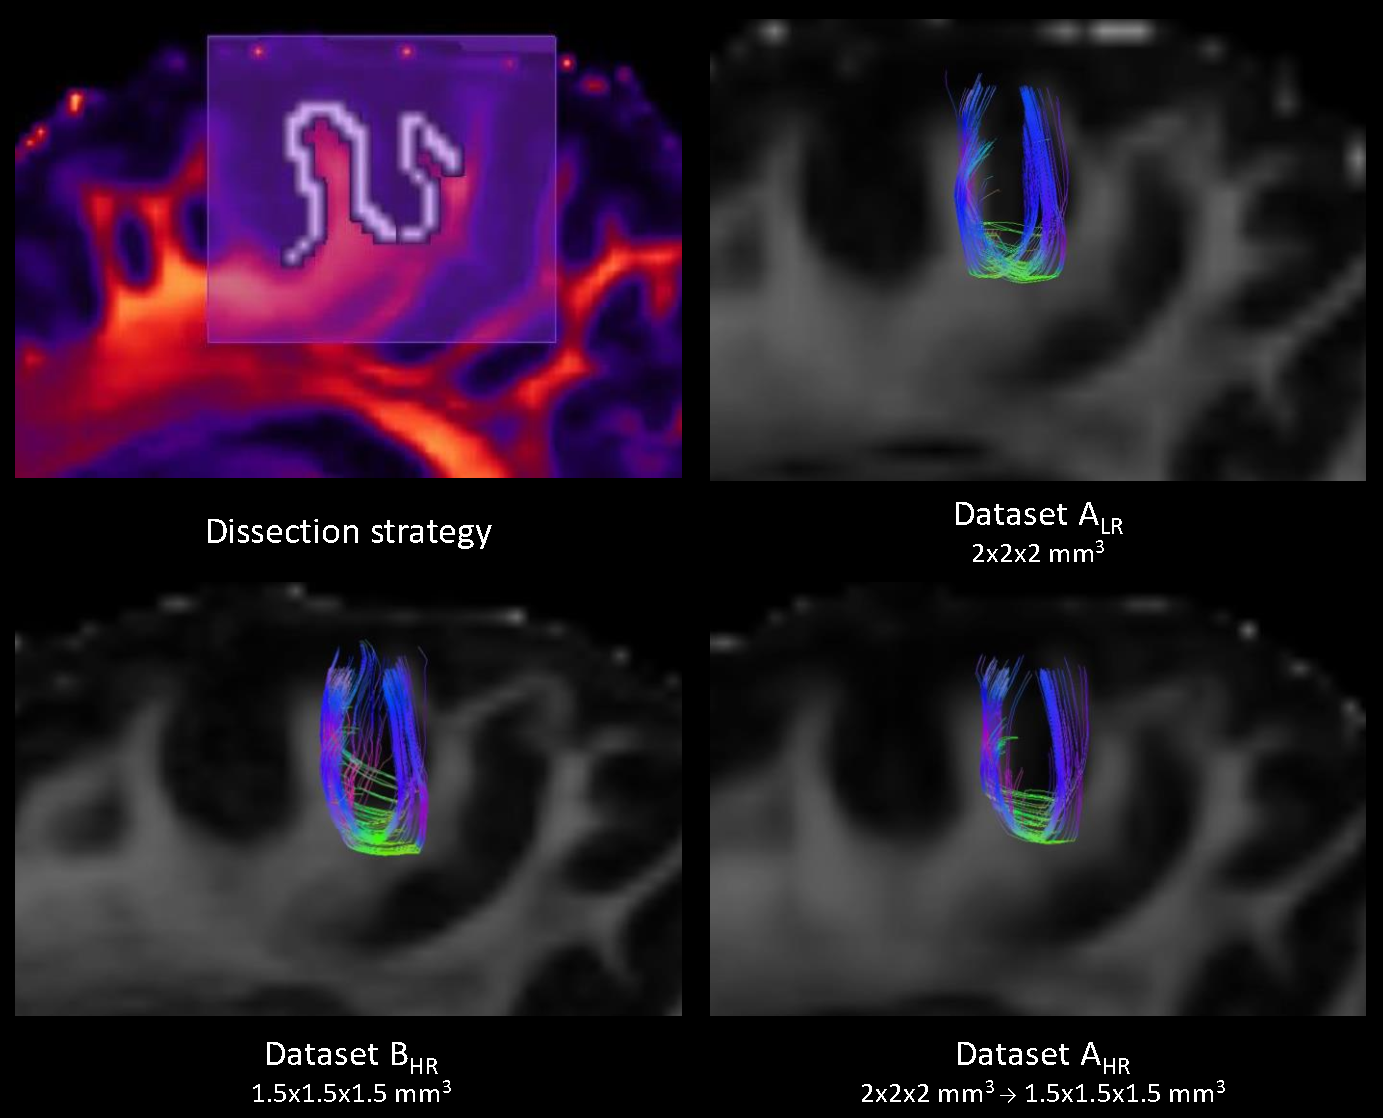
Acquisition and processing: A healthy volunteer was scanned twice in one session on a 3T Siemens Connectom system. Two dMRI datasets were acquired: dataset ALR with voxel size 2×2×2 mm3; b=0, 200, 500, 1200, 2400, 4000 s/mm2 in 13, 20, 20, 30, 60, 60 directions, respectively; TR/TE 2600/59 ms; acquisition time ~11 mins; and dataset BHR with voxel size 1.5×1.5×1.5 mm3; b=0, 200, 500, 1200, 2400, 4000 s/mm2 in 11, 20, 20, 30, 60, 60 directions, respectively; TR/TE 4200/64 ms; acquisition time ~19 mins. Both datasets were denoised (MPPCA), 6 corrected for Eddy current distortion and motion artifact (EDDY), 7 EPI distortion (TOPUP), 8 gradient non-linearity9 and Gibbs artifact.10 Next, dataset AHR was trilinearly resampled to 1.5x1.5x1.5 mm3 voxels to produce dataset AHR. Coregistration between datasets was not performed to preserve data quality. Fiber orientation distribution functions (fODFs)11 were then derived using multi-shell multi-tissue constrained spherical deconvolution (MSMT-CSD).12
Data comparison: Local fODFs were visually inspected in regions with crossing and fanning fibers. Following that, three white matter tracts were manually dissected and compared: 1) corticospinal tract (CST, large bundle with significant lateral fanning), 2) anterior commissure (AC, thin bundle) and 3) U-shaped fibers of the central sulcus (UCS, small structure turning sharply and prone to gyral bias2). fODF peaks (thresholded at amplitudes ≥0.1) were used for real-time tractography in Fibernavigator.13 Whole-brain seeding was performed (min/max length: 30/200 mm, step size = 0.5x voxel size, angular threshold: 75° for CST, 60° for AC, 90° for UCS) followed by region of interest (ROI)-based dissection. Single spurious streamlines were manually pruned. Tracts were assessed visually and compared based on the following streamline metrics: a) count index (CI = streamline count/N total streamlines, where N depends on the voxel size and dataset dimensions), b) mean fractional anisotropy (FA) and c) mean tract length (TL).
Results
Visual assessment of local fODFs revealed suboptimal representation of the lateral fanning in the gyri (Fig.1, red box) irrespective of resolution, although dataset BHR performed qualitatively better (Fig.1, yellow box). Larger crossing fibers were well-defined across all datasets (Fig.1, blue box).
Although all three tracts appeared morphologically similar across the datasets (Fig. 2-4), the lateral fanning of CST was better captured on BHR (Fig.2). Streamline metrics showed variation with respect to different resolution or resampling (Fig.5). All tracts were longer in AHR and BHR compared to ALR, possibly owing to PVE.
FA was higher for ALR than BHR in the case of CST and AC but remained constant across all three datasets with UCS, possibly because this smaller tract remained more homogenous throughout its length.
CI was higher for BHR than ALR in all three tracts. While the difference was not as marked with AC, it was much pronounced in the case of CST and UCS. Upsampling had the effect of increasing CI for all three tracts but still fell short of the CI reflected by BHR.
Discussion
Although the benefits of using lower resolution on scanning and computational time may be justified when investigating major fiber bundles, caution must be exercised when the tracts of interest14 display sophisticated configuration (e.g., U-shaped fibers). We demonstrate that higher resolution is better at capturing fanning fibers and resolving complex anatomy resulting in increased streamline counts. While upsampling may improve tract representation for large or moderate pathways, 1 our results show that upsampled data performed worse than the original high-resolution dataset. Promising techniques such as super-resolution15,16 and image quality transfer17 have been recently proposed to address this challenge.Conclusions
The choice of spatial resolution should depend on the fiber pathway of interest, as lower resolution reconstructions might underestimate complex regional anatomy.Acknowledgements
DS is supported by the Wellcome Trust-funded GW4 Clinical Academic Training fellowship and Welsh Clinical Academic Track fellowship. MC is supported by the Postdoctoral Fellowships Program from the Natural Sciences and Engineering Research Council of Canada (NSERC) and a Wellcome Trust New Investigator Award (to DKJ). This work was also funded by a Wellcome Trust Strategic Award and a Wellcome Trust New Investigator Award.References
- Dyrby TB, Lundell H, Burke MW, Reislev NL, Paulson OB, Ptito M, Siebner HR. Interpolation of diffusion weighted imaging datasets. Neuroimage 2014;103:202-213.
- St-Onge E, Daducci A, Girard G, Descoteaux M. Surface-enhanced tractography (SET). Neuroimage 2018;169:524-539.
- Vos SB, Aksoy M, Han Z, Holdsworth SJ, Maclaren J, Viergever MA, Leemans A, Bammer R. Trade-off between angular and spatial resolutions in in vivo fiber tractography. Neuroimage 2016;129:117-132.
- O'Halloran R, Feldman R, Marcuse L, Fields M, Delman B, Frangou S, Balchandani P. A method for u-fiber quantification from 7 T diffusion-weighted MRI data tested in patients with nonlesional focal epilepsy. Neuroreport 2017;28(8):457-461.
- Tournier JD, Calamante F, Connelly A. MRtrix: Diffusion tractography in crossing fiber regions. International Journal of Imaging Systems and Technology 2012;22(1):53-66.
- Veraart J, Novikov DS, Christiaens D, Ades-Aron B, Sijbers J, Fieremans E. Denoising of diffusion MRI using random matrix theory. Neuroimage 2016;142:394-406.
- Andersson JLR, Sotiropoulos SN. An integrated approach to correction for off-resonance effects and subject movement in diffusion MR imaging. Neuroimage 2016;125:1063-1078.
- Andersson JL, Skare S, Ashburner J. How to correct susceptibility distortions in spin-echo echo-planar images: application to diffusion tensor imaging. Neuroimage 2003;20(2):870-888.
- Glasser MF, Sotiropoulos SN, Wilson JA, Coalson TS, Fischl B, Andersson JL, Xu J, Jbabdi S, Webster M, Polimeni JR, Van Essen DC, Jenkinson M, Consortium WU-MH. The minimal preprocessing pipelines for the Human Connectome Project. Neuroimage 2013;80:105-124.
- Kellner E, Dhital B, Kiselev VG, Reisert M. Gibbs-ringing artifact removal based on local subvoxel-shifts. Magn Reson Med 2016;76(5):1574-1581.
- Tournier JD, Calamante F, Connelly A. Robust determination of the fibre orientation distribution in diffusion MRI: non-negativity constrained super-resolved spherical deconvolution. Neuroimage 2007;35(4):1459-1472.
- Jeurissen B, Tournier JD, Dhollander T, Connelly A, Sijbers J. Multi-tissue constrained spherical deconvolution for improved analysis of multi-shell diffusion MRI data. Neuroimage 2014;103:411-426.
- Chamberland M, Whittingstall K, Fortin D, Mathieu D, Descoteaux M. Real-time multi-peak tractography for instantaneous connectivity display. Front Neuroinform 2014;8:59.
- Chamberland M, Tax CMW, Jones DK. Meyer's loop tractography for image-guided surgery depends on imaging protocol and hardware. Neuroimage Clin 2018;20:458-465.
- Coupe P, Manjon JV, Chamberland M, Descoteaux M, Hiba B. Collaborative patch-based super-resolution for diffusion-weighted images. Neuroimage 2013;83:245-261.
- Jeurissen B, Ramos-Llordén G, Vanhevel F, Parizel PM, Sijbers J. Super-resolution for spherical deconvolution of multi-shell diffusion MRI data. ISMRM 2018. #0036.
- Alexander DC, Zikic D, Ghosh A, Tanno R, Wottschel V, Zhang J, Kaden E, Dyrby TB, Sotiropoulos SN, Zhang H, Criminisi A. Image quality transfer and applications in diffusion MRI. Neuroimage 2017;152:283-298.
Figures