3317
Measurement of cerebral perfusion changes during breath holding using pCASL with an accelerated 3D readout: an approach to quantify cerebrovascular reactivity.1Radiology, Clínica Universidad de Navarra, Pamplona, Spain, 2Anesthesia, Perioperative Medicine and Critical Care, Clínica Universidad de Navarra, Pamplona, Spain, 3Siemens Healthineers, Madrid, Spain
Synopsis
Cerebrovascular reactivity (CVR) can be defined as the change in flow in response to a vasoactive agent. Hypercapnia is known to cause global increases in cerebral blood flow (CBF). ASL can provide a quantitative measure of CBF changes. The objective of this research was to determine whether pseudo-continuous ASL (pCASL) with an accelerated 3D readout, combined with breath-hold induced hypercapnia, is a practicable method for evaluating CVR. Results showed that the faster readout provided whole-brain coverage at isotropic resolution and allowed a post-labeling delay long enough to avoid macrovascular signal artifacts, while keeping TR short to sample several points per breath-hold.
Introduction
The human brain uses a sophisticated system of regulation of cerebral blood flow (CBF), known as cerebrovascular reactivity (CVR). Experimentally, CVR can be defined as the degree of vasodilatation or constriction in response to a vasoactive agent. Small elevations in end-tidal CO2 (PETCO2) on the order of 5-8 mmHg are capable of producing measurable increases in global CBF. Hypercapnia can be induced by administration of a gas mixture rich in CO2. However, this method can produce discomfort in the subject. An alternative to induce hypercapnia is to use a breath-hold (BH) paradigm. BH paradigms have been used in conjunction with BOLD imaging to evaluate CVR1. However, the BOLD signal does not measure directly vascular changes. In contrast, arterial spin labeling (ASL) can provide a quantitative measure of hypercapnia induced CBF changes2,3.
The goal of this study was to demonstrate that CVR could be mapped during a breath holding task using pseudo-continuous ASL (pCASL) combined with an accelerated 3D readout4.The faster readout and a shorter labeling time allowed increasing the post-labeling delay, with respect to previous implementations3, to avoid macrovascular signal artifacts, while achieving higher image resolution and whole-brain coverage.
Methods
Subjects: Ten healthy volunteers (seven females, age=25.2 years, SD=4.26) participated in the study, after signing written informed consent. Standard MRI exclusion criteria were followed.
Scanning protocol: Volunteers were scanned using a 3.0T Skyra (Siemens) equipped with a 32-channel head coil. The MRI study included: a T1-weighted anatomical 3D MPRAGE sequence, a TOF angiography sequence (used to position the labeling plane), and the pCASL sequence (labeling time=1.2 s, post-labeling delay=1.4 s), with background suppression and single-shot 3D RARE stack-of-spirals readout with through-plane acceleration (1D-GRAPPA), as previously described4, with parameters: TE=10.2 ms, TR=3 s, resolution=3.75 mm isotropic, FOV=240x240x98.
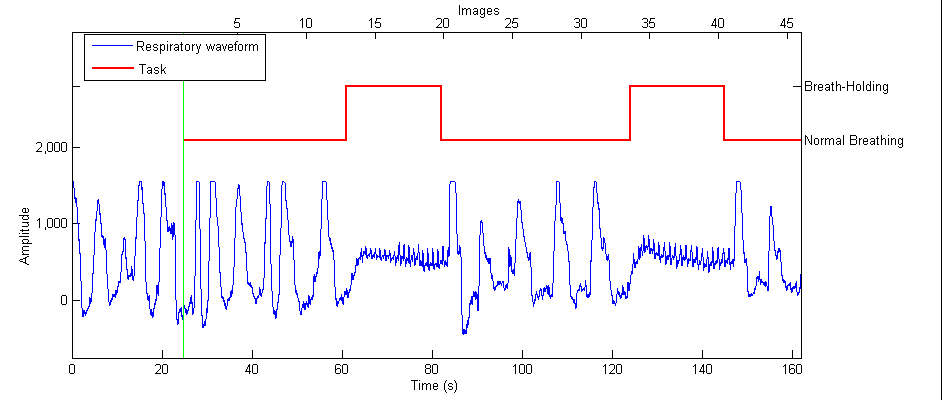
Breath-hold task: Two cycles of the BH challenge are schematically presented in Fig 1. It started with a free breathing period of 42 s, followed by end-expirational BH periods of 21 s, for 10 cycles. The duration of the BH task was adjusted to the TR of the ASL sequence and adapted from previous recommendations5, while the time after the task was longer in order to allow a return of CO2 levels to baseline values6. The number of cycles used was adapted from recommendations by Lipp et al.7. End-expirational BH was chosen since a shorter BH duration is needed6 and to minimize variation between participants8,9. Audible instructions for the task were given. The respiratory signal was recorded during the scan using respiratory bellows. A MRI-compatible patient monitoring system was used to measure PETCO2 during the task. The expired gases were collected trough a nasal cannula.
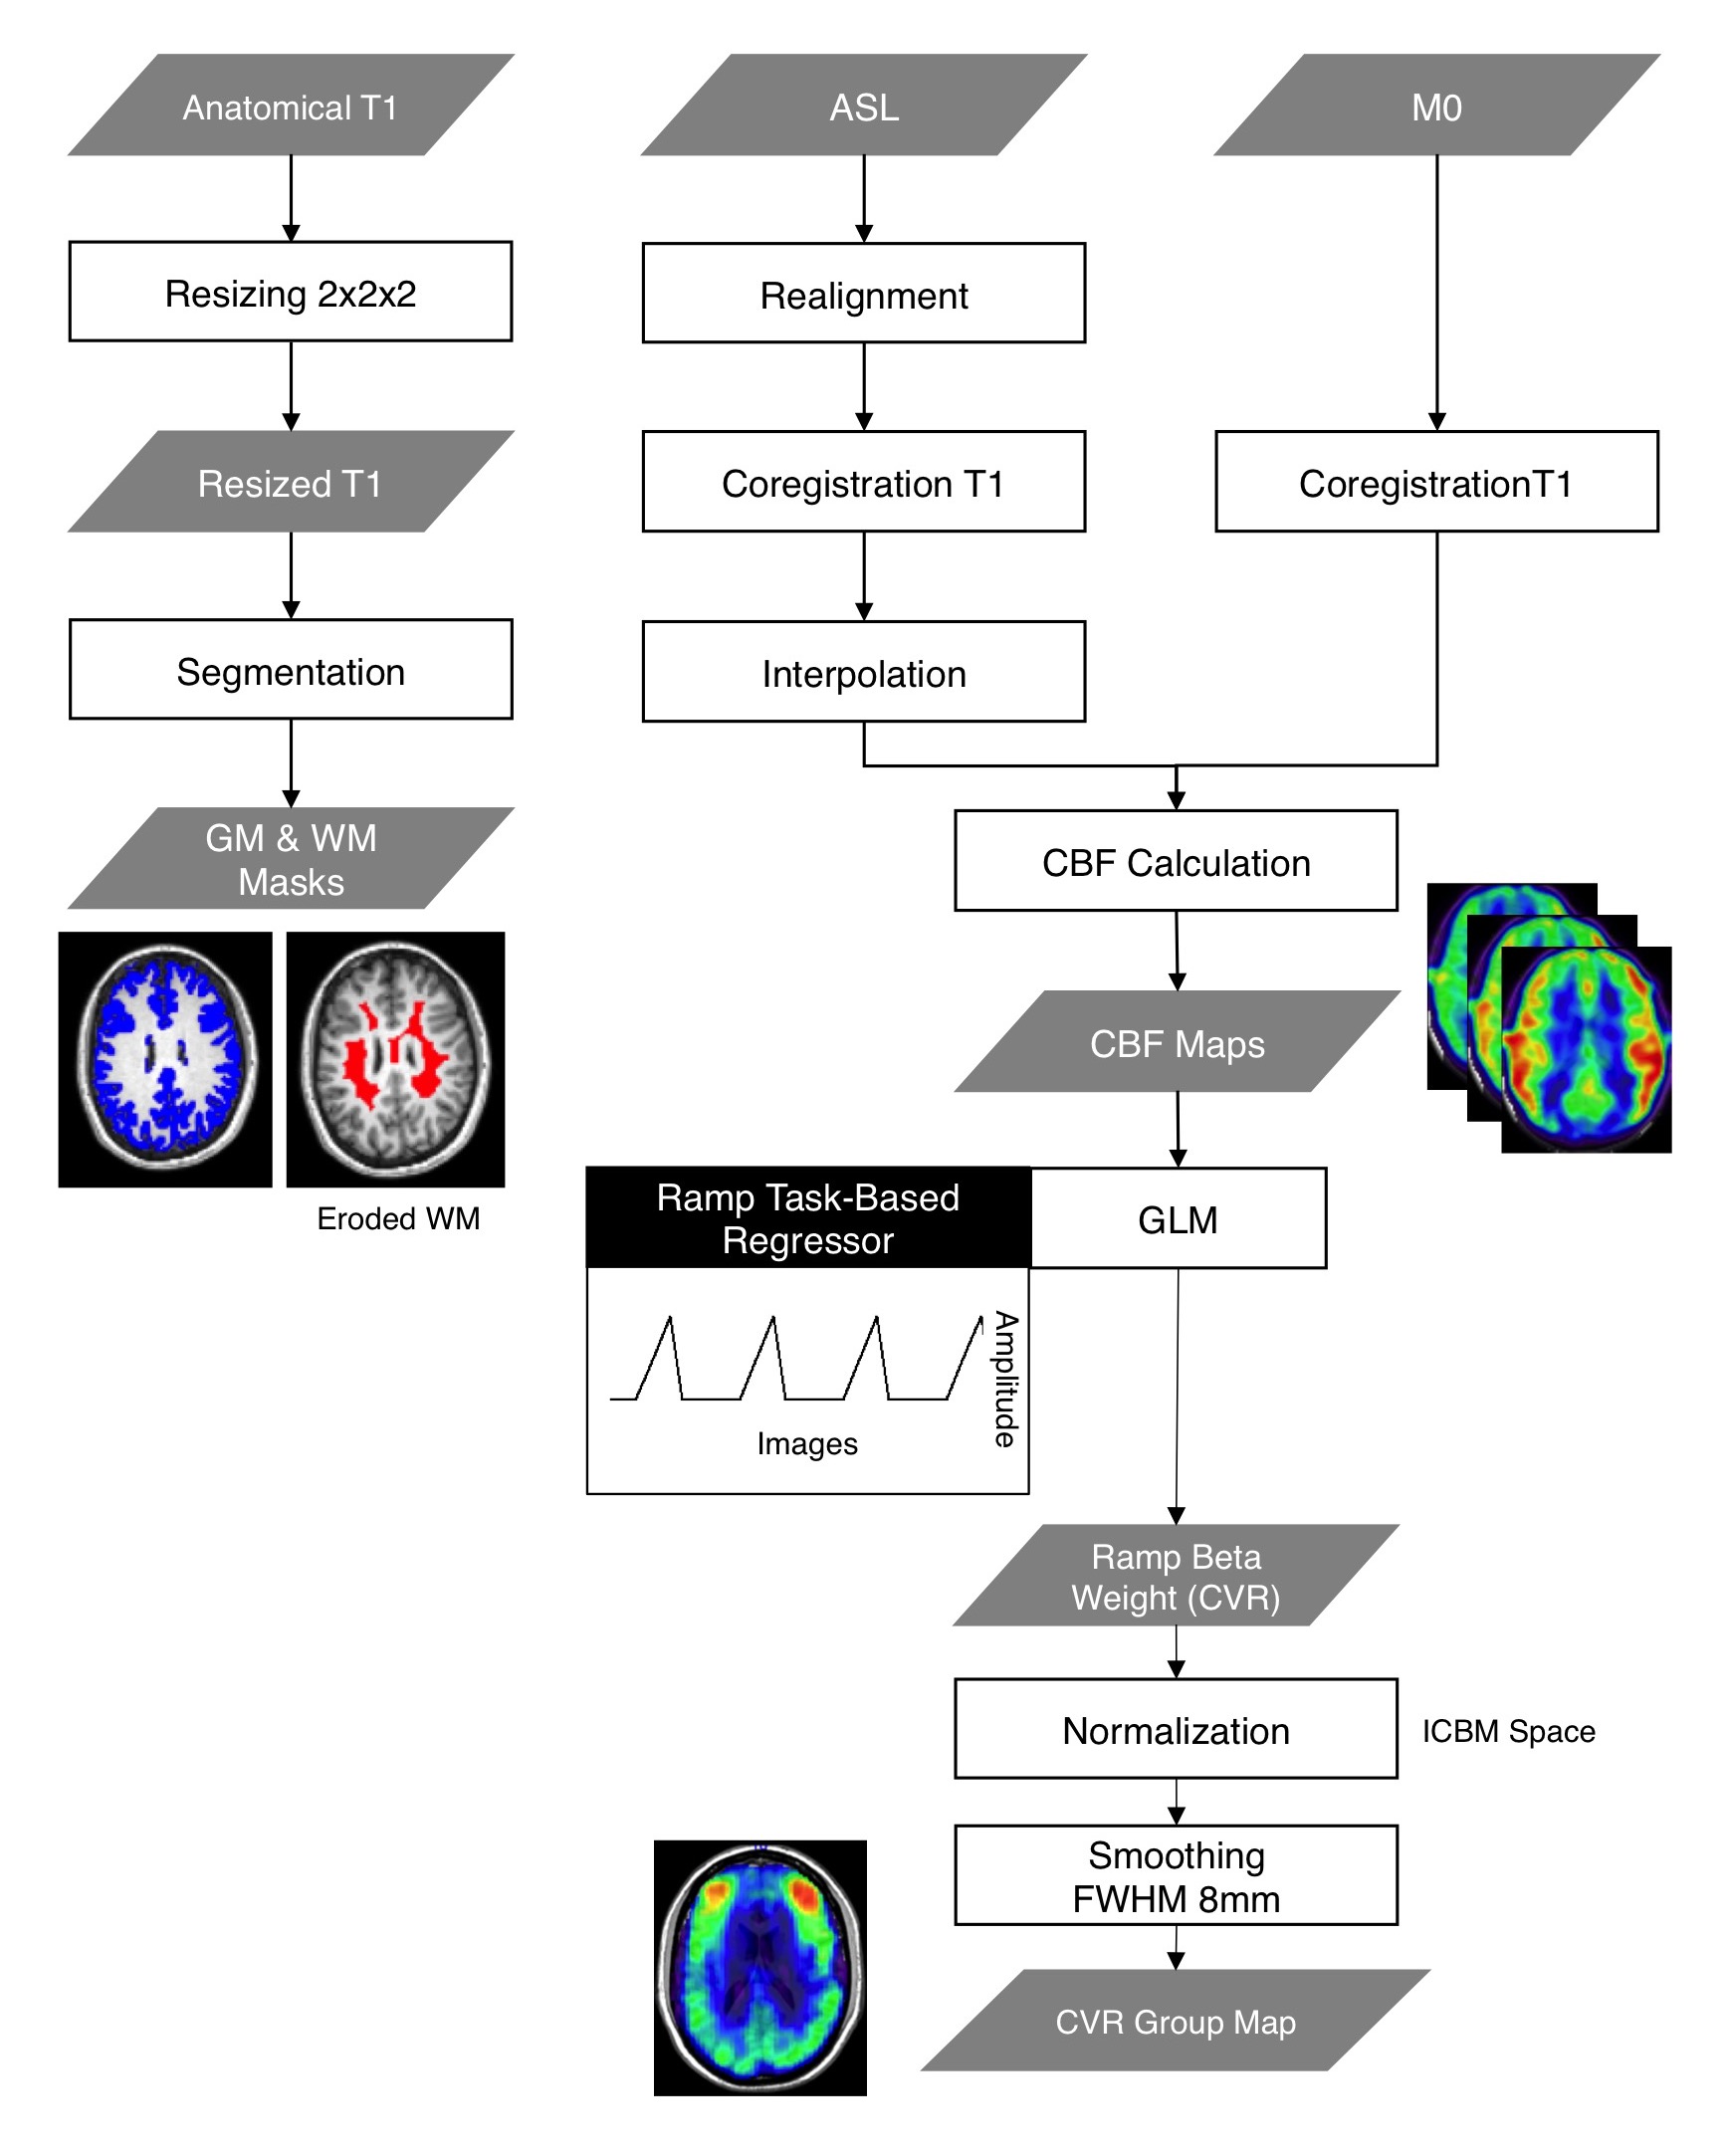
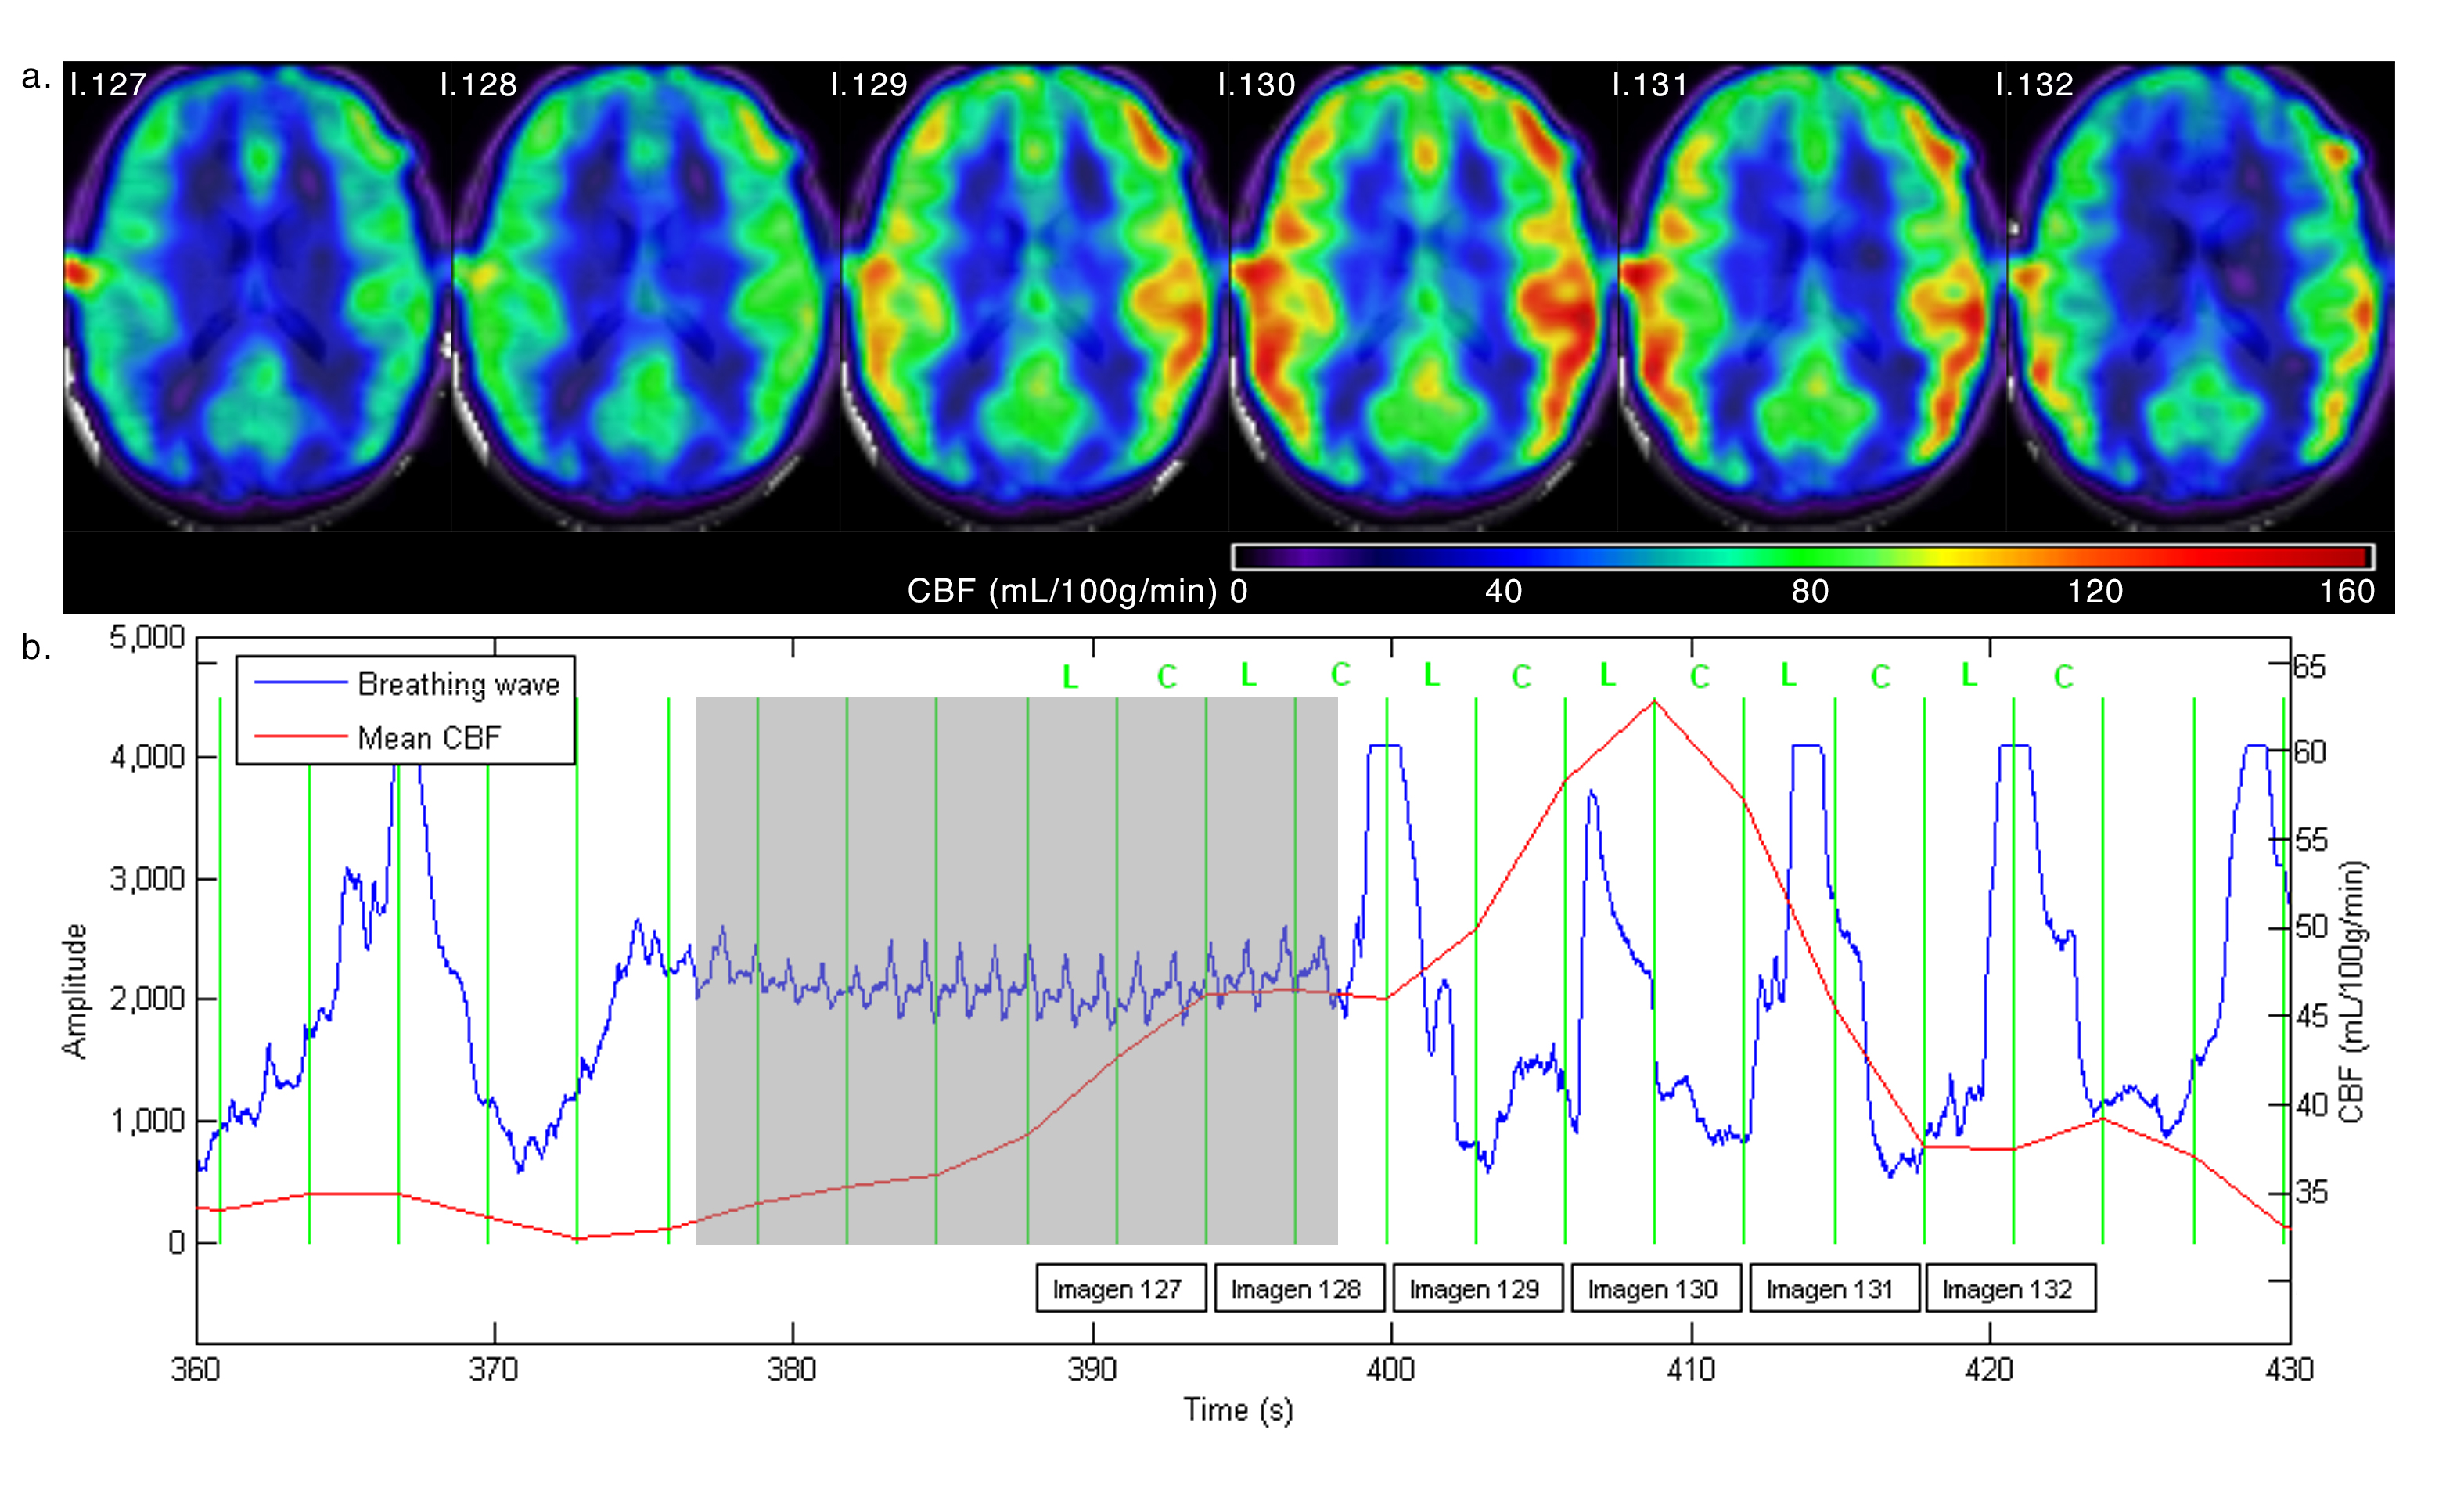
Data processing and statistical analysis: A complete flow chart of the image processing and statistical analysis steps is presented in Fig 2. ASL images were realigned, coregistered to the anatomical T1 and sinc-interpolated to double the time resolution, followed by subtraction of label and control. Perfusion weighted images were converted to CBF maps using a single-compartment model. The CBF response to BH was delayed with respect to the respiratory trace (Fig. 3). The time delay was calculated by cross-correlation of the mean perfusion signal time course with the respiratory trace. A CVR map was computed using a GLM with a ramp regressor that was adjusted by the calculated delay and the measured PETCO2 (mean PETCO2 change during the 10 BH periods). Mean CVR values in grey (GM) and white matter (WM) were obtained using GM and WM masks derived from the segmentation of the anatomical T1 (Fig. 2). Statistically significant differences in delays and CVR between GM and WM were evaluated using paired t-tests.
Results
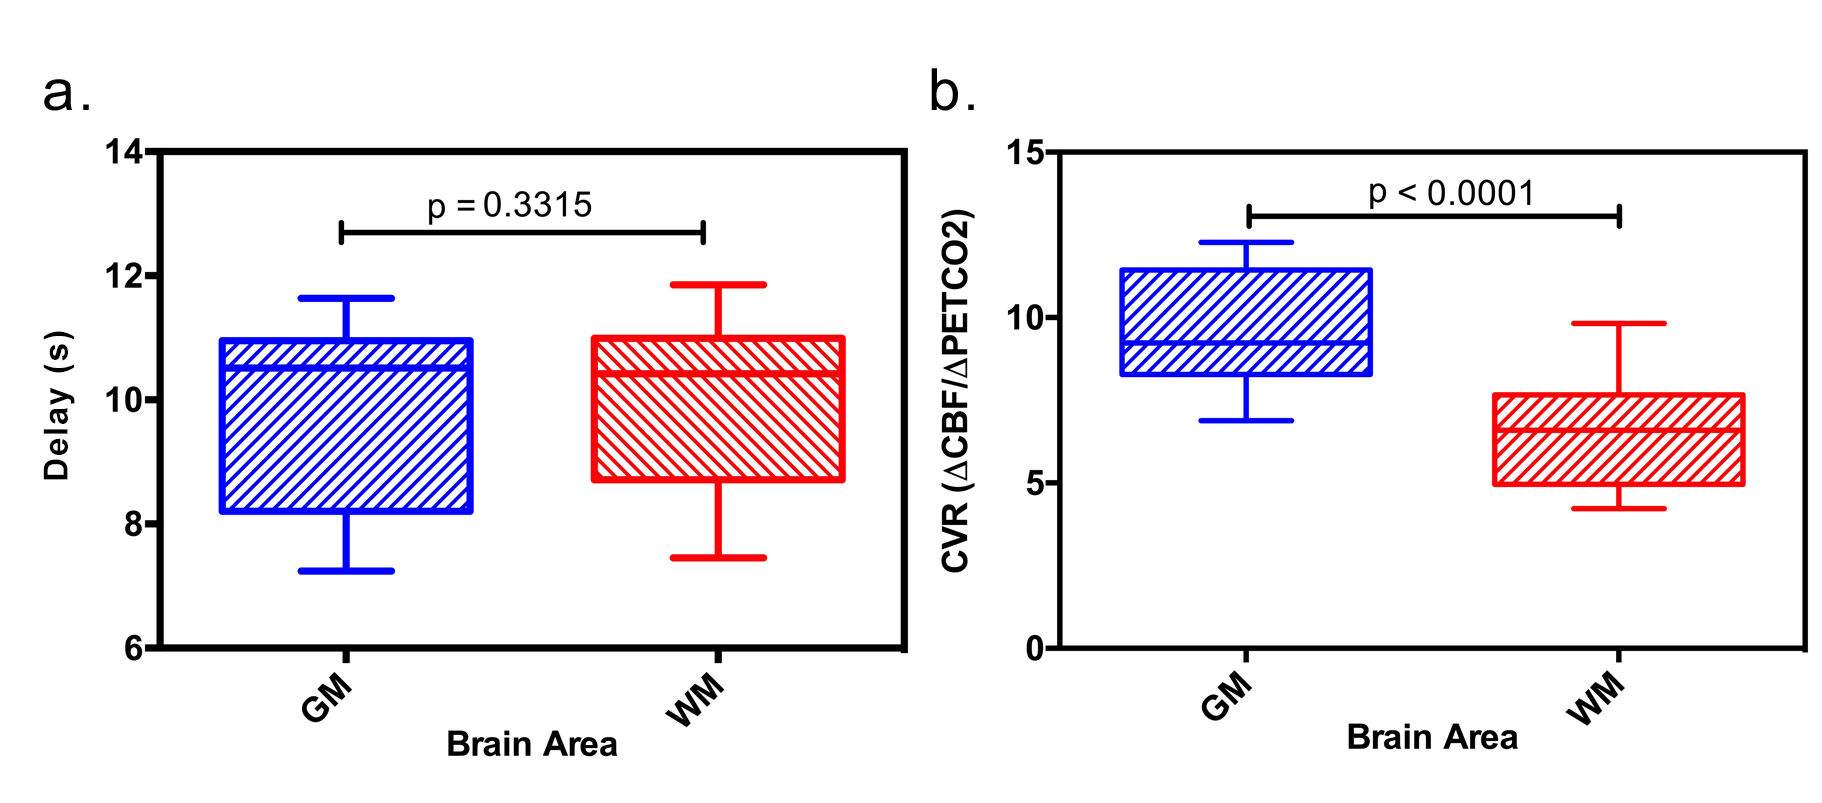
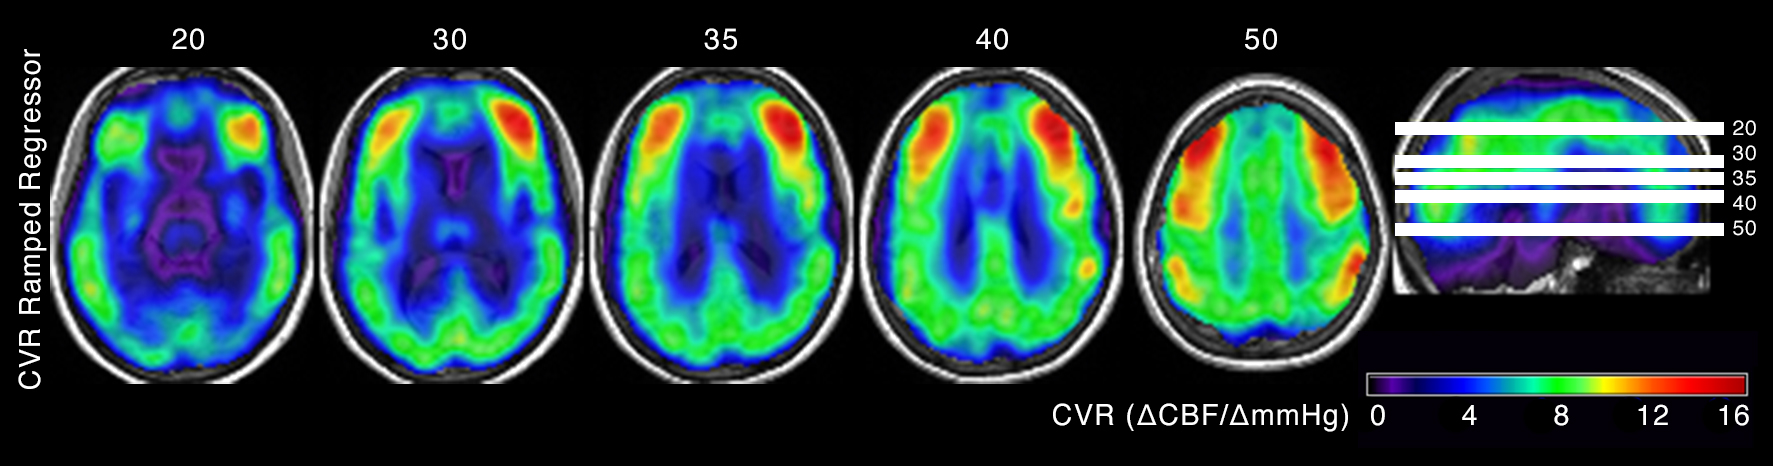
All subjects completed the BH task without difficulties. CBF during normal breathing (calculated using data acquired during the first 36 s of the scan) was within the normal range for healthy subjects (58.7 mL/100g/min, SD=14.8, for GM and 36.2 mL/100g/min, SD=11.5, for WM). Group mean PETCO2 changes were 4.6 mmHg (SD=0.52). No statistically significant differences were found between the calculated delays (Fig. 4) in GM (9.92 s, SD=1.54) and WM (10.0 s, SD=1.35). Elevated CBF was observed in most cerebral regions under hypercapnia (Fig. 5). The group mean GM CVR (9.61 (mL/min/100g)/mmHg, SD=1.89) was significantly higher than WM CVR (6.52 (mL/min/100g)/mmHg, SD=1.78) (p < 0.0001) (Fig 4).Discussion and Conclusion
This study confirms that CVR can be quantified using pCASL during breath hold induced hypercapnia. The accelerated 3D readout provided whole-brain coverage at isotropic resolution and allowed a post-labeling delay long enough to avoid macrovascular signal artifacts, while keeping TR short to sample several points per breath-hold.Acknowledgements
Grant: Acción Estratégica en Salud PI18/00084 and Spanish Ministry of Economy and Competitiveness Grant IEDI-2017-00826.References
1. Pillai, J. J. & Mikulis, D. J. Cerebrovascular reactivity mapping: an evolving standard for clinical functional imaging. Am. J. Neuroradiol. 36, 7–13 (2015).
2. Noth, U. et al., Cerebral vascular response to hypercapnia: determination with perfusion MRI at 1.5 and 3 Tesla using a pulsed arterial spin labeling technique. J Mag Reson Imaging 24, 1229-1235 (2006).
3. Tancredi, F. B. & Hoge, R. D. Comparison of cerebral vascular reactivity measures obtained using breath-holding and CO2 inhalation. J. Cereb. Blood Flow Metab. 33, 1066–1074 (2013).
4. Vidorreta, M. et al.Whole-brain background-suppressed pCASL MRI with 1D-accelerated 3D RARE Stack-Of-Spirals readout. PLoS One. 12, 1–16 (2017).
5. Urback, A. L., MacIntosh, B. J. & Goldstein, B. I. Cerebrovascular reactivity measured by functional magnetic resonance imaging during breath-hold challenge: A systematic review. Neurosci. Biobehav. Rev. 79, 27–47 (2017).
6. Bright, M. G., Donahue, M. J., Duyn, J. H., Jezzard, P. & Bulte, D. P. The effect of basal vasodilation on hypercapnic and hypocapnic reactivity measured using magnetic resonance imaging. J. Cereb. Blood Flow Metab. 31, 426–438 (2011).
7. Lipp, I., Murphy, K., Caseras, X. & Wise, R. G. Agreement and repeatability of vascular reactivity estimates based on a breath-hold task and a resting state scan. Neuroimage. 113, 387–396 (2015).
8. Kastrup, A., Krüger, G., Glover, G. H., Neumann-Haefelin, T. & Moseley, M. E. Regional Variability of Cerebral Blood Oxygenation Response to Hypercapnia. Neuroimage. 10, 675–681 (1999).
9. Scouten, A. & Schwarzbauer, C. Paced respiration with end-expiration technique offers superior BOLD signal repeatability for breath-hold studies. Neuroimage. 43, 250–257 (2008).
Figures