3314
The myelin-weighted connectome: a new look at multiple sclerosis1NeuroPoly Lab, Ecole Polytechnique de Montreal, Montreal, QC, Canada, 2Department of Neurosciences, Faculty of Medicine, University of Montreal, Montreal, QC, Canada, 3Macedonian Academy of Sciences and Arts, Skopje, FYR Macedonia, 4Department of Medicine, Surgery and Neuroscience, University of Siena, Siena, Italy, 5Montreal Neurological Institute, Montreal, QC, Canada, 6Montreal Heart Institute, Montreal, QC, Canada
Synopsis
Myelin imaging has yet to make its way into standard connectomics protocols. Myelin-specific MRI metrics are useful for the assessment of neurological conditions that affect white matter. In this
Introduction
Multiple sclerosis (MS) is a chronic, inflammatory and neurodegenerative disease characterized by pathological abnormal heterogeneity affecting the myelin sheath. Myelin is a lipid-rich dielectric material that wraps axons in the central nervous system to provide efficient transfer of information. To date, most of the connectomics studies used standard diffusion metrics, such as fractional anisotropy (FA) or number of streamlines (NOS), to evaluate the neurological disease. However, these metrics are not specific to myelin. FA is strongly affected by the underlying fiber organization (crossing fibers, “kissing” fibers, etc.), whereas the NOS is only a topological measure that is not specific to the underlying microstructure. Recent studies1,2 have reported a range of brain network properties derived from myelin metrics, but it is unclear whether these novel metrics can shine a light on neurodegenerative diseases. In this abstract we introduce the MTR-weighted connectome to the study of multiple sclerosis.Methods & Data
42 MS patients (25 females, 17 males, mean age ± sd: 44.1±15) and 21 healthy subjects (HC) (11 females, 9 males, mean age ± sd: 39.5±10.6) participated in the present study.
Diffusion images were acquired on a 1.5T Philips Gyroscan with 32 gradient directions (2.5mm3, bmax=1000, TR/TE = 8500/100ms). MTR was calculated from a pair of MT on/off images (1x1x3 mm, TR/TE = 35/10ms). Furthermore, a T1-weighted and a FLAIR image were acquired for segmentation of the white matter lesions in MS participants. The MS lesions were segmented using a fully automatic lesion growth algorithm3 as implemented in the LST toolbox (www.statisticalmodelling.de/lst.html) for SPM.
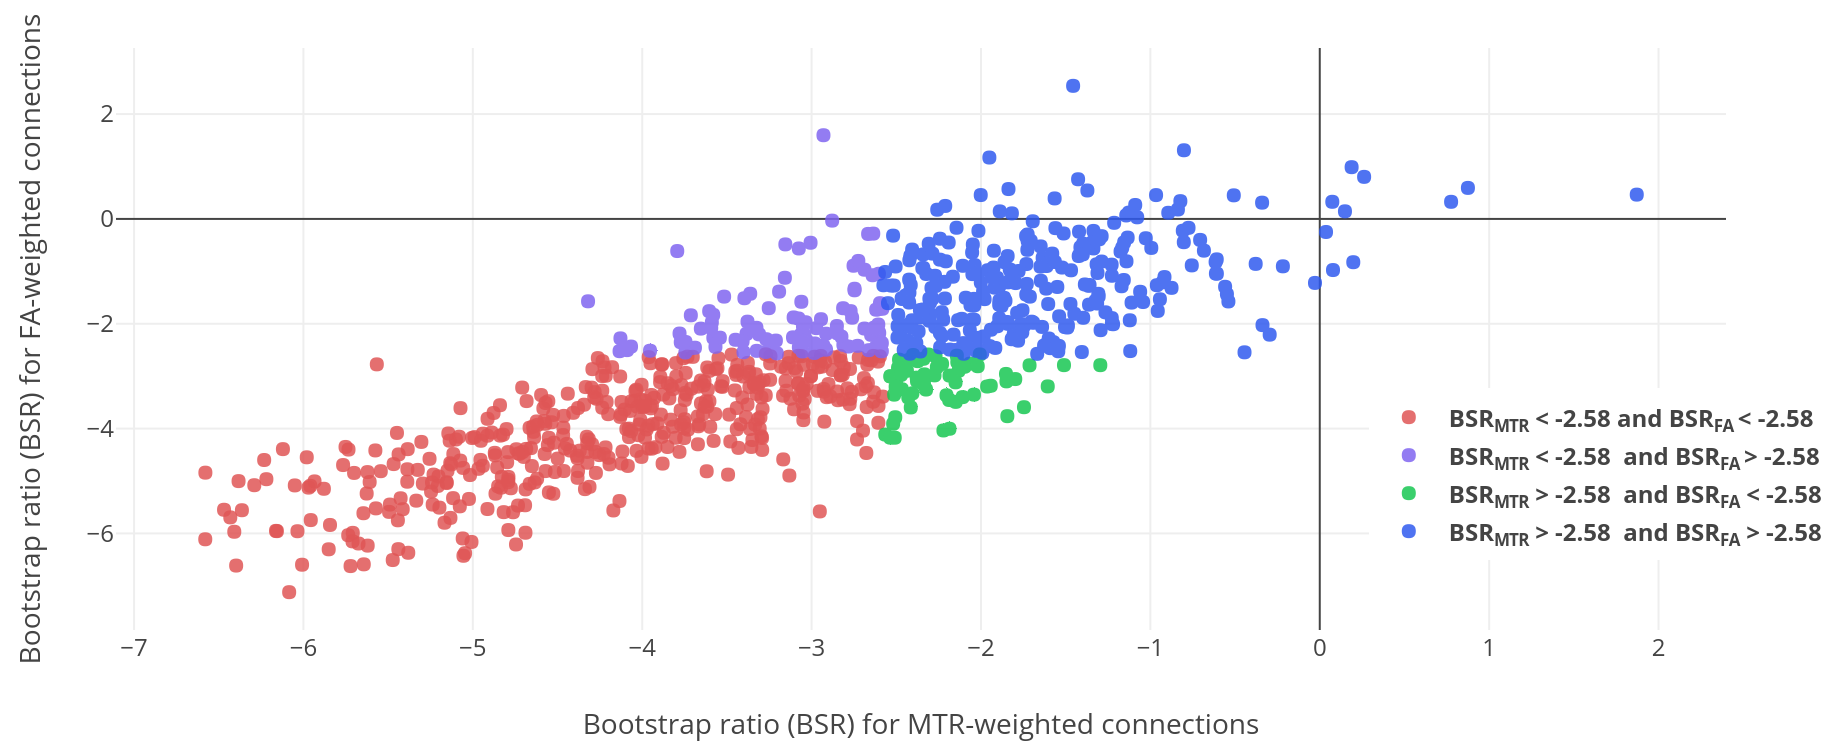
For each subject, we reconstructed a connectome weighted by FA and MTR. The weight corresponds to the median FA and MTR along the tracts reconstructed using a deterministic tractography algorithm4. The fibers passing through MS lesions were discarded from the analysis, as these tracts bias the analysis and make it more difficult to interpret the results in the normal-appearing white matter. The most consistent connections were selected from the connectivity matrices, and a consensus network was created for each subject. Thereafter, a partial least square (PLS) analysis5,6 was applied on the consensus networks to evaluate the difference between HC and MS connectomes. The multivariate connectivity pattern was assessed by permutation tests7 with 500 permutations by randomly reordering the subjects in the data matrix without preserving the subject’s group assignments (i.e. MS and HC label was ignored). Then, a bootstrapping procedure7 with 500 bootstraps was performed by randomly resampling the subjects with replacement, while preserving the original group assignment. The bootstrapping was used for weighting the contribution of individual connections. A bootstrap ratio (BSR) was computed by dividing the connection weight from the singular vector by its bootstrap-estimated standard error. The BSR was thresholded at values ± 2.58, (corresponding to the 99% confidence interval), to identify connections where there is a difference between MS patients and HC (Figure 1).
Results
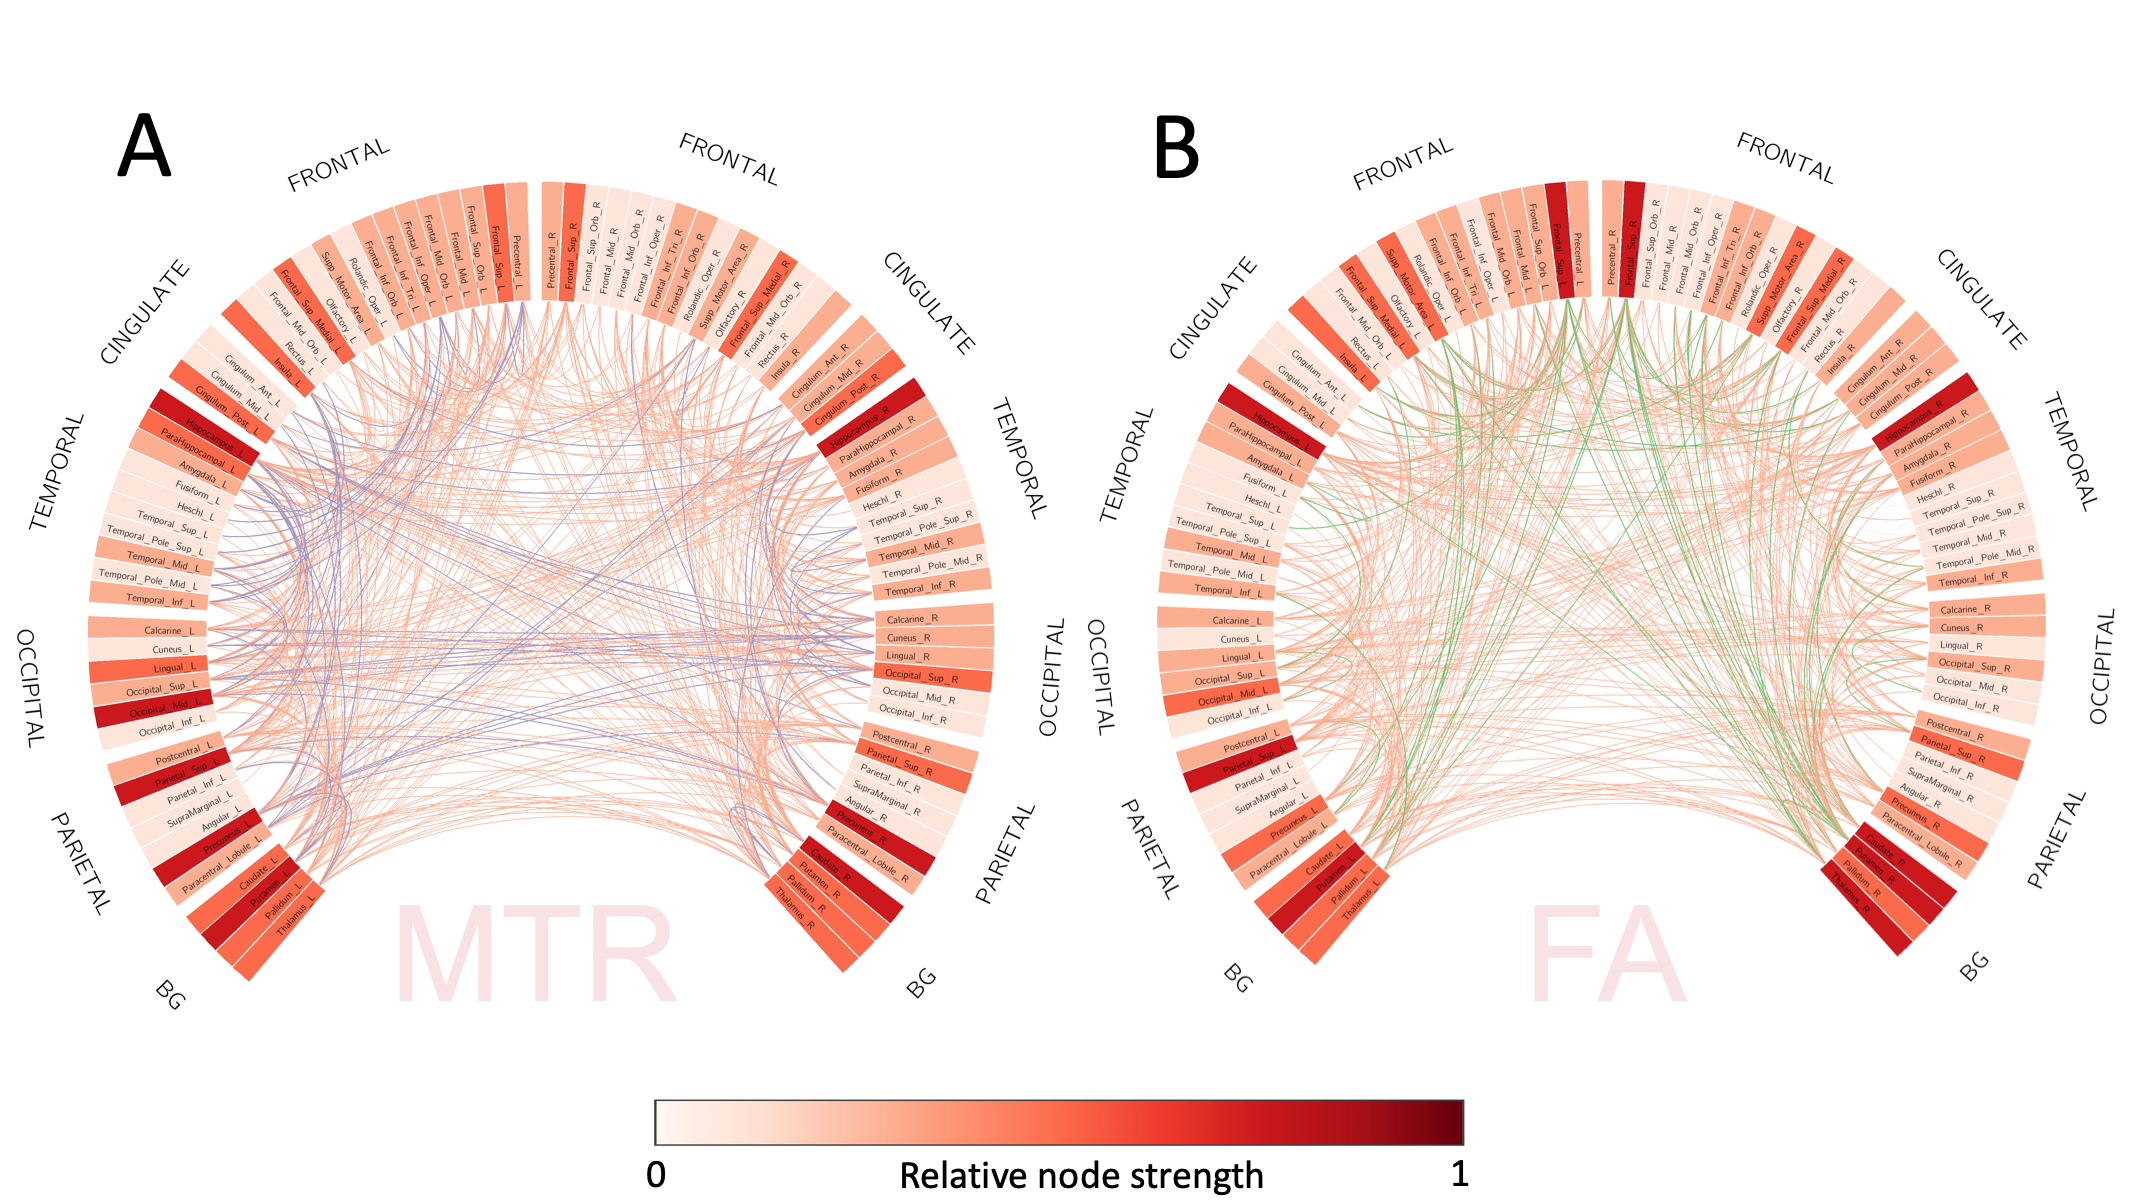
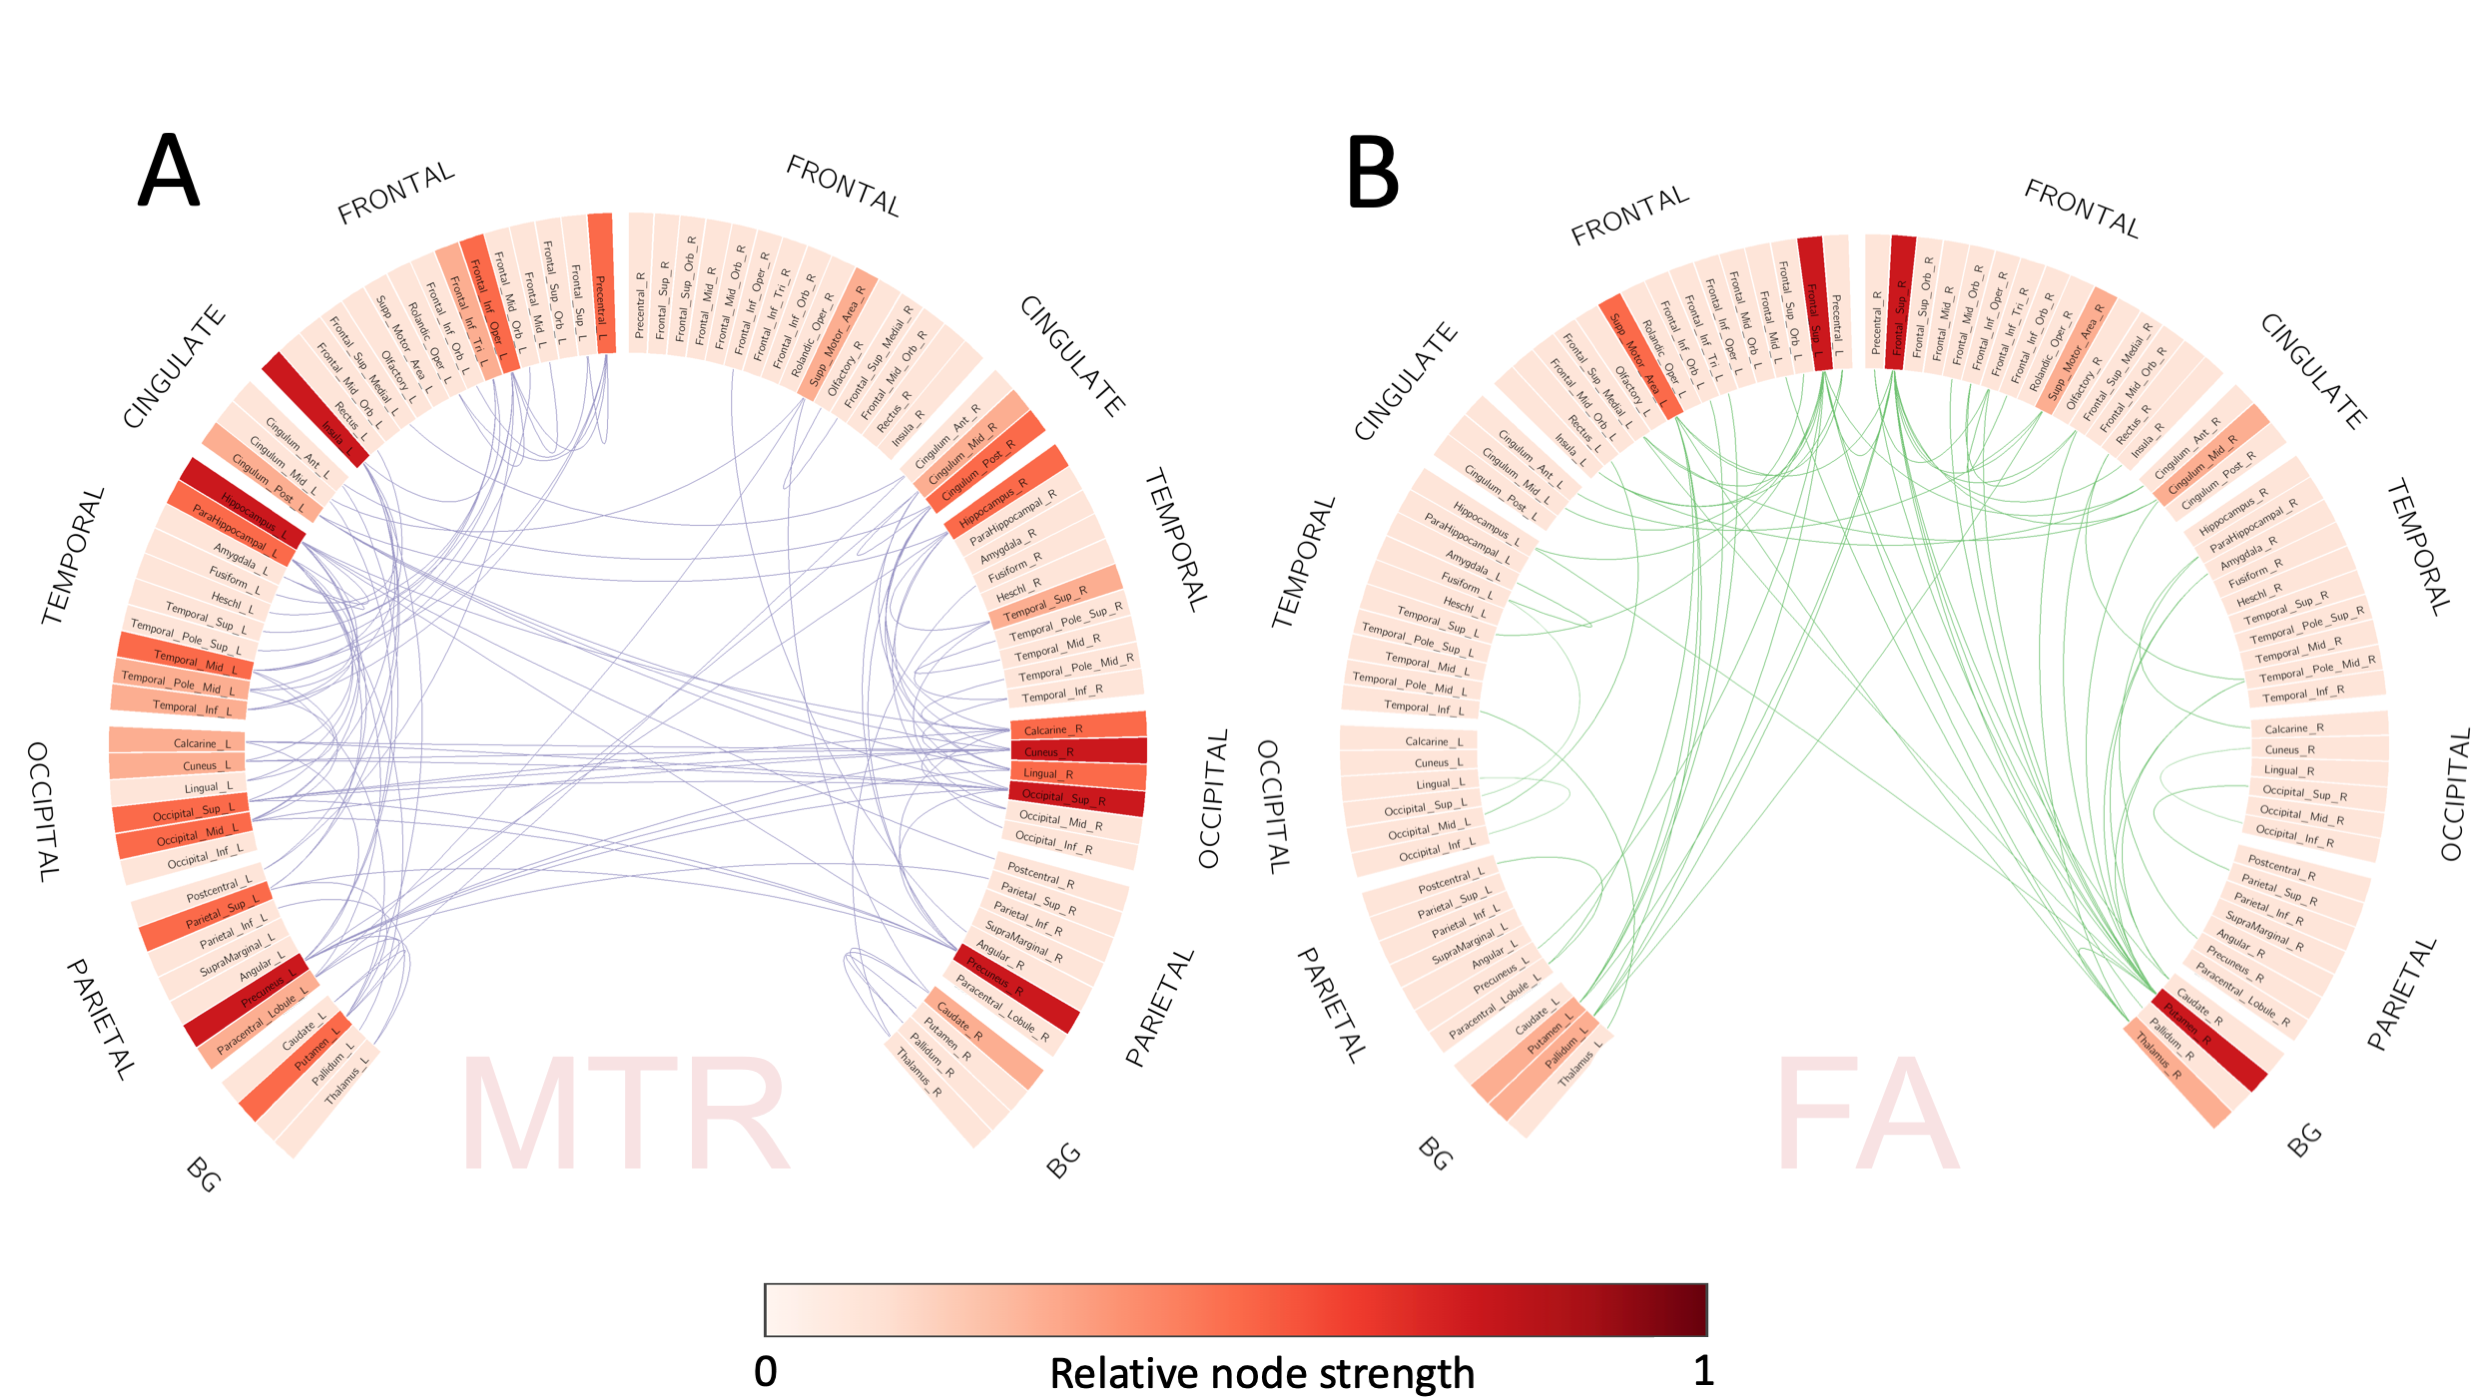
For both connectomes MS mostly affected the highly connected (hub) regions such as Precuneus, Superior Parietal gyrus, Superior Occipital gyrus8 (Figure 2). After the PLS analysis, we characterized the differences between the MTR and FA-weighted connectomes. The MTR-weighted connectome identified 549 connections where there is a reliable difference between MS and HC subjects (Figure 2A). The FA-weighted connectome identified 511 connections (Figure 2B). More than three-quarters of these connections are shared between the MTR- and the FA-weighted connectome, but Figure 3 shows which connections are unique to each of the connectomes.Discussion & Conclusion
In this study, we demonstrate that the MTR-weighted connectome is different than the FA-weighted connectome. The MTR-weighted connectome identified more connections between regions involved in the processing of various functions, mainly visual, motor, and cognitive functions9. On the other hand, the FA-weighted connectome identified more connections mainly between the basal ganglia and the frontal cortex that are mostly linked to motor function10. Some of these differences might be due to the underlying fiber organization that alters the FA along a tract, while keeping the MTR relatively constant. To make sense of these differences, we plan to conduct a more comprehensive analysis that includes the patients’ disability scores and a network dynamics model that can increase specificity to the conduction delays in the MTR-weighted connectome.Acknowledgements
No acknowledgement found.References
- Mancini M, et al. Introducing axonal myelination in connectomics: A preliminary analysis of g-ratio distribution in healthy subjects. NeuroImage 182 (2018): 351-359.
- van den Heuvel M.P., et al. Aberrant frontal and temporal complex network structure in schizophrenia: a graph theoretical analysis. Journal of Neuroscience 30.47 (2010): 15915-15926.
- Schmidt P, et al. An automated tool for detection of FLAIR-hyperintense white-matter lesions in multiple sclerosis. Neuroimage 59.4 (2012): 3774-3783.
- Yeh, Fang-Cheng, et al. Deterministic diffusion fiber tracking improved by quantitative anisotropy. PloS one 8.11 (2013): e80713.
- McIntosh A.R., and Lobaugh N.J. Partial least squares analysis of neuroimaging data: applications and advances. Neuroimage 23 (2004): S250-S263.
- Mišić B, et al. Network-level structure-function relationships in human neocortex. Cerebral Cortex 26.7 (2016): 3285-3296.
- Mišić B, et al. Post-traumatic stress constrains the dynamic repertoire of neural activity. Journal of neuroscience 36.2 (2016): 419-431.
- Kwon H, et al. Scale-integrated Network Hubs of the White Matter Structural Network. Scientific reports 7.1 (2017): 2449.
- Fleischer V, et al. Graph theoretical framework of brain networks in multiple sclerosis: a review of concepts. Neuroscience (2017).
- Wen X, et al. The spatial pattern of basal ganglia network: A resting state fMRI study. Complex Medical Engineering (CME), 2012 ICME International Conference on. IEEE, 2012.
Figures