3313
Myelin imaging derived from quantitative parameter mapping1Tokushima University, Tokushima, Japan, 2Research & Development Group, Hitachi, Ltd., Tokyo, Japan, 3Kanazawa University, Kanazawa, Japan, 4Healthcare Business Unit, Hitachi, Ltd., Tokyo, Japan
Synopsis
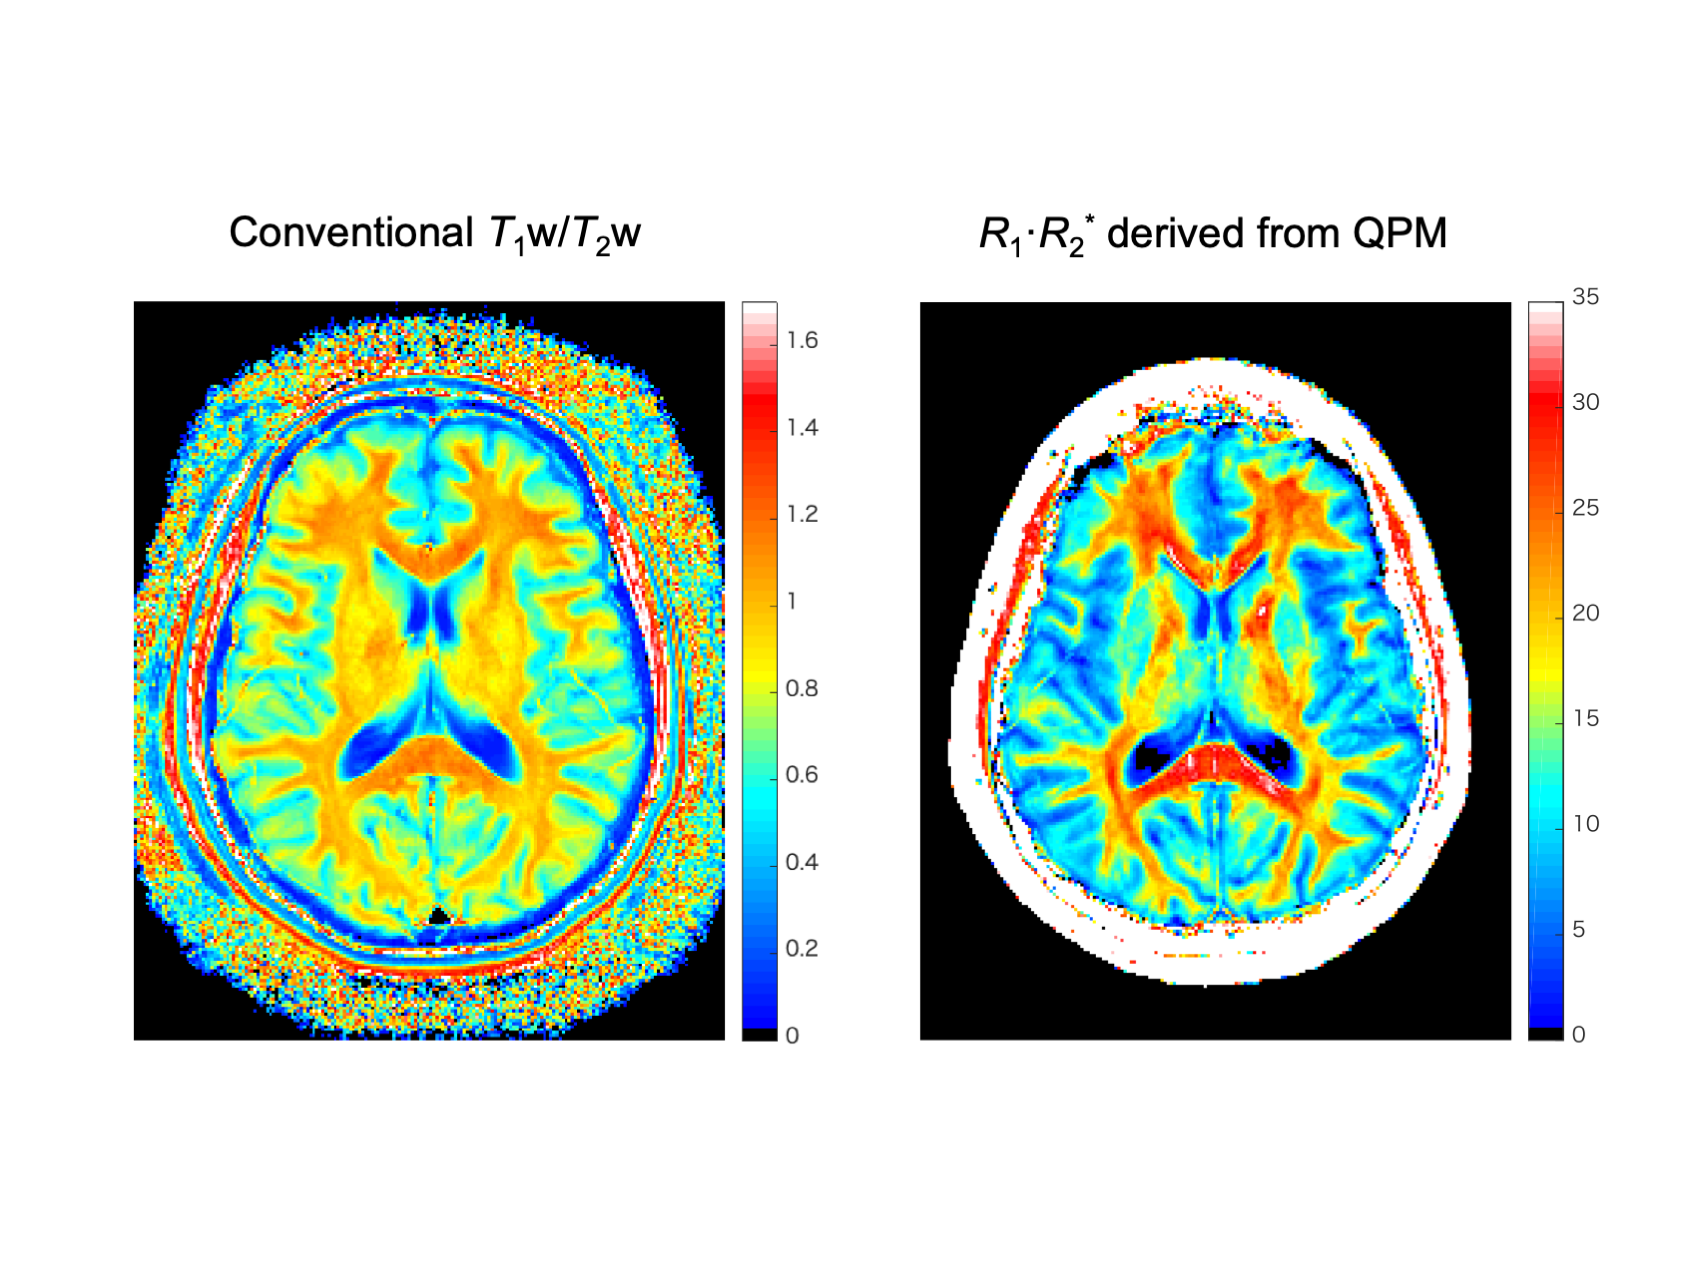
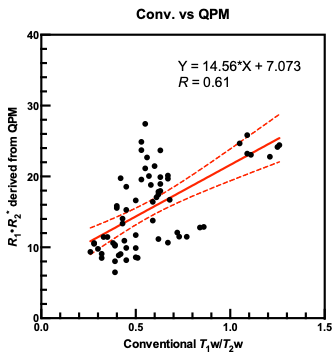
We developed a novel method which is applicable to visualize myelin component in the human brain using relaxation time derived from QPM-MRI. Our method demonstrated acknowledgement that the myelin content increased proportionally by times R1 and R2 in healthy volunteers. Linear regression analysis showed a strong and highly significant correlation between conventional T1w/T2w ratios and R1·R2* times derived from QPM (R = 0.61, P < 0.0001). In conclusion, our myelin mapping technique using QPM may replace conventional T1w/T2w ratio mapping and be expected to become independent of measurement conditions due to having quantitative characteristic of QPM itself.
Introduction
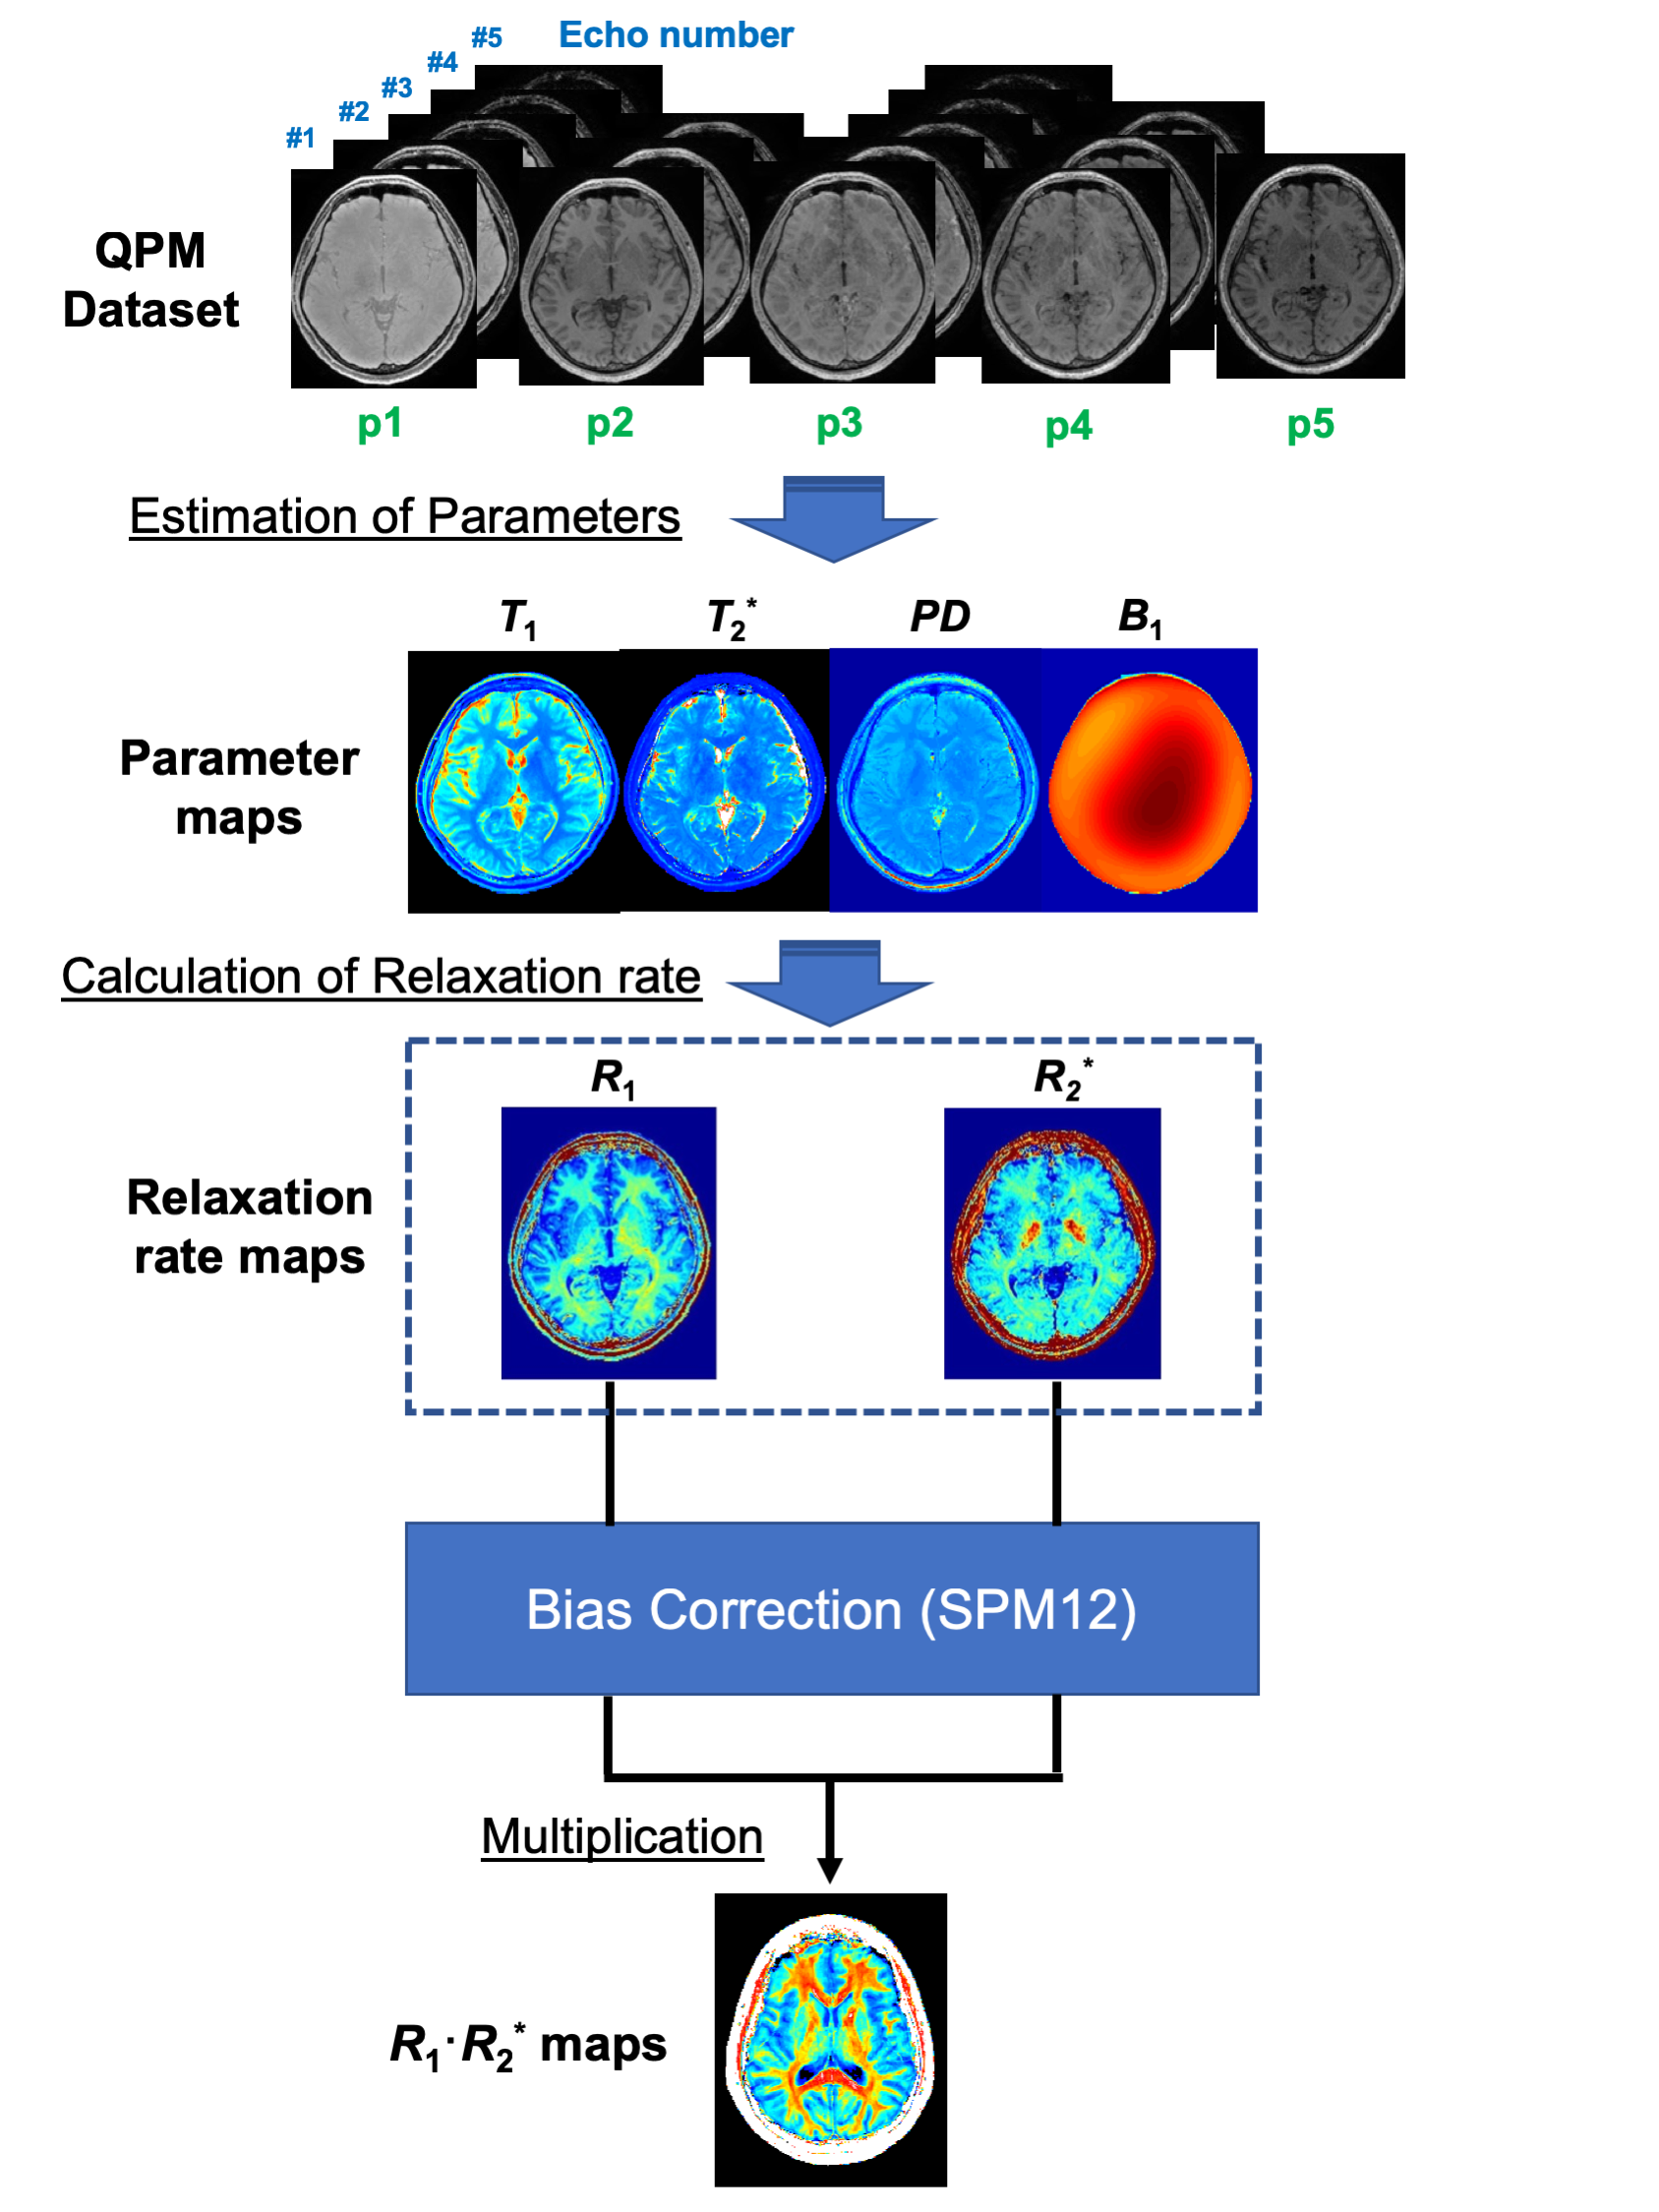
Myelin has an important function in the central and peripheral nerve system, of which increases the speed of nerve electric signal along the axons. The myelin exists in the white matter of human brain tissue and its degradation causes dysfunction. It is becoming important to measure myelin content for the diagnosis of neurodegenerative diseases, e.g., multiple sclerosis and dementia. Myelin detection using magnetic resonance imaging (MRI) has been reported elsewhere; multi-component analysis with T2 relaxation such as myelin water fraction (MWF) [1], diffusion tensor imaging (DTI) [2], and T1-weighted/T2-weighted (T1w/T2w) ratio mapping [3]. In particular, T1w/T2w ratio mapping is a simple method and widely used. However, differences in pulse sequence and imaging parameter become a part of the reason for systematic error [4]. Recently, quantitative parameter mapping (QPM) has been developed, which is one of the synthetic MRI techniques, and can make optimal multi-contrast images derived from the following estimation parameters: T1, T2*, B1, and proton density (PD) [5]. If the myelin-dependent physical parameters can be derived from QPM, quantitative myelin mapping will be easily installed to the clinical equipment. The aim of our study is to develop a novel method applicable to myelin component mapping in the human brain using relaxation time derived from QPM-MRI.Materials and Methods
Signals of T1w and T2w images are described as follows:
$$T_{1}w\approx\frac{1}{T_{1}}PD,$$
$$T_{2}w\approx T_{2}PD\approx T_{2}^{*}PD.$$
Based on the well-known parameter of T1w/T2w ratio method [4], we modified the descriptions using relaxation rate R1 and R2* as follows:
$$\frac{T_{1}w}{T_{2}w}\approx \frac{\frac{1}{T_{1}}PD}{T_{2}^{*}PD}\approx \frac{R_{1}}{\frac{1}{R_{2}^{*}}} = R_{1}R_{2}^{*}.$$
It means that myelin content increases by times R1 and R2*.
A schematic diagram of the QPM-myelin mapping procedure is shown in Fig.1. In order to verify our method, the following experiment was performed. On a 3 Tesla MR scanner system (Hitachi, Ltd., Tokyo, Japan), QPM-MR imaging was performed on healthy volunteers (five men; ages, 21-24 years; mean age, 22.5 years) using three-dimensional (3D) partially radio frequency-spoiled steady state gradient-echo (RSSG) methods. The imaging parameters were echo times 4.6-32.1 ms (∆TE, 4.6 or 6.9 ms); repetition times 10, 20 and 40 ms; flip angles 10, 25, 35, and 40 degrees; RF phases 2, 5, 8, 20 and 22. After QPM post processing (i.e., estimation of T1, T2*, PD, and B1 were generated from the QPM dataset), the QPM-relaxation rates (R1 and R2*) were derived. Moreover, to compare with QPM, we acquired conventional MRI datasets, e.g., 3D-RSSG-T1w and 3D-fast spin-echo-T2w images. Next, a bias correction for each relaxation rate and magnitude images was applied with SPM12. After bias correction, R1·R2* and T1w/T2w ratio maps were generated . Then, region of interest analysis was performed on each relaxation map on the white matter structures (anterior corona radiata, genu of corpus callosum, cerebral peduncle, and posterior limb of internal capsule) and the grey matter structures (caudate nucleus, putamen, and posterior cingulate cortex).
Results and Discussions
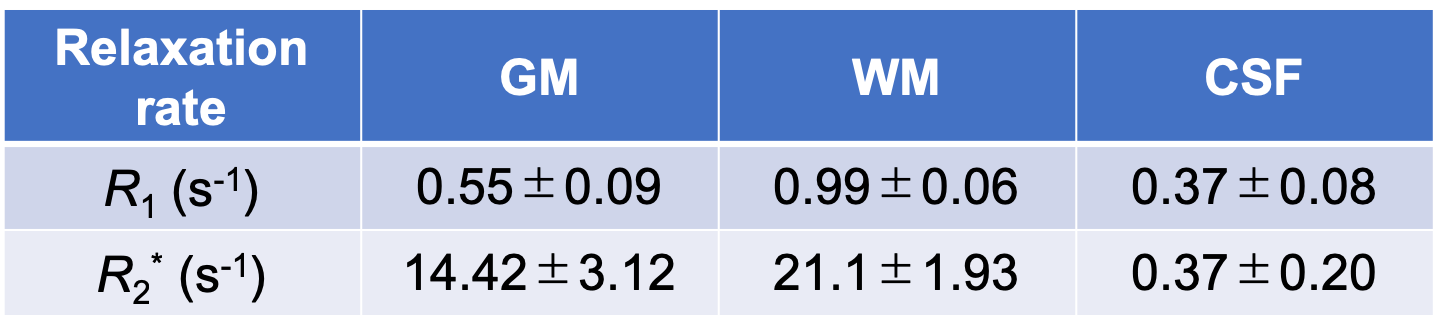
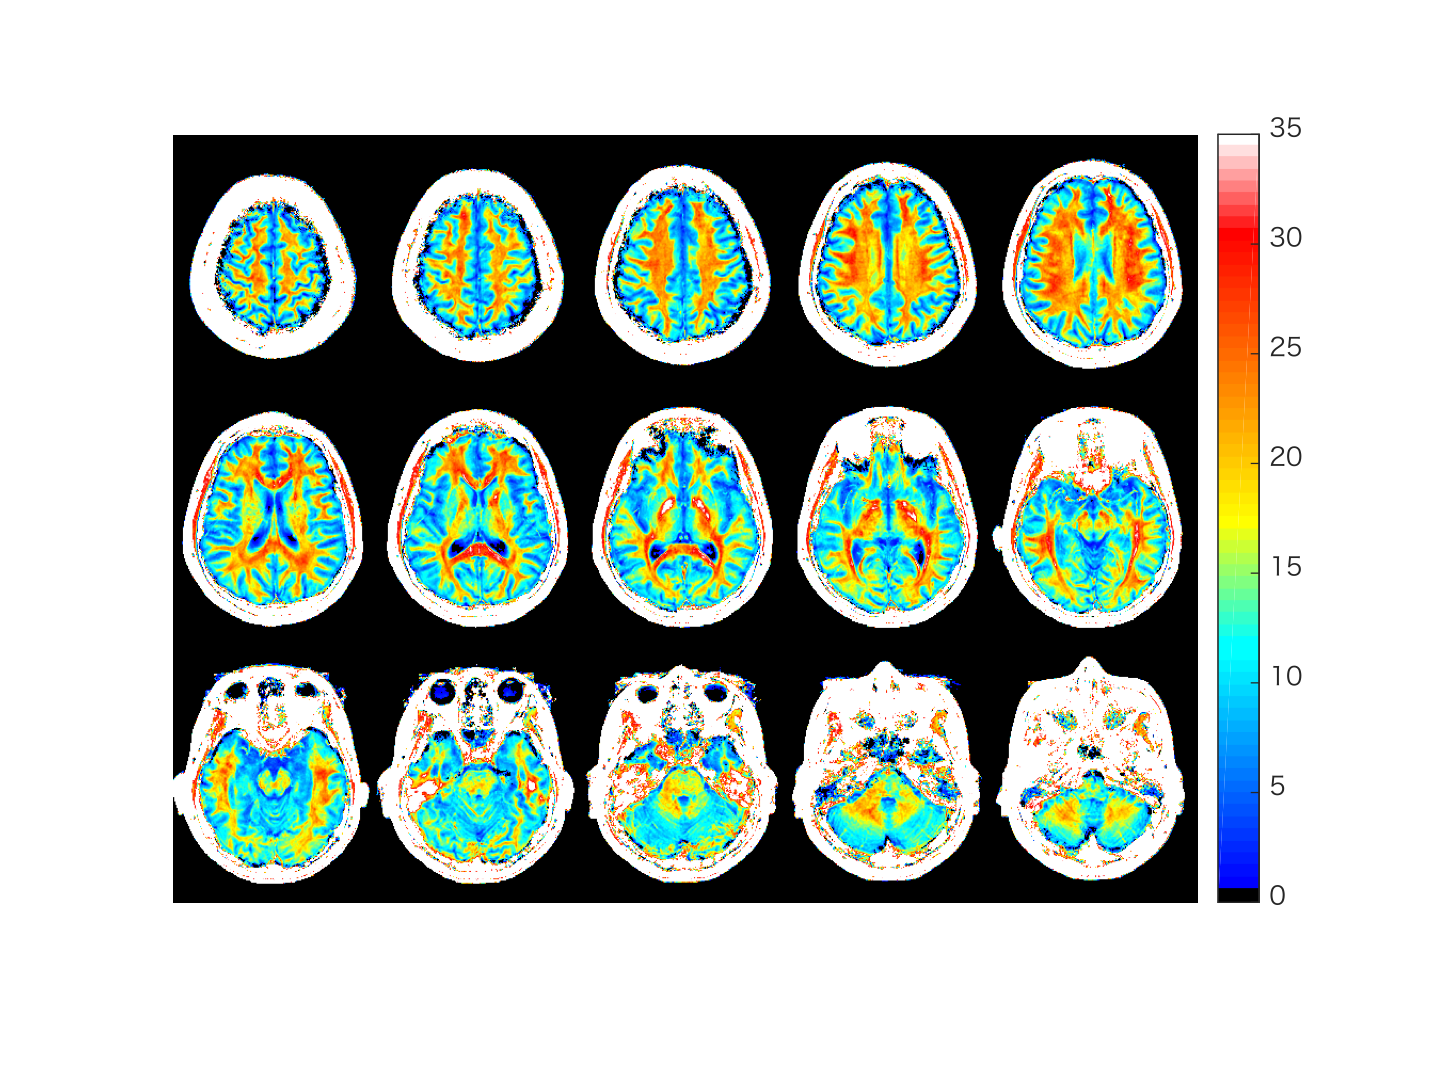
Table 1 summarizes the mean measurement values of R1 and R2* in the gray matter, white matter, and cerebrospinal fluid in healthy subjects. Figure 2 shows myelin maps of a representative subject. Figure 3 shows R1·R2* maps derived from QPM of the whole brain of a representative subject. Figure 4 shows the relationship between conventional T1w/T2w ratio values and R1·R2* values derived from QPM across all five bilateral structures. Linear regression analysis shows a significant correlation between conventional T1w/T2w ratio values and R1·R2* values derived from QPM (Fig. 4; R = 0.61, P < 0.0001). Because the quality of the tissue parameter maps obtained by QPM was independent of the systematic error unlike the conventional T1w/T2w mapping, myelin maps derived from QPM can maintain high quality and the values are acquired quantitatively.Conclusion
QPM myelin mapping may replace conventional T1w/T2w ratio mapping and be expected to become independent of measurement conditions due to having quantitative characteristic of QPM itself.Acknowledgements
No acknowledgement found.References
- Fujiyoshi K, Hikishima K, Nakahara J, et al. Application of q-Space Diffusion MRI for the Visualization of White Matter. J Neurosci. 2016;36(9):2796-808.
- Sheth V, Shao H, Chen J, et al. Magnetic resonance imaging of myelin using ultrashort Echo time (UTE) pulse sequences: Phantom, specimen, volunteer and multiple sclerosis patient studies. Neuroimage. 2016;136:37-44.
- Glasser MF, Van Essen DC. Mapping human cortical areas in vivo based on myelin content as revealed by T1- and T2-weighted MRI. J Neurosci. 2011;31(32):11597-616.
- Uddin MN, Figley TD, Figley CR. Effect of echo time and T2-weighting on GRASE-based T1w/T2w ratio measurements at 3T. Magn Reson Imaging. 2018;51:35-43.
- Taniguchi Y, Yokosawa S, Shirai T, et al. Proceedings of the 26th Annual Meeting of ISMRM. 2018; 5630.
Figures