3312
Myelin-sensitive indices in multiple sclerosis: the unseen qualities of qualitative clinical MRI1Queen Square MS Centre, Department of Neuroinflammation, UCL Queen Square Institute of Neurology, Faculty of Brain Sciences, University College London, London, United Kingdom, 2Centre for Medical Image Computing (CMIC), Department of Medical Physics and Biomedical Engineering, University College London, London, United Kingdom, 3Centre for Medical Image Computing (CMIC), Department of Computer Science, University College London, London, United Kingdom, 4Universitat Oberta de Catalunya, Barcelona, Spain, 5National Institute for Health Research (NIHR), University College London Hospital (UCLH) Biomedical Research Center, London, United Kingdom, 6Department of Brain and Behavioral Sciences, University of Pavia, Pavia, Italy, 7Brain MRI 3T Research Center, IRCCS Mondino Foundation, Pavia, Italy
Synopsis
Specialised quantitative MRI techniques, while considered state-of-the-art for quantitative studies, increase acquisition times and costs. On the other hand, clinical techniques routinely added to every MR-protocol are dismissed from quantitative analyses because labelled as qualitative. In this study, macromolecular tissue volume (MTV) and T1-/T2-weighted ratio (T1w/T2w) maps extracted from clinical images were compared with magnetisation transfer ratio (MTR, gold standard for myelin mapping) to assess whether clinical scans can also be used for myelin mapping in multiple sclerosis. Good correlation and similar sensitivity to disease were observed for both comparisons, with MTV appearing overall more reliable than T1w/T2w when compared with MTR.
Introduction
Multiple sclerosis (MS) is an immune-mediated neurological disease affecting myelin in the central nervous system. With the rising number of specialised quantitative MR-sequences to investigate demyelination1 and the growing interest towards multi-modal, big-data approaches, it has become imperative to assess which modalities justify increased acquisition times and costs for their added values. On the other hand, simpler modalities acquired routinely for clinical assessment are dismissed because they are traditionally labelled as qualitative. Therefore, it is key to assess whether mathematical calculations allow clinical scans to be exploited for indices sensitive to myelin. In this study, macromolecular tissue volume (MTV) and T1-/T2-weighted ratio (T1w/T2w) maps, useful for brain myelin mapping2,3, were extracted from clinical PD-,T2-,T1-weighted images and compared with dedicated magnetisation transfer ratio (MTR) maps on healthy controls (HC) and MS patients, to assess whether clinical scans can be a surrogate for myelin imaging.Methods
Subjects and MR-acquisition: The cohort is composed of 63 HC and 185 MS patients with different disease subtypes. The clinical scans include a PD-/T2-weighted turbo spin-echo (TE=19/85ms, TR=3.5s, 1x1x3mm3, 4:01’) and a T1-weighted spin-echo (TE=10ms, TR=625ms, 1x1x3mm3, 5:43’). MTR data include two 3D gradient-echo (TE=2.4ms, TR=30ms, 1x1x1mm3, ~12:30’), with and without a MT saturation pulse (~25:00’ total). All images were acquired on a 3T Philips Achieva MR system.
Data analysis: Lesions were manually traced by a clinical expert on the T2-weighted images. Quantitative PD,T2,T1 maps were extracted from clinical images by solving the associated Bloch equations4:
$$S_{PD}=PD(1-e^{-TR_1/T_1})e^{-TE_1/T_2}\\S_{T2}=PD(1-e^{-TR_1/T_1})e^{-TE_2/T_2}\\S_{T1}=PD(1-e^{-TR_2/T_1})e^{-TE_3/T_2}$$
where $$$S_{PD},S_{T2},S_{T1}$$$ represent PD-,T2-,T1-weighted signals. Receiver bias field correction was performed on the PD maps as described by Volz 20125. MTV maps were then calculated as MTV=1-PD. T1w/T2w maps were produced by dividing the T1- by the T2-weighted scan voxel-wise. MTR maps were calculated by normalising the image with MT-weighting by the one without. All images were non-linearly registered to MNI space6 (resolution 2x2x2mm3)(Fig.1).
Comparison: Within-subject correlation between modalities was tested by calculating, for each subject, the median value of MTV and T1w/T2w in normal-appearing white matter (NAWM) and grey matter (GM)7, and comparing it with MTR (Fig.2). Across-subjects comparisons were performed by running a t-test between the HC and MS groups using the median values for each modality (Fig.3). Voxel-wise t-test between the two groups was also performed using the maps in MNI space, excluding voxels within lesions (Fig.4). Mutual information (MI) between modalities was then calculated by comparing MTV and T1w/T2w values voxel-wise across subjects with MTR, excluding lesions. A reference MI map between MTR and itself was calculated to spatially normalise the previous two between 0 and 1(Fig.5).
Results
Within-subject comparisons showed good correlation, with MTR being more strongly correlated with MTV than T1w/T2w (Fig.2). Differences in regional values between HC and MS patients appeared to be significant for all modalities except T1w/T2w in GM (Fig.3). Voxel-wise significant t-statistics maps showed similar patterns for all modalities, while no or few voxels survived the testing when using T1- or T2-weighted images only (Fig.4). MI maps showed uniform MI-values in NAWM and deep GM for both MTV-MTR and T1w/T2w-MTR comparisons, with higher values in cortical GM and cerebrospinal fluid (CSF), and overall higher MI-scores when comparing MTR with MTV(Fig.5).Discussion
Regional MTV values showed the strongest correlation with MTR and appeared to be better than T1w/T2w at discriminating between HC and MS patients in GM. When testing for differences between the two groups voxel-wise, similar significant t-statistics patterns were observed in the corpus callosum and periventricular region in all three modalities, with MTV and T1w/T2w showing more widespread alterations than MTR, which seems to suggest a higher sensitivity to the disease. Since no significant alterations were observed instead when testing on T1-weighted images, and only few voxels survived the test when using T2-weighted images, it is reasonable to assume that these results are not an artifact of non-linear registration.
The overall higher MI-values observed when comparing MTR with MTV suggest that MTR shares a higher degree of information with MTV than T1w/T2w. The uniform distribution of MI in NAWM and deep GM confirms that the information shared with MTR across subjects is not spatially dependent. The higher MI-values observed in cortical GM in the MTV-MTR comparison are most likely due to partial volume effects with CSF.
Conclusion
MR-indices, such as MTV, derived from clinical scans offer sensitivity to brain myelin content comparably to the well established MTR imaging. While specialised sequences are still to be considered the gold standard for myelin imaging, this study suggests that clinical scans can also be used, allowing shorter protocols and enabling retrospective analyses of decades of acquisitions, which carry huge statistical power.Acknowledgements
This project has received funding from the European Union’s Horizon 2020 research and innovation programme under grant agreement No. 634541 (funding FG and AR) and No. 666992, and from the Engineering and Physical Sciences Research Council (EPSRC EP/R006032/1 and EP/M020533/1, funding FG), the UK Multiple Sclerosis Society (892/08 and 77/2018), the Department of Health’s National Institute for Health Research Biomedical Research Centres (BRC R&D03/10/RAG0449) and INSPIRED (Wings for Life, Spinal Research and Craig H Neilson Foundation).References
[1] Heath F, Hurley SA, Johansen-Berg H, Sampaio-Baptista C. Advances in noninvasive myelin imaging. Dev Neurobiol. 2017; 78(2): 136-151.
[2] Ganzetti M, Wenderoth N, Mantini D. Whole brain myelin mapping using T1- and T2-weighted MR imaging data. Front Hum Neurosci. 2014; 8:671.
[3] Mezer A, Yeatman JD, Stikov N, et al. Quantifying the local tissue volume and composition in individual brains with magnetic resonance imaging. Nat Med. 2013; 19(12): 1667-72.
[4] Anderson SW, Sakai O, Soto JA, Jara, H. Improved T2 mapping accuracy with dual-echo turbo spin echo: Effect of phase encoding profile orders. Magn Reson Med, 2013; 69: 137–143.
[5] Volz S, Nöth U, Jurcoane A, Ziemann U, Hattingen E, Deichmann R. Quantitative proton density mapping: correcting the receiver sensitivity bias via pseudo proton densities, NeuroImage. 2012; 63: 540-552.
[6] Fonov VS , Evans AC, Botteron K, Almli CR, McKinstry RC, Collins DL, BDCG. Unbiased average age-appropriate atlases for pediatric studies, NeuroImage,Volume 54, Issue 1, January 2011, ISSN 1053–8119.
[7] Cardoso, MJ, Wolz R, Modat M, Fox NC, Rueckert D, Ourselin S. Geodesic Information Flows: Spatially-Variant Graphs and Their Application to Segmentation and Fusion, IEEE Trans Med Imaging, 2015; 34(9): 1976–1988.
Figures
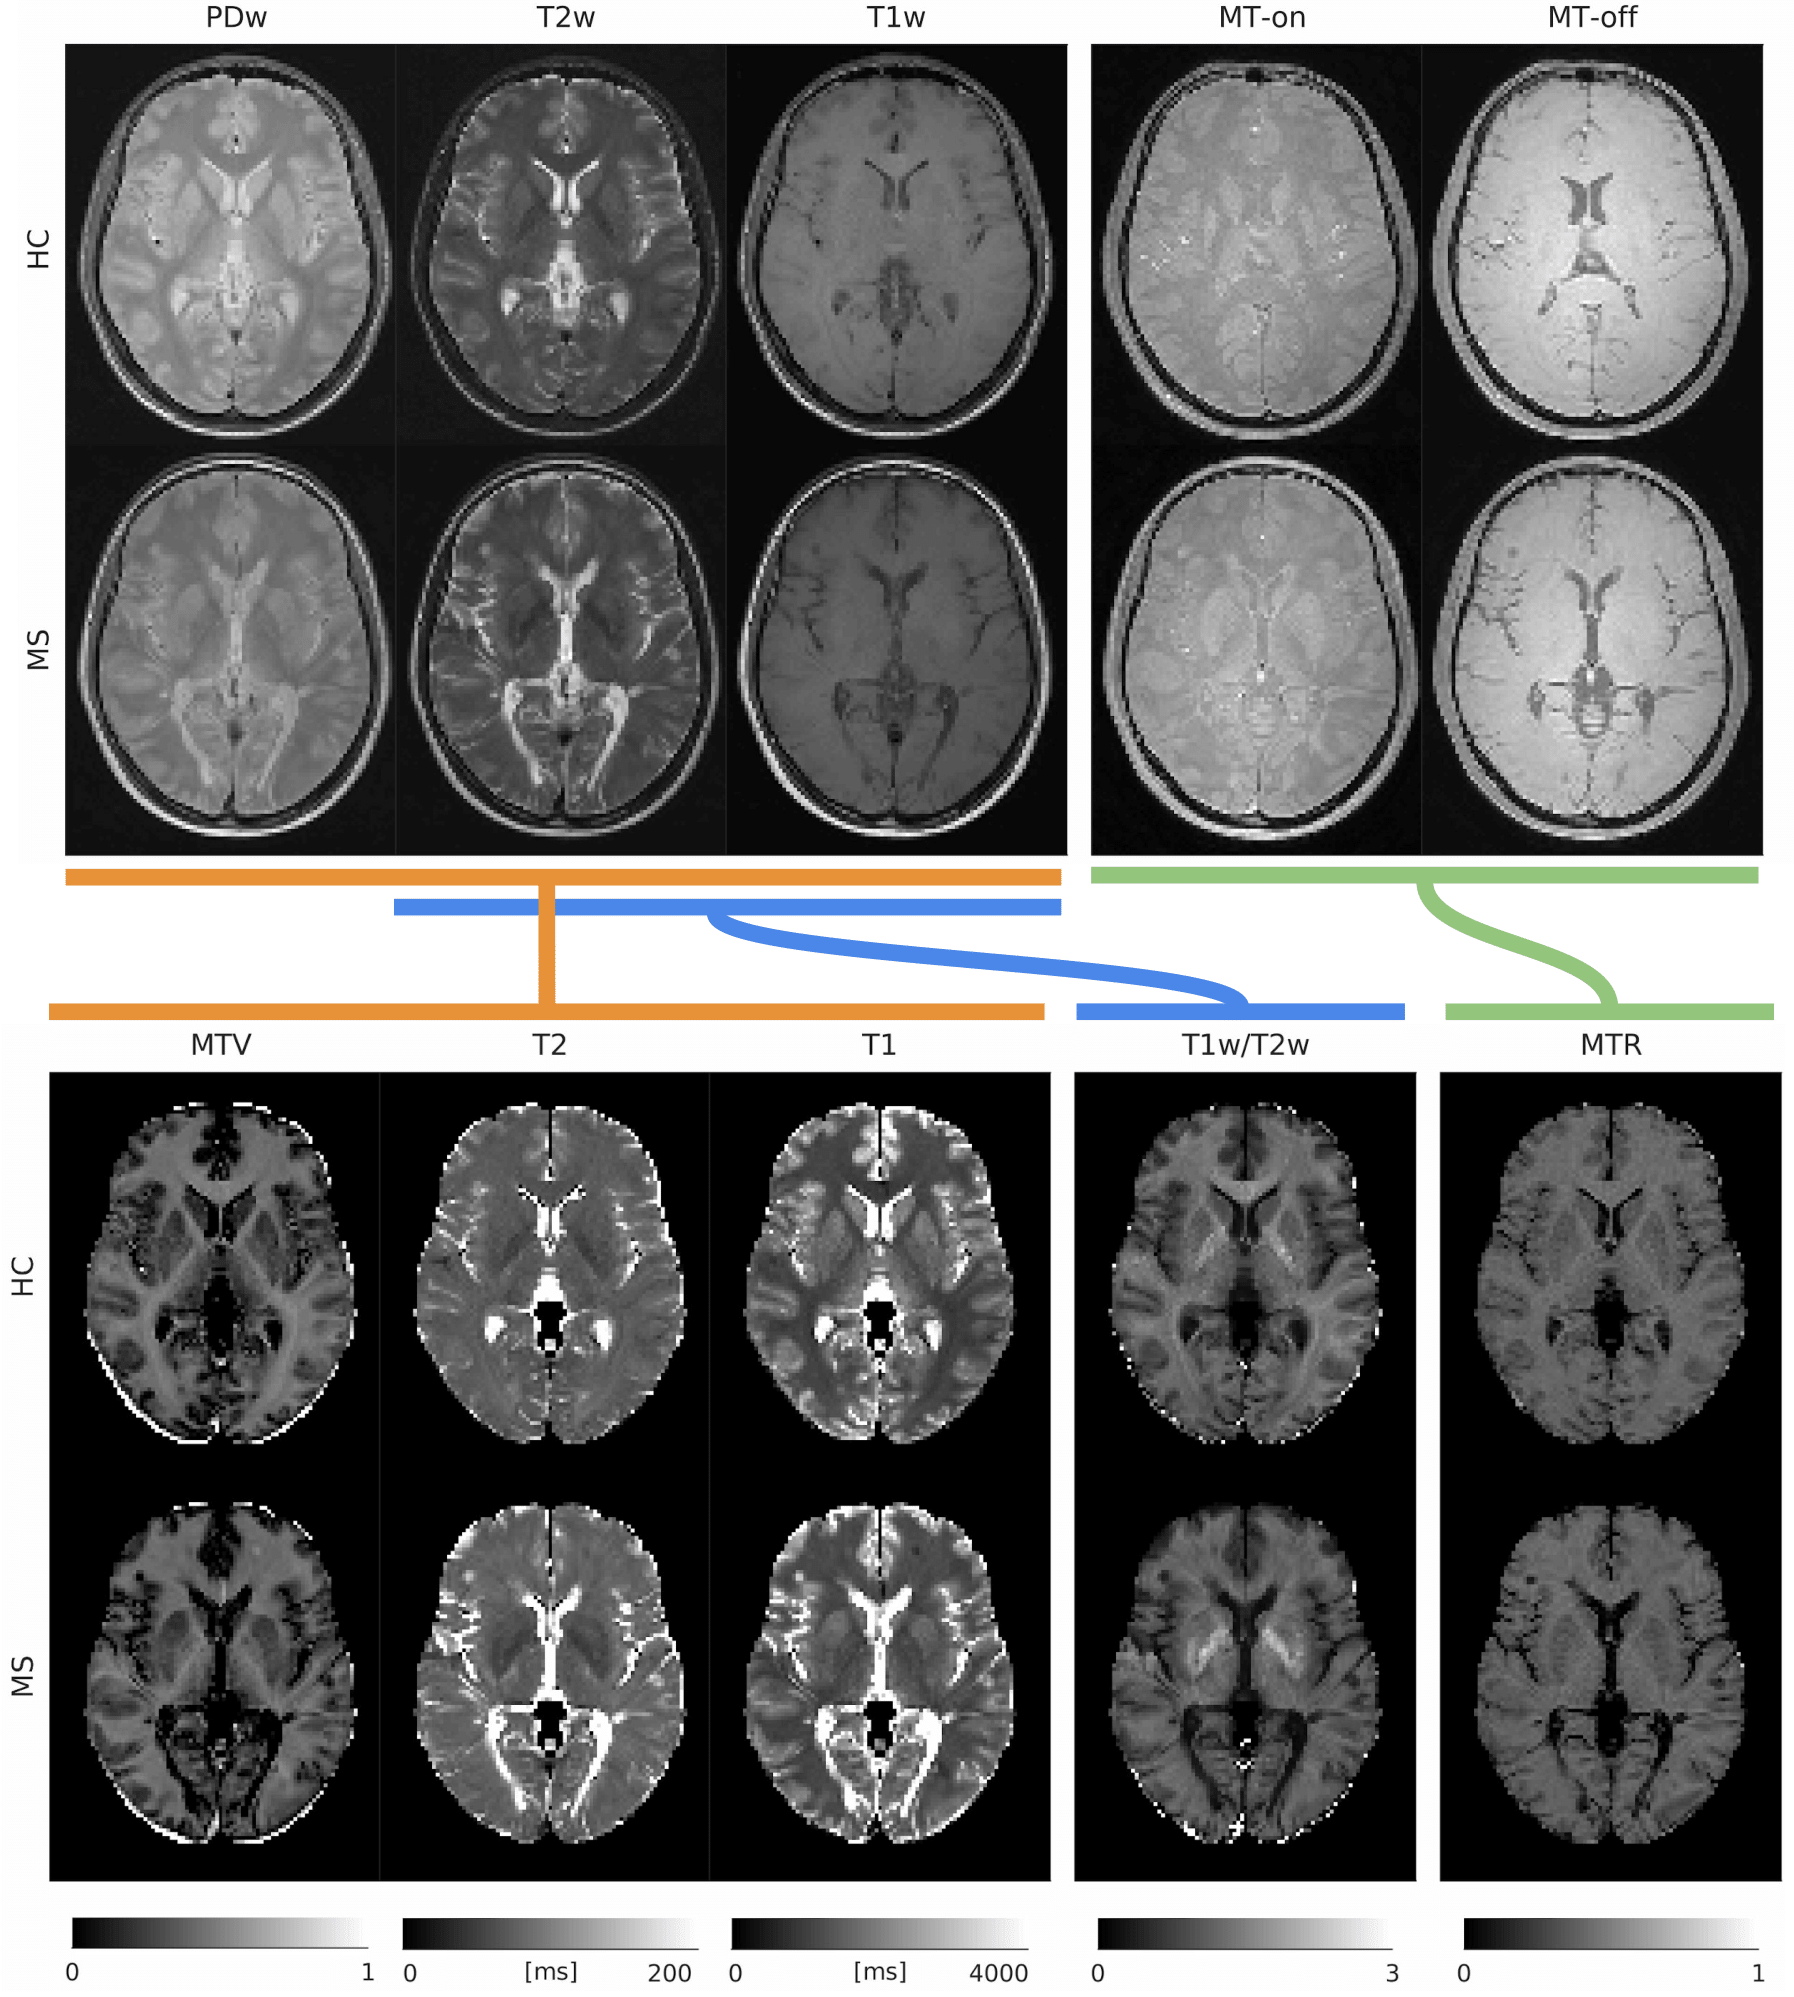
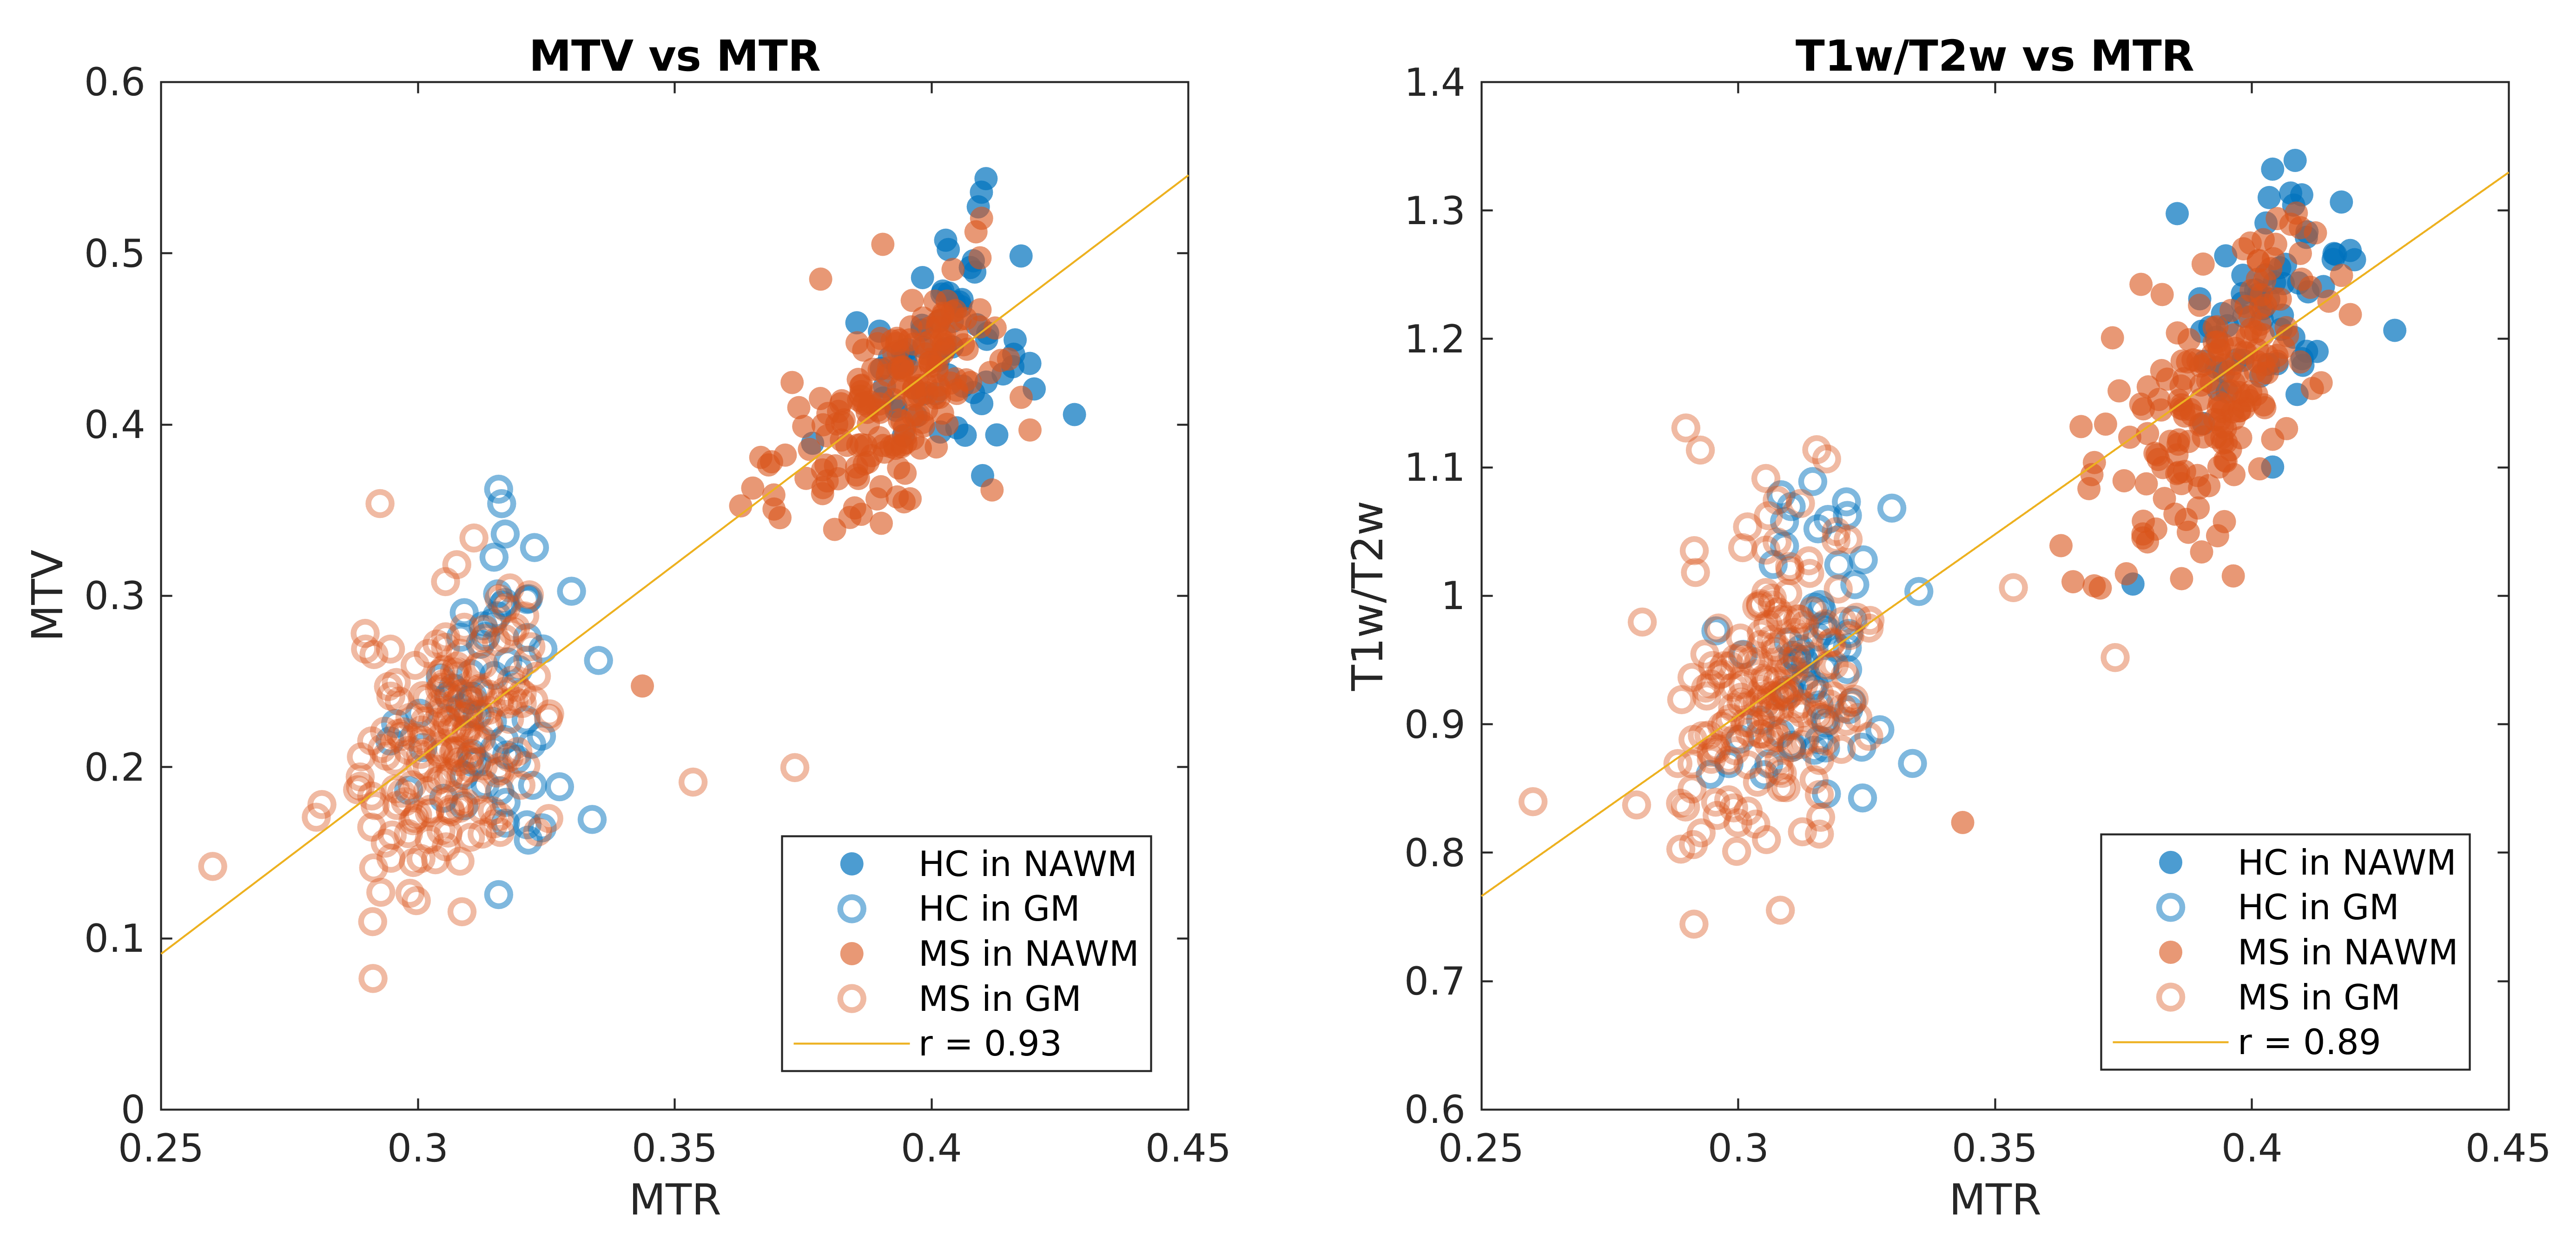
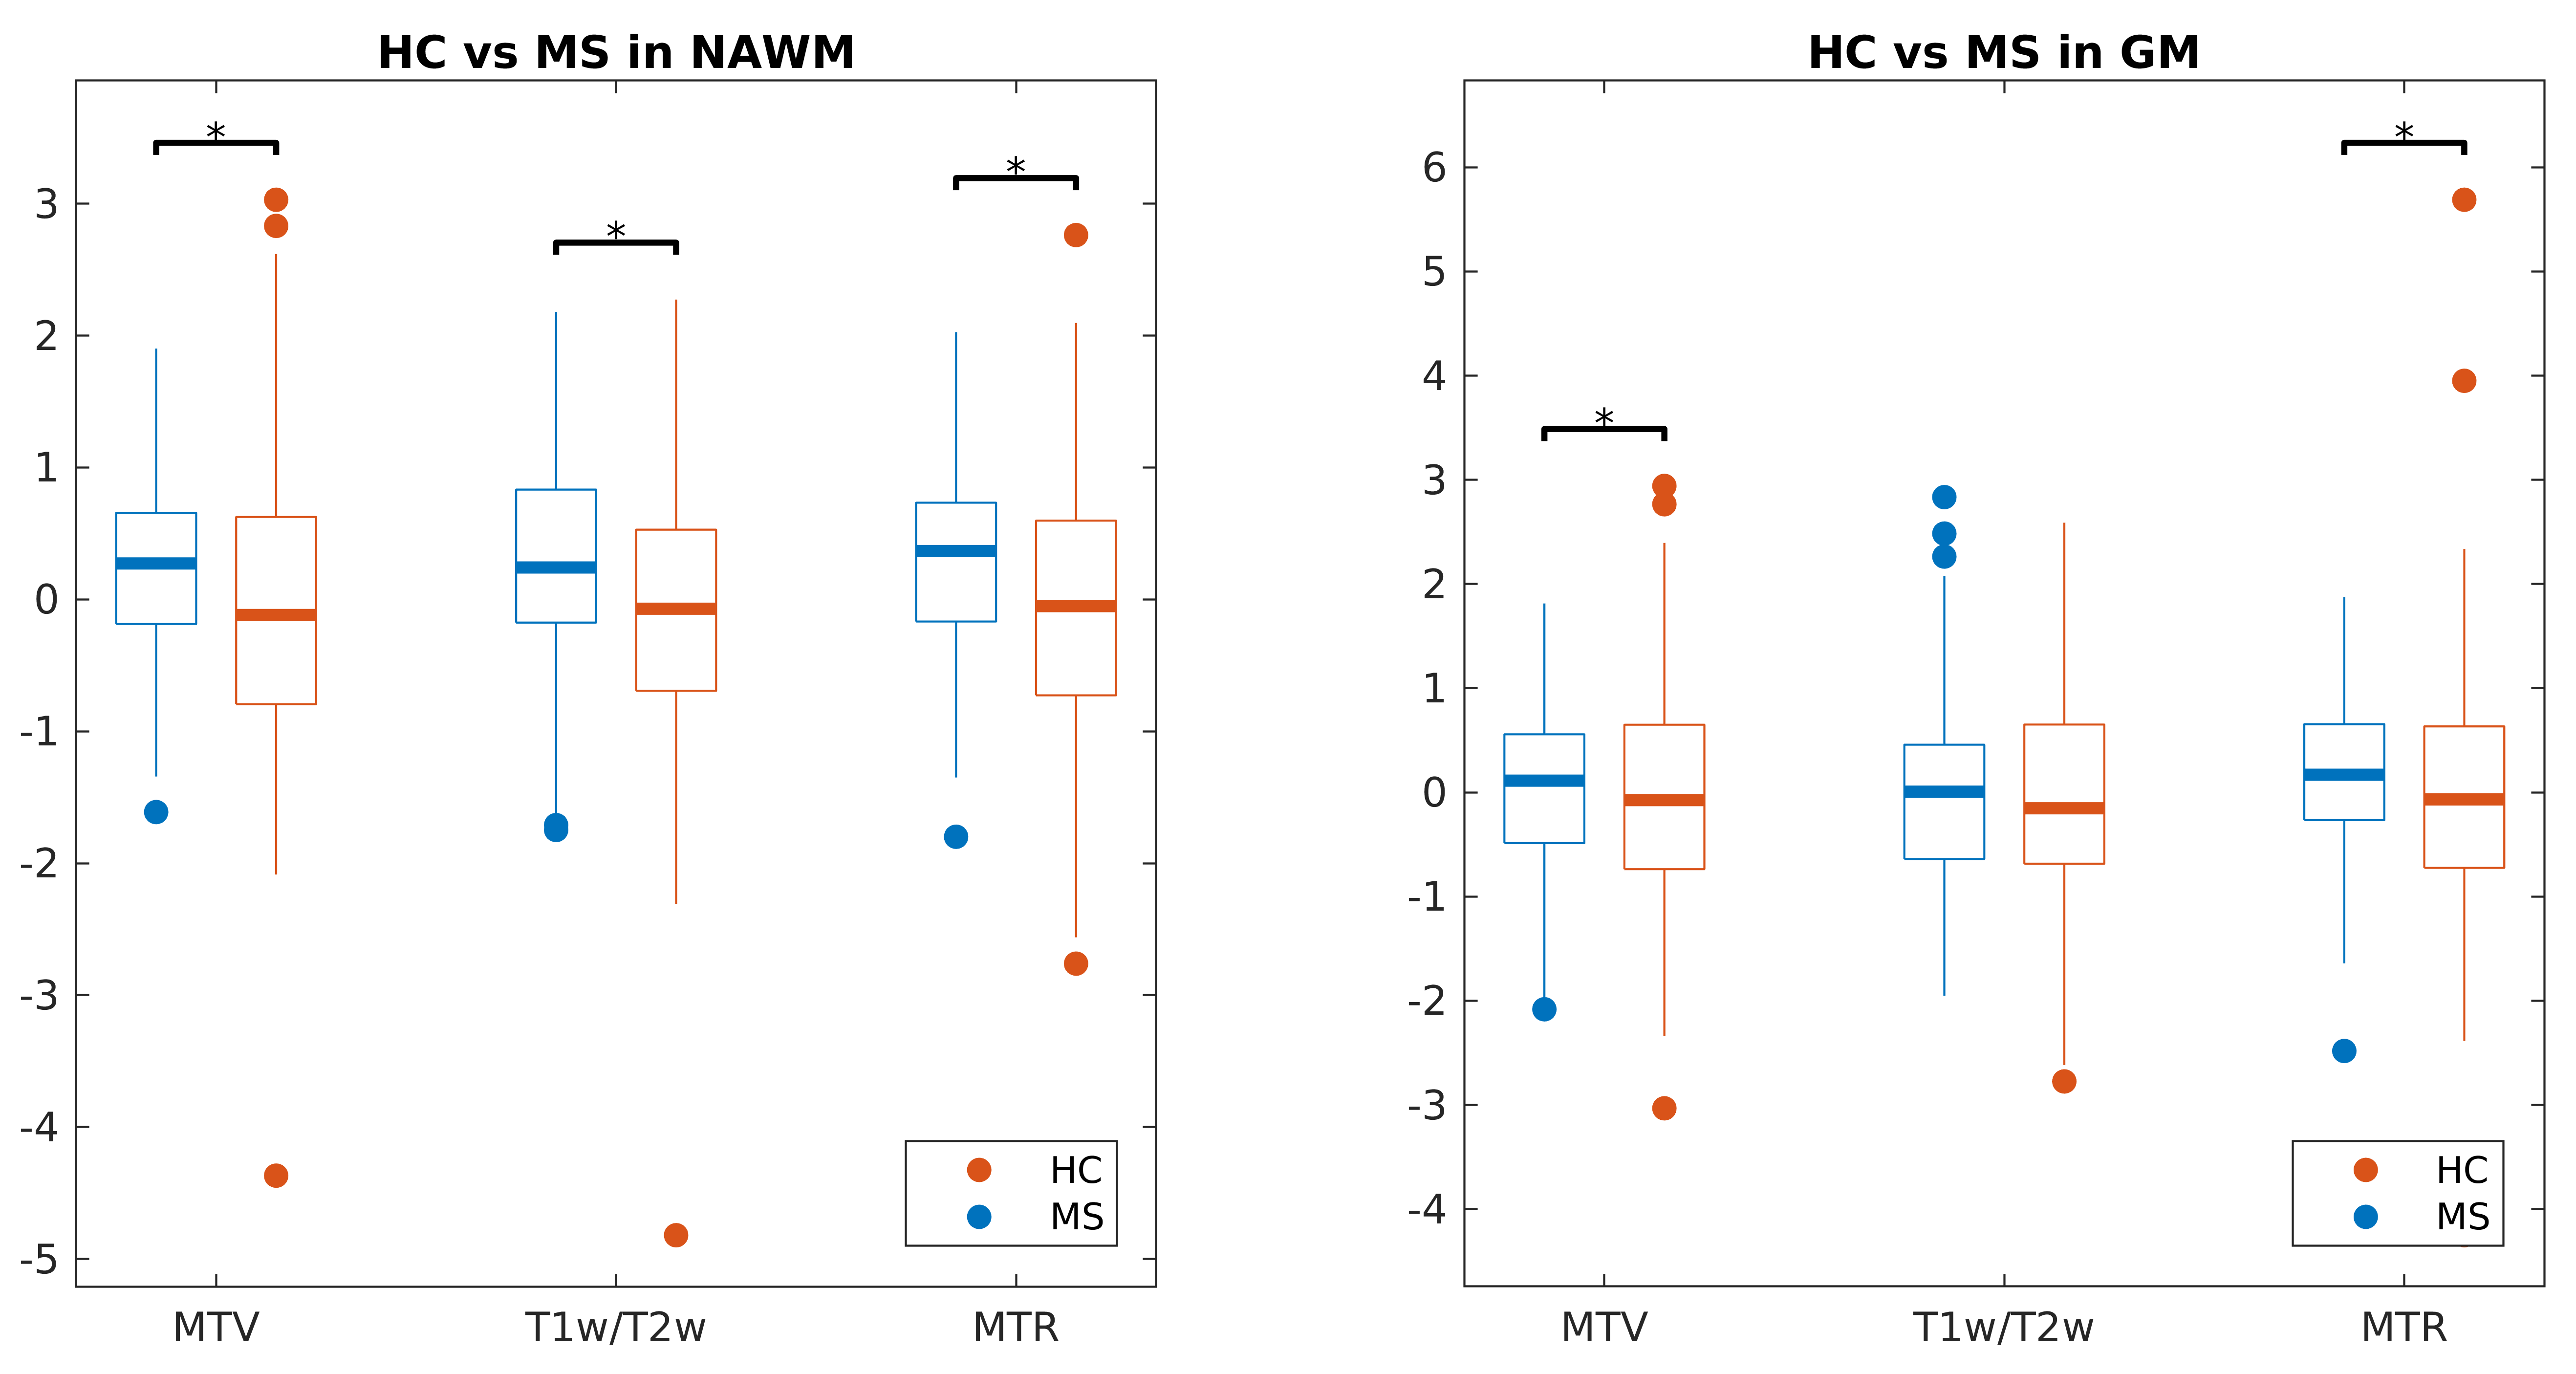
Figure 3. Results of the t-tests between HC and MS patients using regional median values. The boxplots show the distributions of the median values of MTV, T1w/T2w and MTR in NAWM and GM for HC and MS patients. The distributions have been standardised across subjects (mean=0, standard deviation=1).
MTV and MTR values show similar distributions for both HC and MS. After correcting for multiple comparisons using Bonferroni’s correction (p<0.05/n, n=6 comparisons, *=significantly different), all modalities showed significant differences in NAWM, while only MTV and MTR showed significant differences in GM (both deep and cortical).
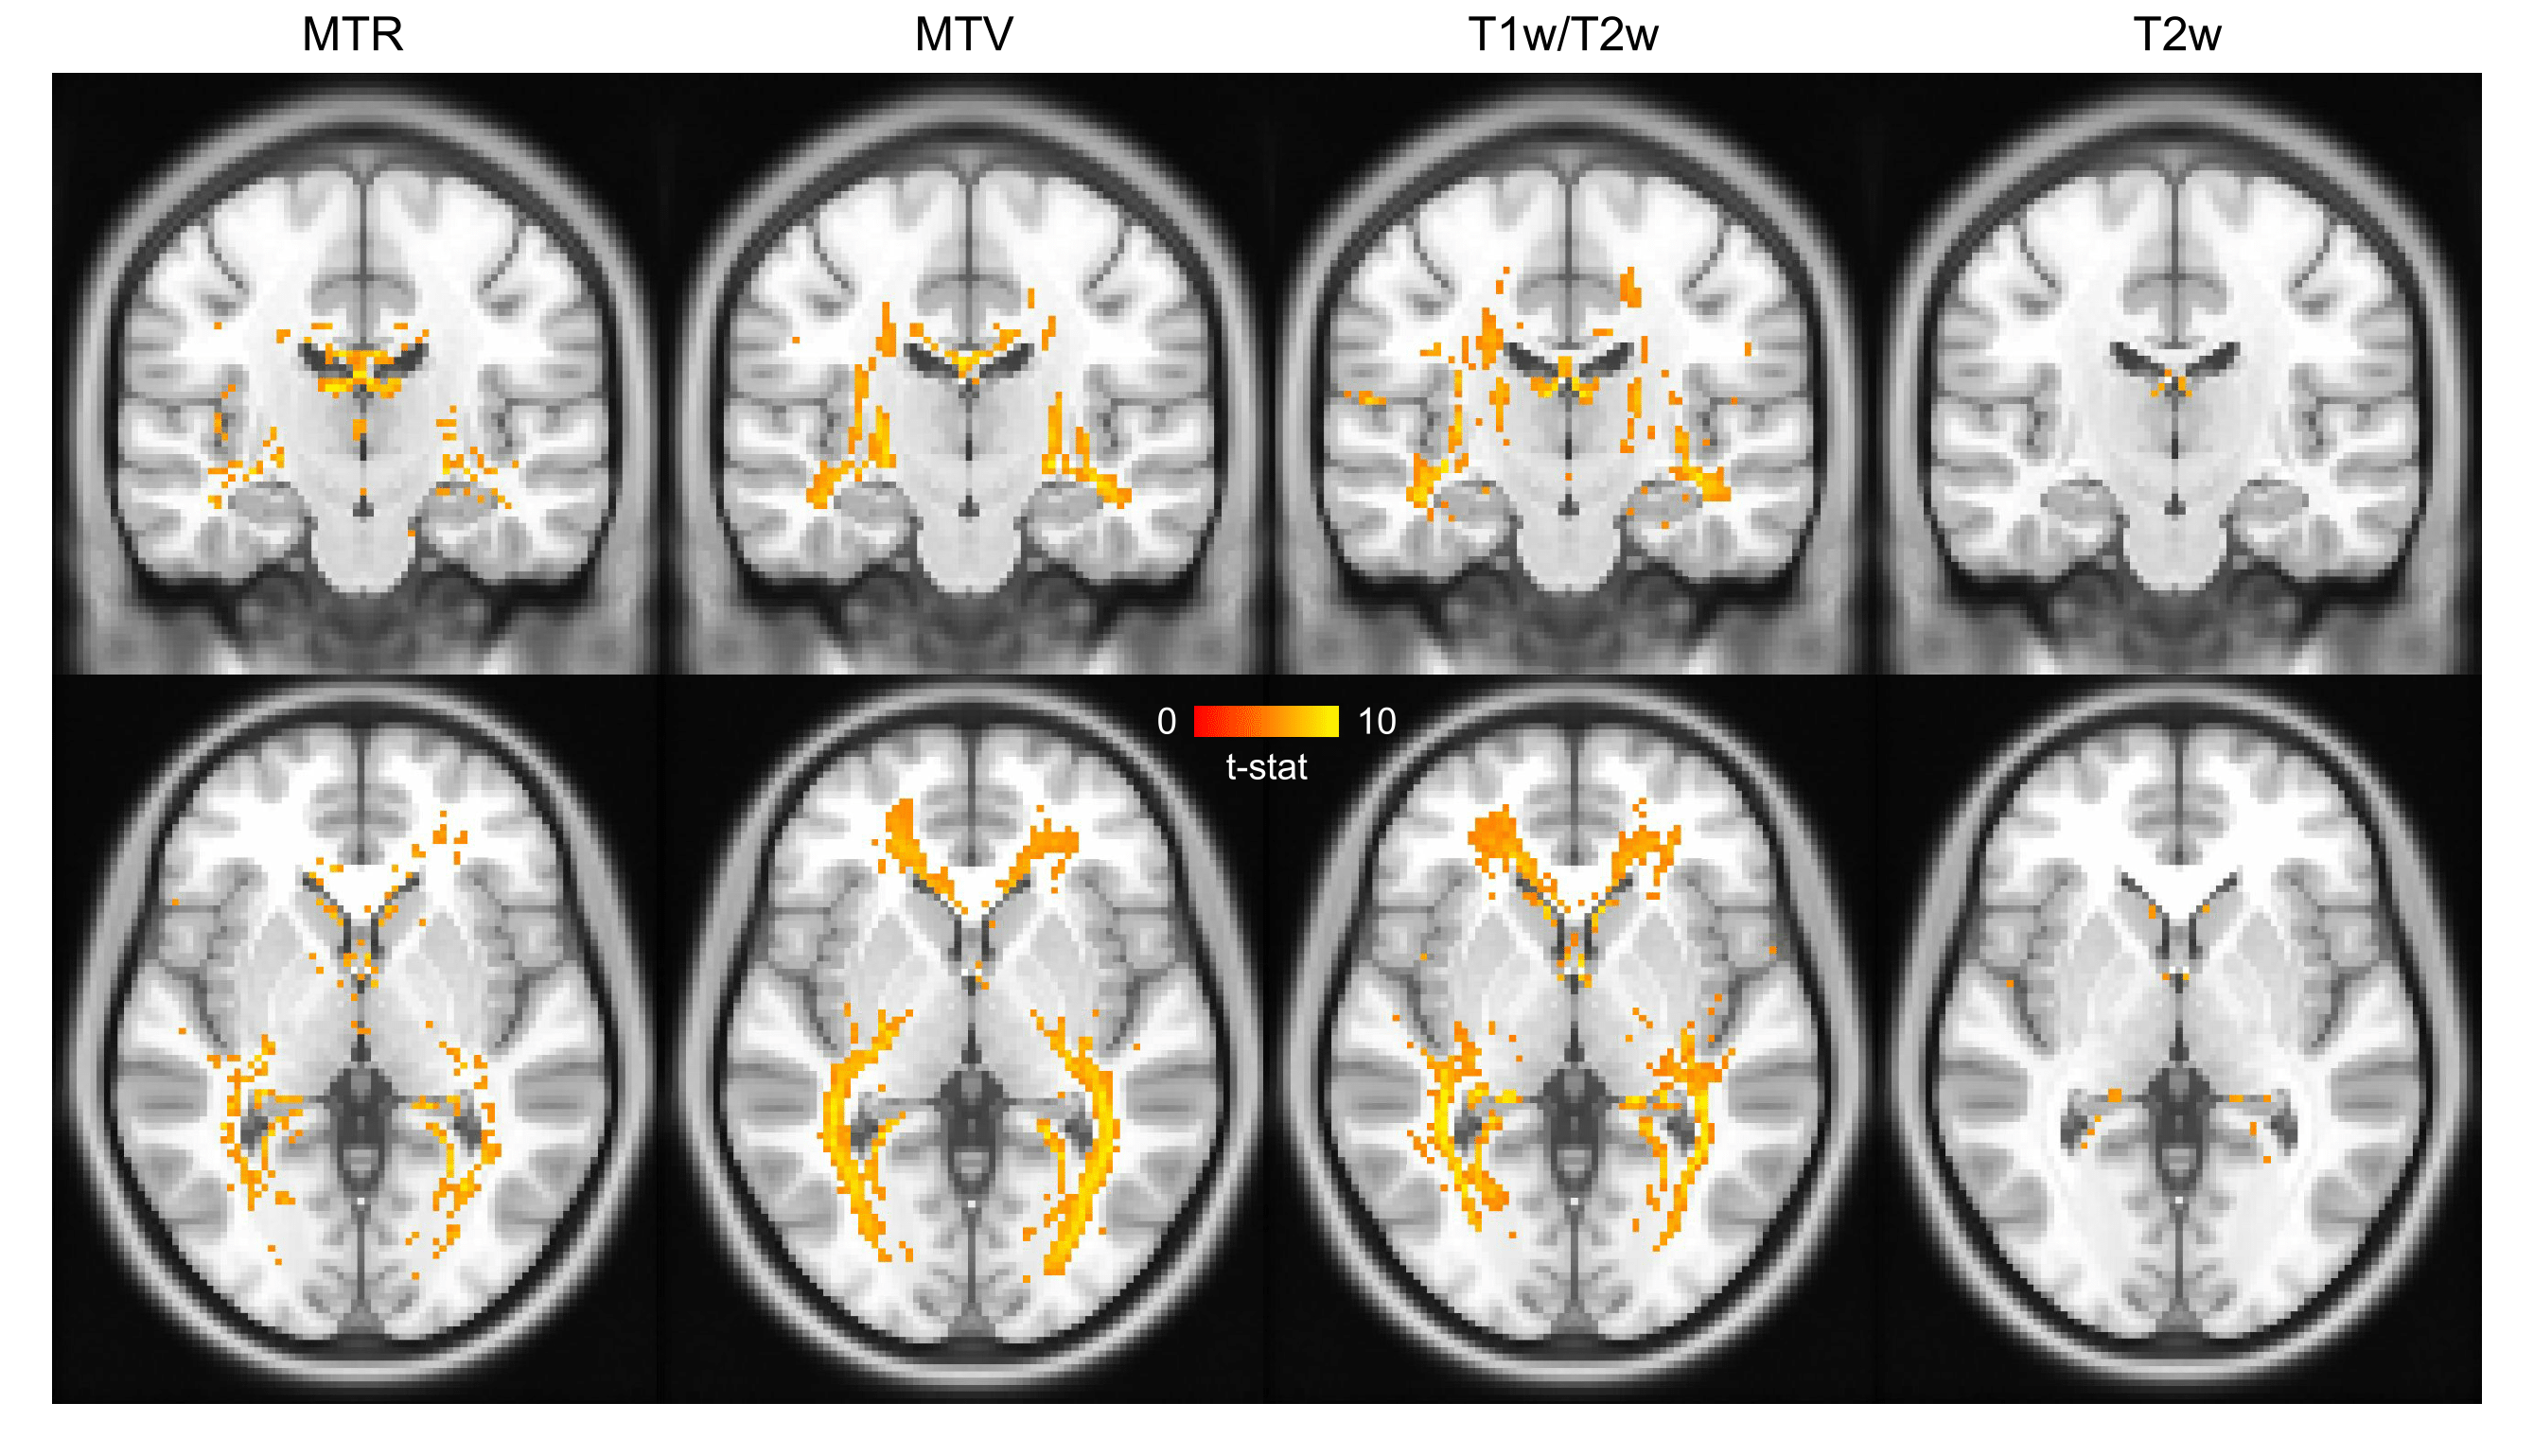
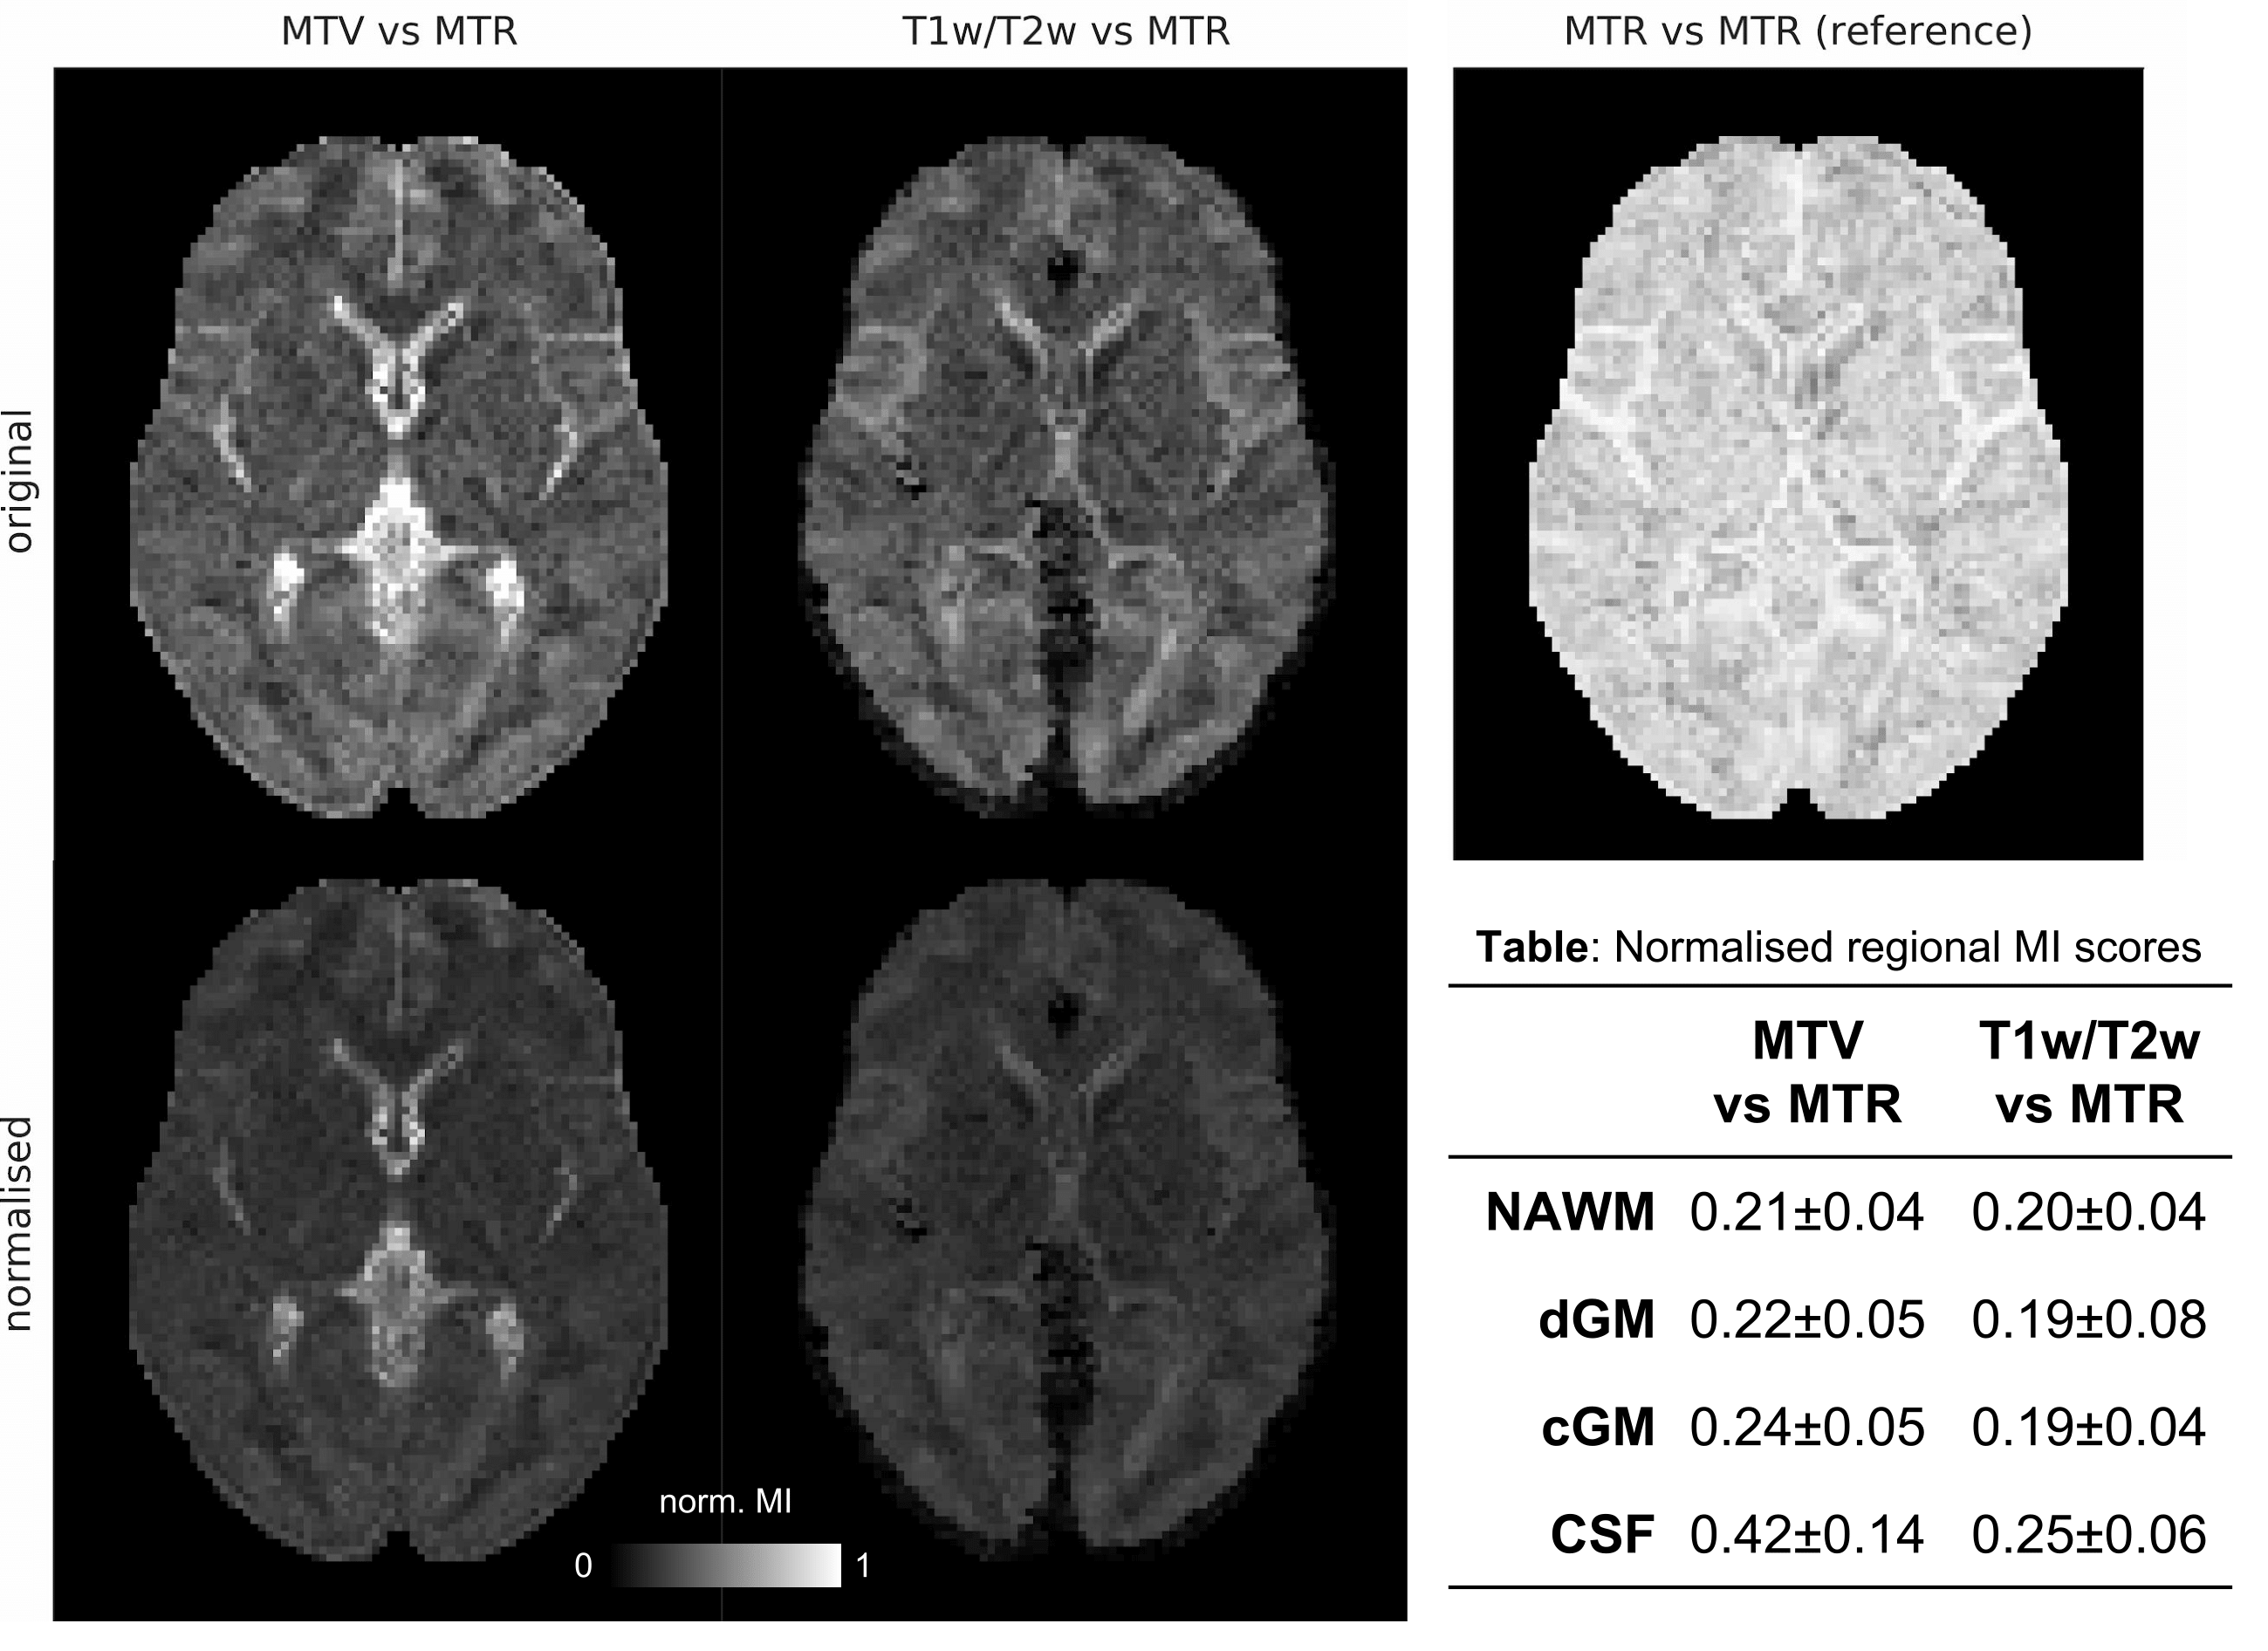
Figure 5. Top row: maps of MI between modalities, across patients. The MI-map of MTR against itself indicates the maximum MI-value achievable in every voxel and is therefore used as voxel-wise normalisation factor. Bottom row: normalised MI-maps and scores.
MI-scores were higher when comparing MTR with MTV, which implies that MTR matches more closely with MTV than T1w/T2w. Uniform values were observed in NAWM and deep-GM (dGM), showing that the degree of shared information across subjects between modalities is spatially independent. Higher values have been observed in cortical-GM (cGM) when comparing MTV with MTR, probably due to partial volume effects with CSF.