3309
Multi-Parametric White Matter Imaging in Multiple Sclerosis Lesions1Wayne State University, Detroit, MI, United States, 2The MRI Institute for Biomedical Research, Bingham Farms, MI, United States, 3Magnetic Resonance Innovations Inc., Bingham Farms, MI, United States, 4Multiple Sclerosis Center, Wayne State University School of Medicine, Detroit, MI, United States, 5MR Medical Imaging Innovations Inc., Hyderabad, India, 6AbbVie, North Chicago, IL, United States
Synopsis
A multiparametric quantitative white matter study using MRI was designed to include 15 relapsing remitting MS patients and 10 age and sex matched controls. The imaging protocol acquired 3D conventional imaging, SWI, QSM, DTI, MTC, and STrategically Acquired Gradient Echo (STAGE) imaging. ROI were manually drawn around MS lesions in T2-FLAIR and QSM. Contralateral normal appearing white matter (NAWM) and NAWM in controls were drawn in all modalities to measure mean intensity and volume. We found a good correlation between QSM, MTR, FA, MWF and conventional imaging. QSM’s sensitivity to demyelination best complimented T2-FLAIR’s sensitivity to inflammation and scarring.
Introduction
MS is a neurodegenerative disease characterized by a wide range of symptoms and multiple progressive disease courses. Previous multi-parametric MRI studies have attempted to find correlations in lesion properties between modalities, however most studies have been limited in the combinations of MR modalities used and the experimental controls imposed. The aim of this study was to evaluate the technical reproducibility of imaging methods in healthy subjects and to measure longitudinal changes in white matter in MS patients. It is hoped that the results of this study will inform the selection of MRI measures for future studies of disease characterization reducing protocol redundancy.Methods
Fifteen relapsing remitting MS patients (37.4+/-9 years of age; 13 females) and ten healthy controls (35.4+/-12 years of age; 6 females) (HC), age and sex-matched, were included in the study. The disease duration on the MS subjects was 6.1+/-5 years. The Expanded Disability Status Scale (EDSS) score ranged from 0-4 with a median EDSS score of 1.5 at both time points. Participants were imaged twice: Controls at a 2 week window and MS patients at a 6 month window.
All subjects were imaged on a 3T Siemens Verio. The MRI protocol included: pre and post contrast T1W, T2W, 3D T2 FLAIR, DTI, MTC, SWI and STAGE imaging.
Images were processed using SPIN software (SpinTech Inc., MI). STAGE images were processed using custom Matlab-based software in order to generate: phase, SWI, T2*/R2*, QSM data, T1 maps and PD maps. DTI studio was used to generate fractional anisotropy (FA), radial diffusivity (RD) and mean diffusivity (MD) maps. MTR was calculated as the ratio (MTCoff-MTCon)/MTCoff.
Regions of interest (ROI) were drawn around all radiologist confirmed white matter lesions which appeared in T2-FLAIR and/or QSM. These lesions were then manually drawn across all modalities as they appeared within that modality with a NAWM region drawn contralateral. ROIs were also drawn in the HC sampling four different regions in both hemispheres within the frontal, temporal, and parietal lobes.
Results
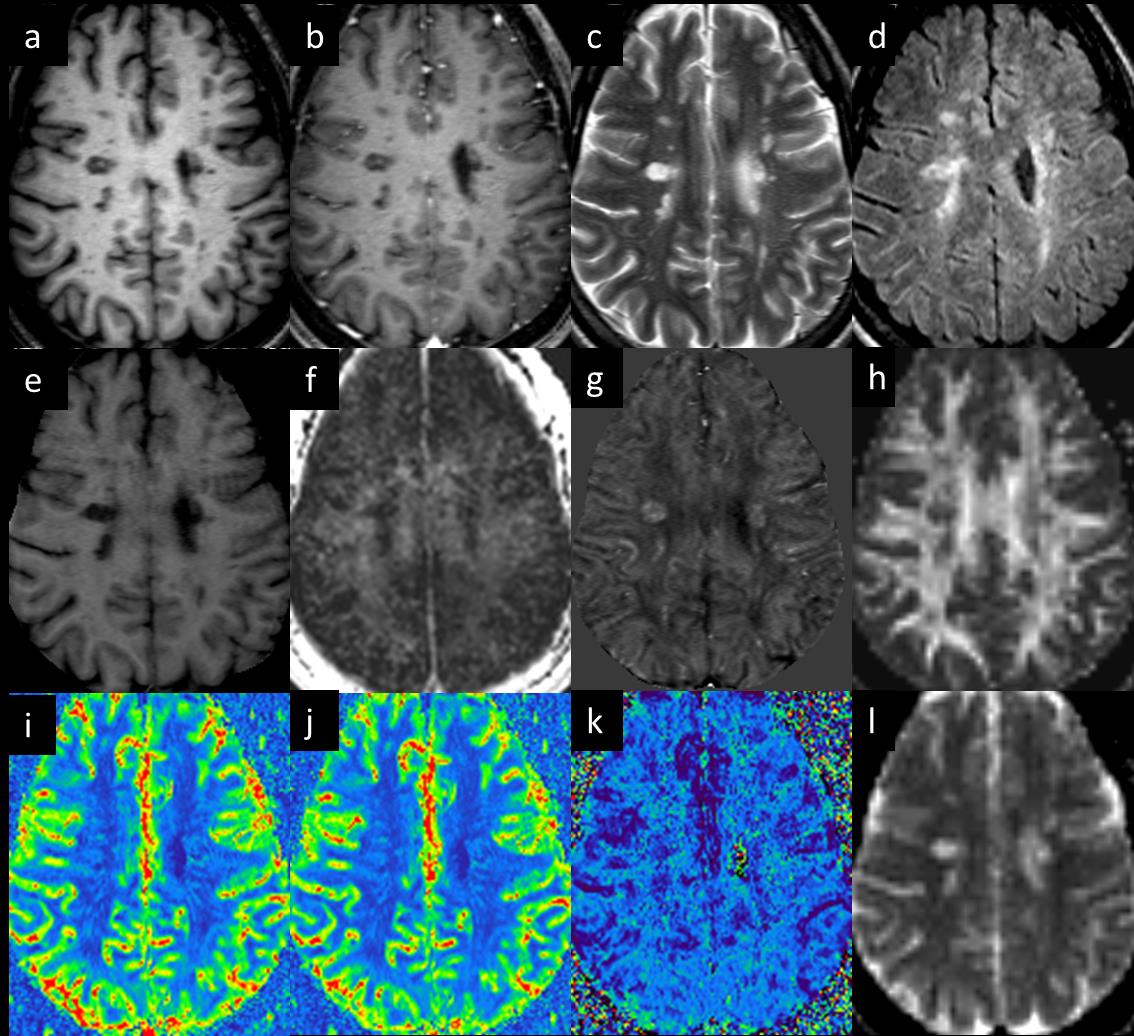
Example images of representative MS lesions across all modalities are shown in Figure 1. The T2-FLAIR lesion count in MS patients varied from 1 to 31 lesions. All lesions observed in QSM also appeared as hyper-intensities on T2-FLAIR images, but conversely not all lesions on T2-FLAIR were observed on QSM. In T2-FLAIR, one HC had 5 stable lesions and a second HC had 13 stable lesions, none of which appeared on QSM. These two healthy subjects were excluded in the analysis. There was no significant difference in the NAWM tissue values between MS and HC subjects.
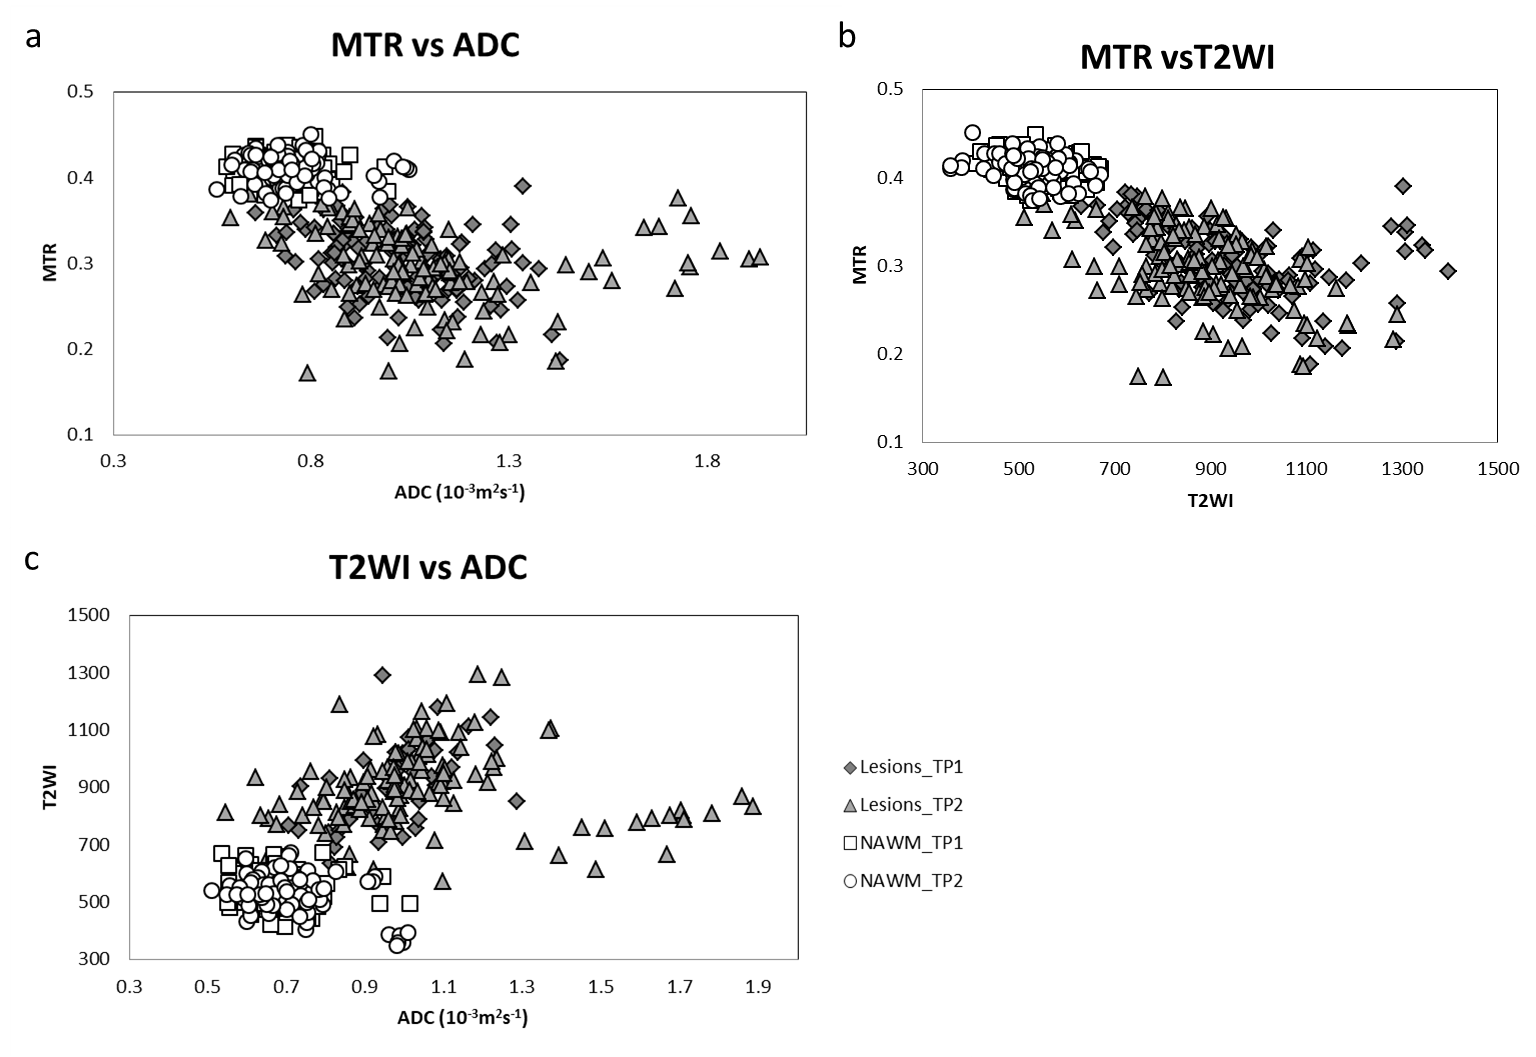
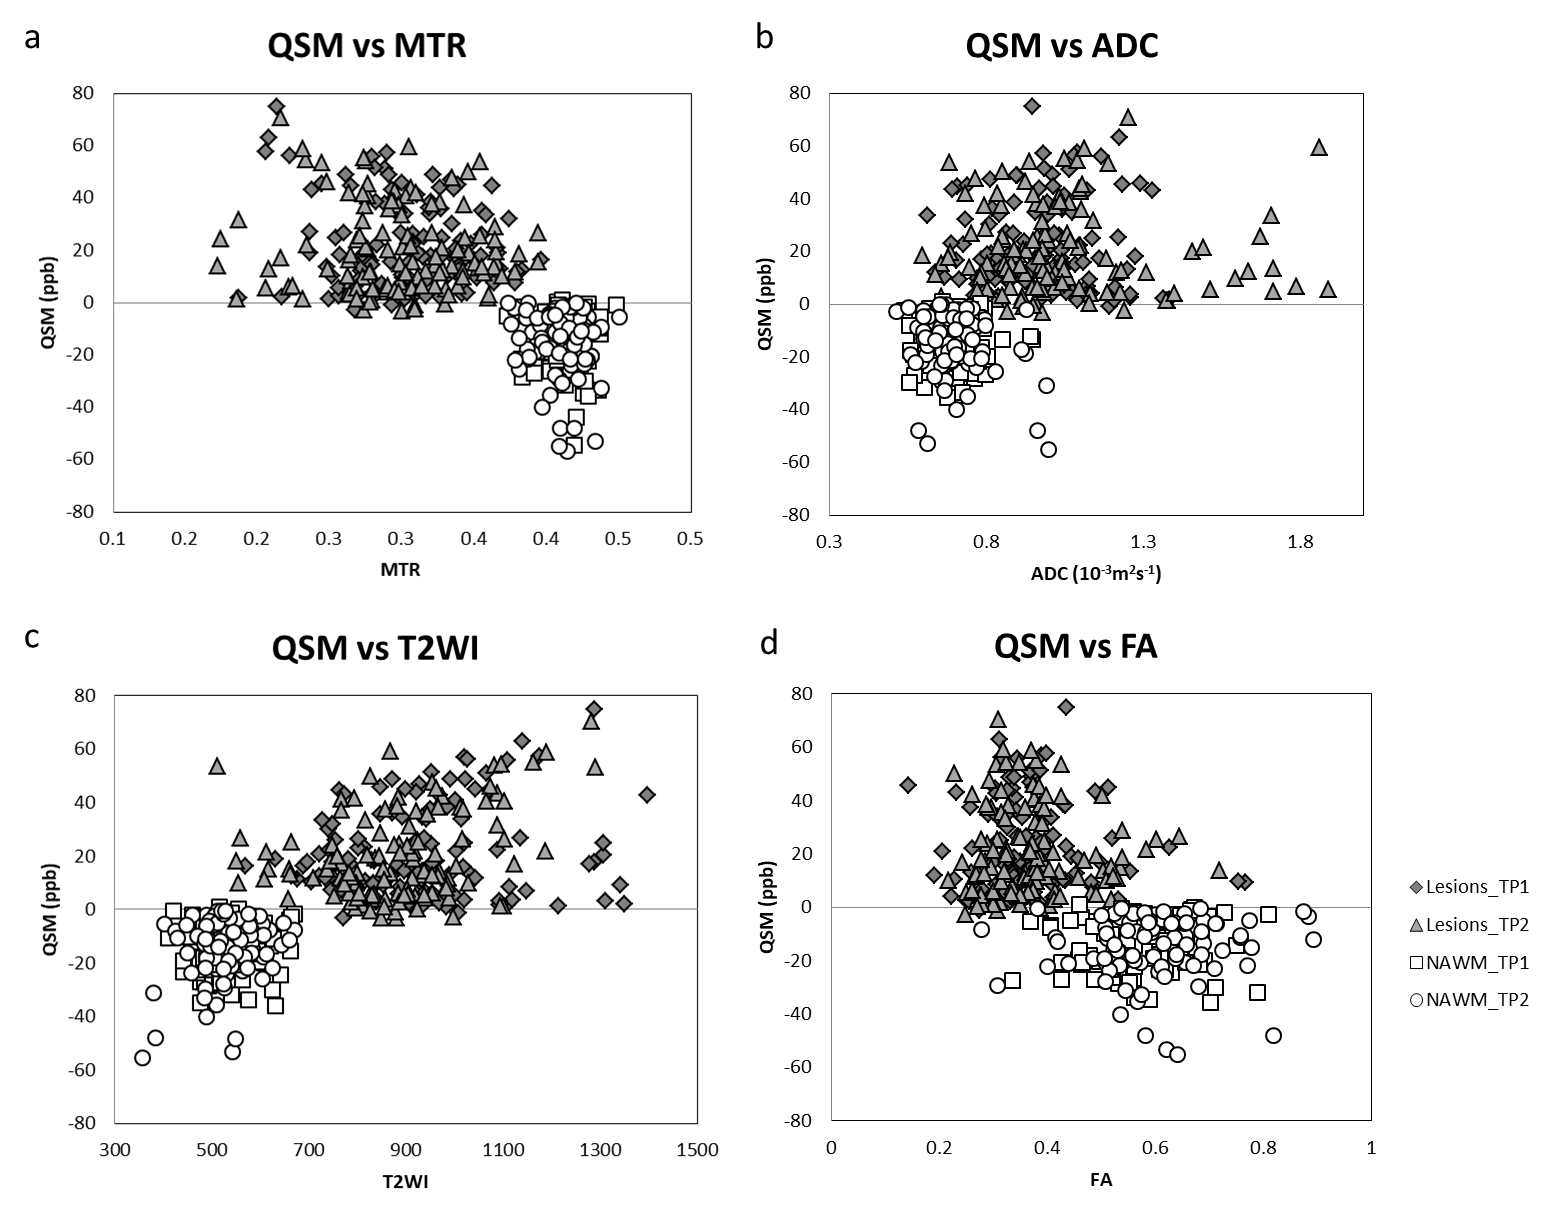
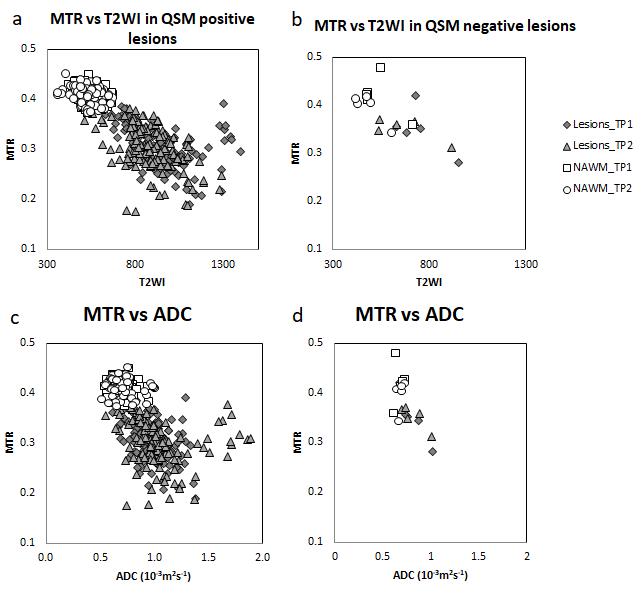
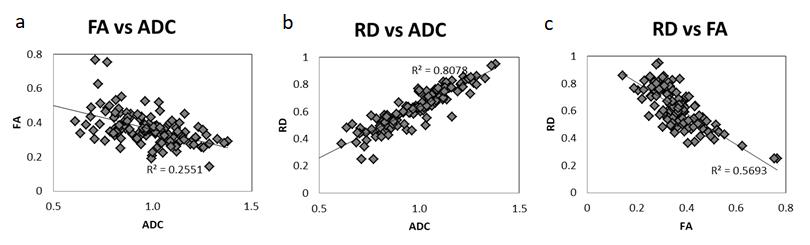
QSM positive lesions showed a mean susceptibility varying from 0 to 75 ppb. QSM negative lesions showed mean susceptibility negative or near zero, and did not have contrast with NAWM. Figure 2 the correlation in intensities for lesions across MTR, ADC, T2W and T2-FLAIR. QSM, MTR, T2 and FA maps showed significant correlations in all the subjects in Figure 3. For MS lesions which appeared clearly in QSM as susceptibility changes relative to NAWM, intensities showed a correlation with MTR, T2W, and ADC (Figure 4). Figure 5 shows the intensity plotted between FA, ADC and RD. These show some correlation with one another. No correlations were found between the number/volume of lesions and the EDSS scores among the MS subjects.
Discussion
FLAIR imaging detected the most lesions comparing to other methods, with DTI measures performing less well because of the low resolution and poorer CNR. The most efficient protocol for lesion detection and differentiation would include T2-FLAIR for subtle lesion detection; T2W/T1W for high water content lesions and T2W structural imaging for lesion detection; QSM for susceptibility quantification; and contrast enhanced imaging for acute lesion detection. A fusion image of T2 FLAIR with SWI makes it possible to visualize areas with just inflammatory white matter hyperintensities and those with susceptibility changes. The changes in susceptibility can be caused by either demyelination (causing the WM to lose its diamagnetic property and become more paramagnetic) or iron builds up from macrophages. Small changes of less than 60ppb are believed to result from demyelination. Larger changes, especially in ring-like structures are believed to result from the presence of macrophages and an increase in hemosiderin (and hence iron content).Conclusion
In conclusion WM pathology in MS can be reliably assessed using an imaging protocol consisting of T2-FLAIR, T1W, T2W and SWI/QSM imaging to detect MS lesions and to distinguish between demyelinating, inflammatory and demyelinating/inflammatory lesions. This protocol requires a scan time of approximately 20-25 minutes.Acknowledgements
No acknowledgement found.References
1. Iannucci G, Rovaris M, Giacomotti L, Comi G, Filippi M. Correlation of multiple sclerosis measures derived from T2-weighted, T1-weighted, magnetization transfer, and diffusion tensor MR imaging. AJNR Am J Neuroradiol 2001; 22: 1462-1467.
2. Hagiwara A, Hori M, Yokoyama K, Takemura MY, Andica C, Kumamaru KK, Nakazawa M, Takano N, Kawasaki H, Sato S, Hamasaki N, Kunimatsu A, Aoki S. Utility of a Multiparametric Quantitative MRI Model That Assesses Myelin and Edema for Evaluating Plaques, Periplaque White Matter, and Normal-Appearing White Matter in Patients with Multiple Sclerosis: A Feasibility Study. AJNR Am J Neuroradiol 2017; 38: 237-242.
3. Thaler C, Faizy TD, Sedlacik J, Bester M, Stellmann JP, Heesen C, Fiehler J, Siemonsen S. The use of multiparametric quantitative magnetic resonance imaging for evaluating visually assigned lesion groups in patients with multiple sclerosis. J Neurol 2018; 265: 127-133.
4. Chen Y, Liu S, Wang Y, Kang Y, Haacke EM. STrategically Acquired Gradient Echo (STAGE) imaging, part I: Creating enhanced T1 contrast and standardized susceptibility weighted imaging and quantitative susceptibility mapping. Magn Reson Imaging 2018; 46: 130-139.
5. Wang Y, Chen Y, Wu D, Sethi SK, Yang G, Xie H, Xia S, Haacke EM. STrategically Acquired Gradient Echo (STAGE) imaging, part II: Correcting for RF inhomogeneities in estimating T1 and proton density. Magn Reson Imaging 2018; 46: 140-150.
6. Jiang H, Van Zijl PC, Kim J, Pearlson GD, Mori S. DtiStudio: resource program for diffusion tensor computation and fiber bundle tracking. Comput Methods Programs Biomed 2006; 81: 106-116.
Figures