3306
Don’t track edema if you are interested in demyelination: Quantitative susceptibility mapping of MS lesions depends on the image contrast used for lesion definitionChristoph Birkl1,2, Christian Kames1, David Li3, Anthony Traboulsee4, and Alexander Rauscher1,3,5
1UBC MRI Research Centre, University of British Columbia, Vancouver, BC, Canada, 2Department of Neurology, Medical University of Graz, Graz, Austria, 3Department of Radiology, University of British Columbia, Vancouver, BC, Canada, 4Division of Neurology, Department of Medicine, University of British Columbia, Vancouver, BC, Canada, 5Department of Pediatrics (Division of Neurology), university of British Columbia, Vancouver, BC, Canada
Synopsis
The purpose of this study was to evaluate how definition of multiple sclerosis lesions affects the measurement of quantitative magnetic susceptibility measurements in these lesions. Masks were drawn on FLAIR and QSM images at baseline and different follow-up time points. QSM was analyzed longitudinally across these lesion masks of the same lesion and compared to NAWM. A strong variability in longitudinal QSM was observed when masks were drawn on FLAIR images. The most consistnt behavior was seen on QSM based masks. The time point of lesion definition had a stronger influence when using FLAIR maks than with QSM based masks.
Introduction
With the emergence of multiple sclerosis (MS) treatments with protective and restorative properties, efforts are underway developing quantitative imaging markers of tissue damage and repair. Conventional MRI measures for inflammatory processes, including lesion load on T2-weighted MRI and new lesion activity on gadolinium (Gd) enhanced MRI are not able to quantify myelin changes. A promising avenue for mapping de- and remyelination in white matter (WM) are quantitative MRI techniques sensitive to tissue magnetic susceptibility, such as quantitative susceptibility mapping (QSM).1 Assuming that newly developing lesions have a greater repair capacity than stable chronic lesions, analyzing changes in lesions after their initial appearance may allow tracking of remyelination quantitatively. Traditionally, tissue regions analyzed with quantitative techniques are based on lesion masks derived on T2-weighted or fluid attenuated inversion recovery (FLAIR) images.2–5 However, hyperintense T2 reflects both inflammation and edema and may not necessarily correspond to the actual area of demyelination, raising the question, which image contrast should be used to define new MS lesions in order to track myelin repair. Here, we compared longitudinal measurements of QSM in Gd-enhancing lesions where the lesion masks were defined on FLAIR and QSM.Methods
35 subjects with MS were scanned on a 3T Philips MRI system at baseline (week 0), and 24, 48 and 72 weeks thereafter. Images were acquired using following sequences: A 3D FLAIR with TR = 8000ms, TE = 337ms, TI = 2400ms and FOV = 257x256x160mm3. A 3D gradient echo sequence (GRE) with 5 echos starting at TE1 = 5.0ms, deltaTE = 6.0ms, TR = 33ms, flip angle = 17o and FOV = 220x170x112mm3. A T1-weighted spin echo sequence was acquired five minutes after Gd injection (0.1 mmol/kg body weight). QSM was calculated from GRE phase images as previously described6 at TE = 15, 20 and 25 ms and averaged. All images were registered to the baseline QSM scan using FSL FLIRT. Lesion masks were manually drawn on FLAIR images at the time of enhancement and on QSM at the time of first appearance after enhancement. Furthermore, masks were drawn on all follow-up scans on FLAIR and QSM. Lesion tissue encompassed all hyperintense voxels on FLAIR and QSM compared to surrounding non-lesional WM. For each lesion, QSM was averaged across the lesion volume and plotted over time. This was done for each leasion mask independently. Nearby normal appearing white matter (NAWM) was defined as an area with normal image contrast on all scans.Results
Three out of 35 patients had one or more Gd-enhancing lesions in at least one time point. Figures 1 and 3 show representative lesions on post Gd T1-weighted, FLAIR and QSM at all available time points. All Gd-enhancing lesions appeared hyperintense on FLAIR and QSM and were visible on FLAIR and post Gd T1-weighted scans at the time of enhancement. On QSM, these lesions were first visible at the subsequent time point. QSM values in NAWM remained relatively constant over time. Time dependent QSM of Gd-enhancing lesions measured using QSM based masks showed a sharp increase in susceptibility after enhancement, indicating acute demyelination, and remained elevated on all following time points (Figure 2). QSM analyzed based on FLAIR masks, on the other hand, exhibited this behavior only in two enhancing lesions. In the other two Gd-enhancing lesions, QSM based on FLAIR masks was even lower than QSM in nearby NAWM (Figure 4). The time dependent volume change of QSM and FLAIR based lesion masks is shown in Figure 5. FLAIR based masks showed more variation in volume than QSM based masks.Discussion
Most previous studies analyzed QSM based on lesion masks encompassing the entire hyperintense volume on FLAIR or T2.2–5 While this approach is in line with conventional imaging outcomes in clinical trials, it may not be suitable for evaluating tissue damage on quantitative MRI. Here we showed that QSM values in MS lesions strongly depend on the image contrast and the time point used for lesion mask definition. This difference is likely due to the fact that QSM is sensitive to demyelination but rather insensitive to edema, whereas FLAIR and T2 mainly reflect increased water content due to edema. On conventional FLAIR or T2-weighted images, hyperintense MS lesion reflect a variety of pathological features, including but not limited to edema, 7 gliosis, 7 the presence of macrophages, 8 or demyelination.9 Demyelination is only a minor contributor to T2 changes.7,10 Therefore, T2 hyperintense areas are larger than the demyelinated areas. In conclusion, MS lesion mask definition strongly influences the outcome of longitudinal QSM when evaluating de- and remyelination.Acknowledgements
No acknowledgement found.References
- Duyn, J. H. & Schenck, J. Contributions to magnetic susceptibility of brain tissue. NMR Biomed. 30, (2017).
- Chen, W. et al. Quantitative susceptibility mapping of multiple sclerosis lesions at various ages. Radiology 271, 183–192 (2014).
- Li, X. et al. Magnetic susceptibility contrast variations in multiple sclerosis lesions. J. Magn. Reson. Imaging JMRI 43, 463–473 (2016).
- Zhang, Y. et al. Longitudinal change in magnetic susceptibility of new enhanced multiple sclerosis (MS) lesions measured on serial quantitative susceptibility mapping (QSM). J. Magn. Reson. Imaging JMRI 44, 426–432 (2016).
- Deh, K. et al. Magnetic susceptibility increases as diamagnetic molecules breakdown: Myelin digestion during multiple sclerosis lesion formation contributes to increase on QSM. J. Magn. Reson. Imaging JMRI (2018). doi:10.1002/jmri.25997
- Kames, C., Wiggermann, V. & Rauscher, A. Rapid two-step dipole inversion for susceptibility mapping with sparsity priors. NeuroImage 167, 276–283 (2017).
- Ormerod, I. E. et al. The role of NMR imaging in the assessment of multiple sclerosis and isolated neurological lesions. A quantitative study. Brain J. Neurol. 110 ( Pt 6), 1579–1616 (1987).
- Nesbit, G. M., Forbes, G. S., Scheithauer, B. W., Okazaki, H. & Rodriguez, M. Multiple sclerosis: histopathologic and MR and/or CT correlation in 37 cases at biopsy and three cases at autopsy. Radiology 180, 467–474 (1991).
- Estes, M. L., Rudick, R. A., Barnett, G. H. & Ransohoff, R. M. Stereotactic biopsy of an active multiple sclerosis lesion. Immunocytochemical analysis and neuropathologic correlation with magnetic resonance imaging. Arch. Neurol. 47, 1299–1303 (1990).
- Brück, W. et al. Inflammatory central nervous system
demyelination: correlation of magnetic resonance imaging findings
with lesion pathology. Ann. Neurol. 42, 783–793
(1997).
Figures
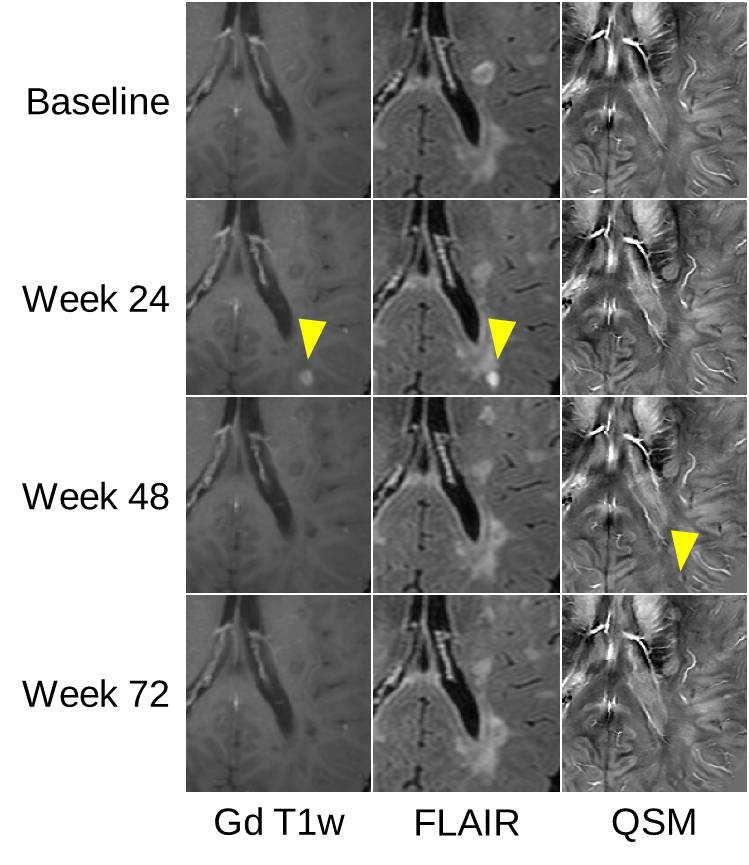
Figure
1: Representative Gd enhancing lesion #1 enhancing at week 24. On QSM the
lesion appears first at week 48.
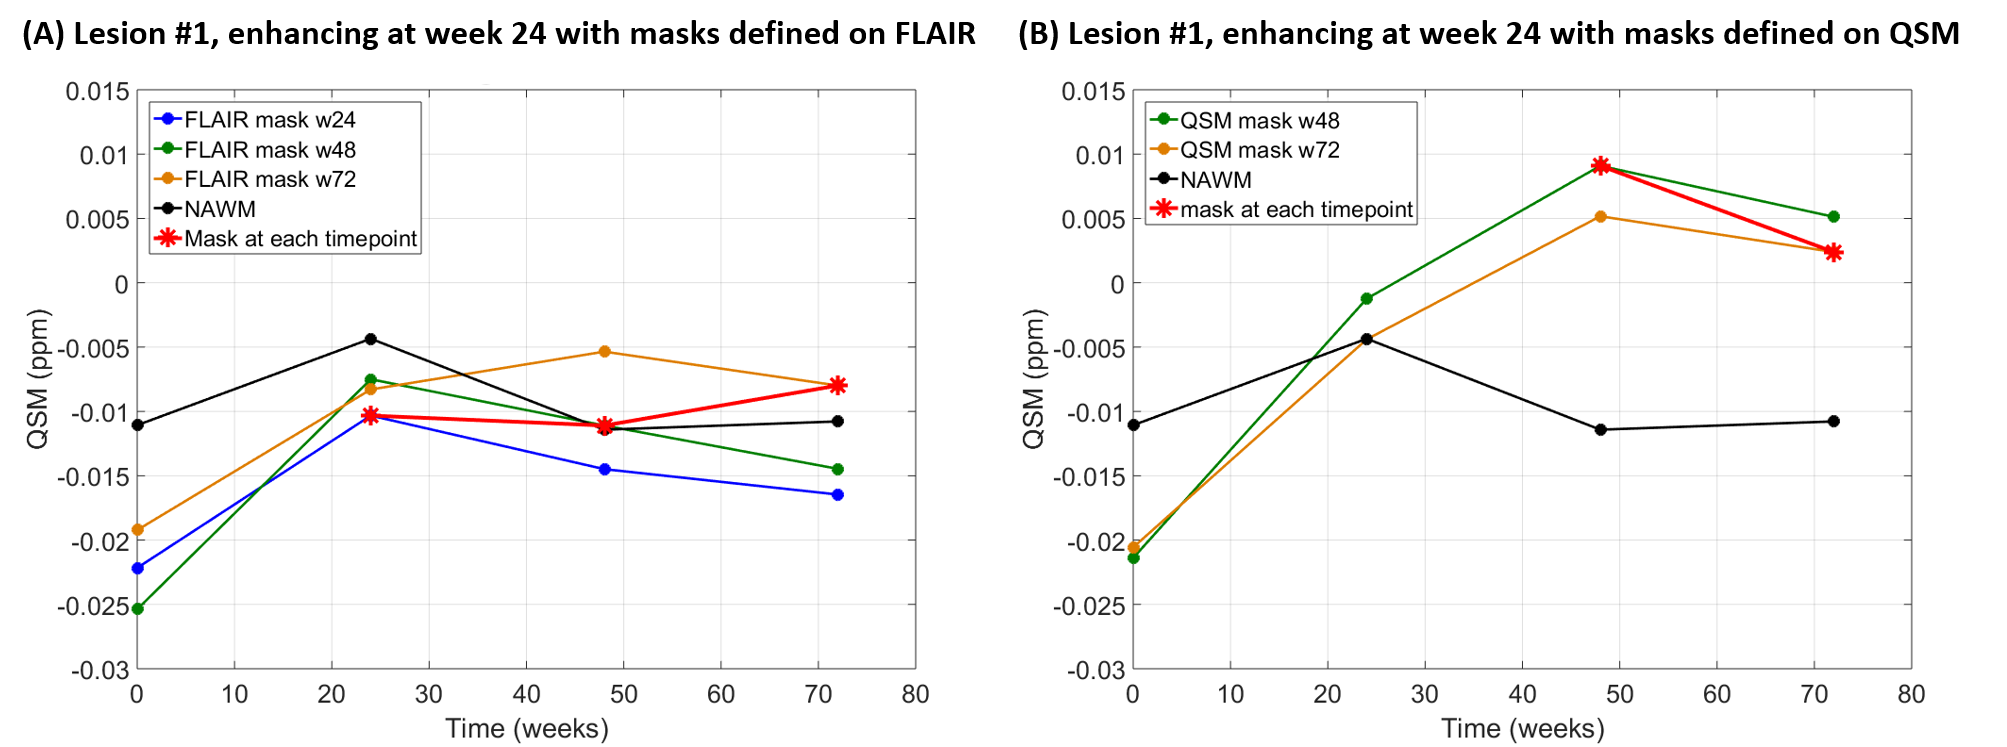
Figure
2: Longitudinal QSM of Gd enhancing lesion #1 (enhancing
at week 24) shown
in Figure 1, masked on FLAIR (A) and QSM (B) at different time
points. On FLAIR
based masks (A),
QSM showed behavior
similar to NAWM.
With the QSM based
masks (B) there is
considerable
increase in QSM at
the time points after
lesion enhancement .
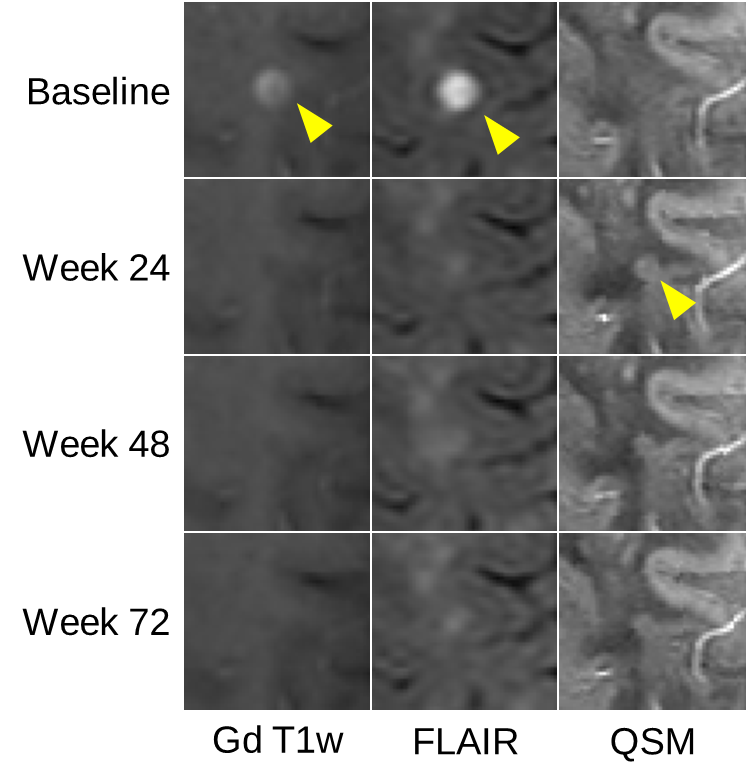
Figure
3: Representative Gd enhancing lesion #2 enhancing
at week 0.
On QSM the lesion appears first at week 24.
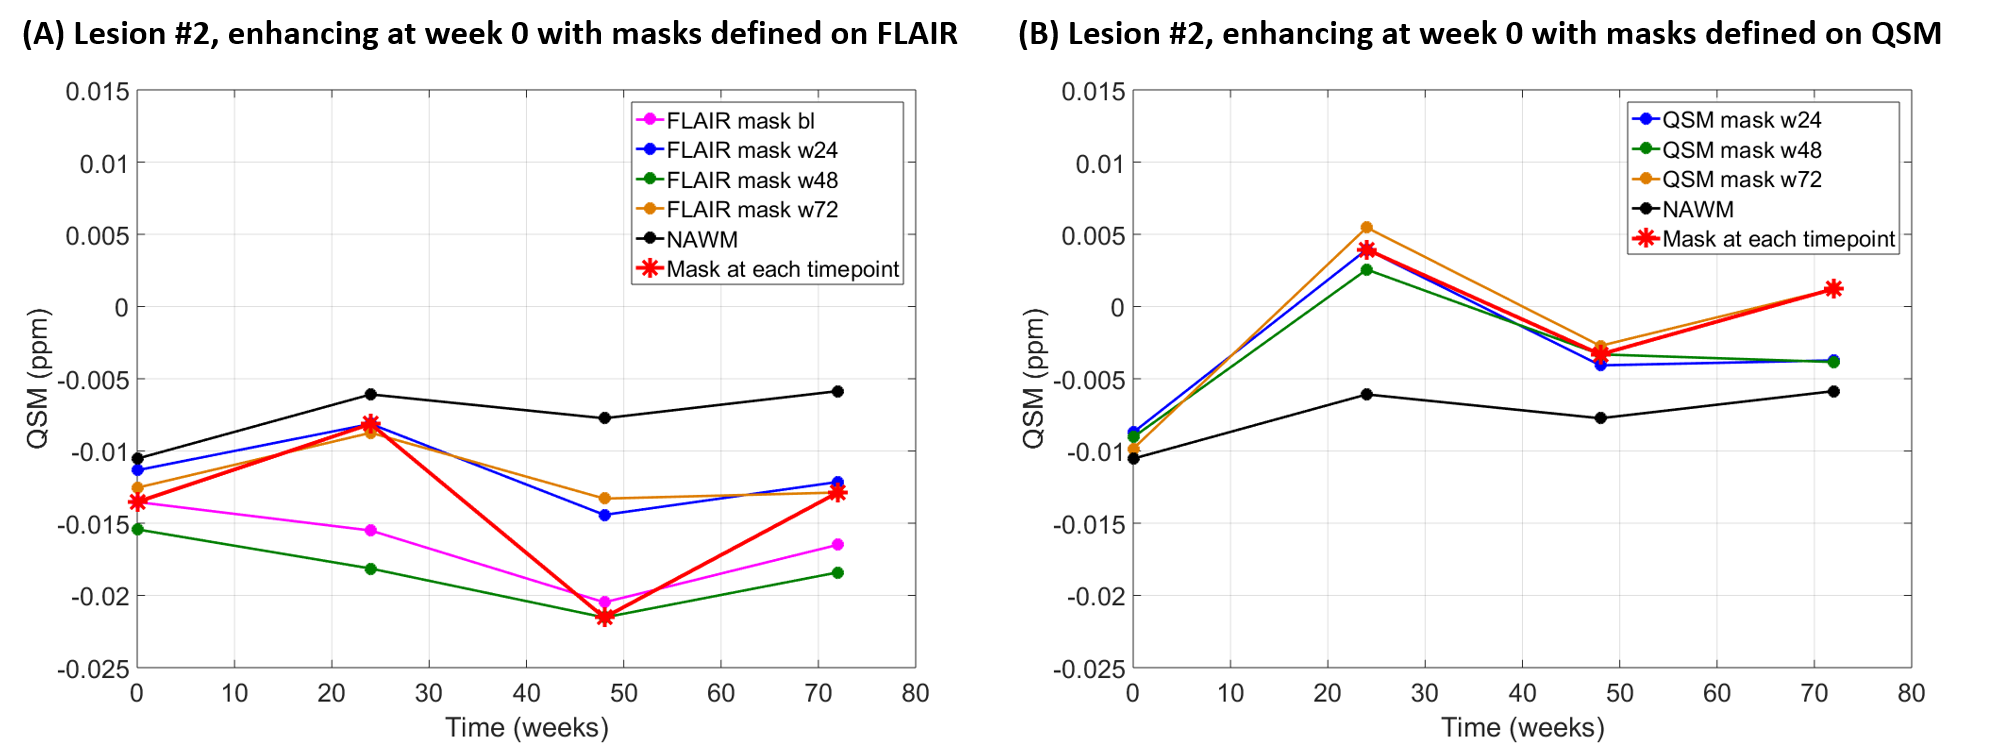
Figure
4: Longitudinal QSM of Gd enhancing lesion #2 (enhancing
at week 0) shown in
Figure 3, masked on FLAIR (A) and QSM (B) at different time points.
QSM assessed in FLAIR based masks (A) showed a
similar trend as
NAWM. QSM assessed
using
QSM based masks (B) were
overall higher than in NAWM and showed an increase after lesion
enhancement.
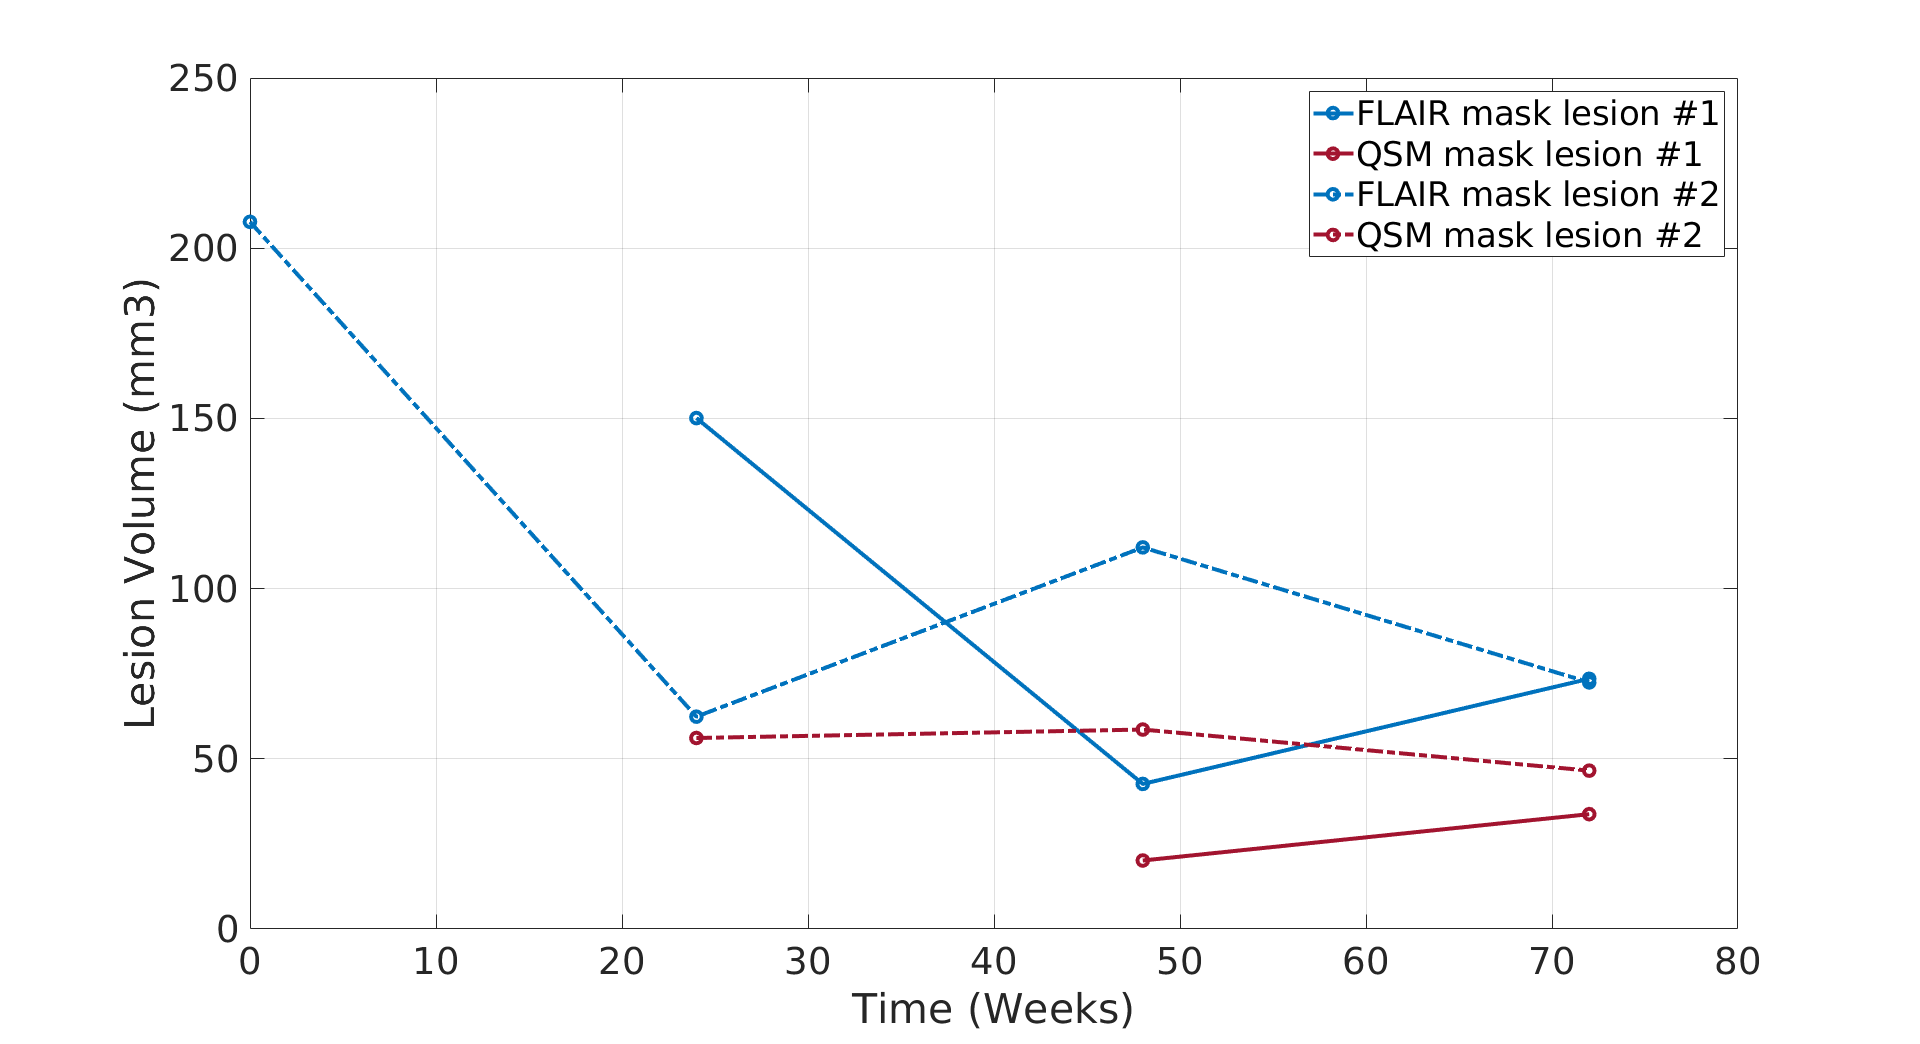
Figure
5: Time dependent volume change of FLAIR based lesion masks (blue)
and QSM based lesion masks (red) for Gd enhancing lesion #1
(enhancing at week 24, solid lines) and Gd enhancing lesion #2
(enhancing at week 0, dashed lines).