3304
Sodium MRI, SMT, and qMT in Black Holes in Multiple Sclerosis1Radiology and Imaging Sciences, University of Utah School of Medicine, Salt Lake City, UT, United States, 2Vanderbilt University Institute of Imaging Science, Nashville, TN, United States, 3Radiology and Radiological Sciences, Vanderbilt University Medical Center, Nashville, TN, United States, 4Clinical Neurology, Vanderbilt University Medical Center, Nashville, TN, United States
Synopsis
Black holes in multiple sclerosis (MS) are considered to be more indicative of axonal loss than T2 lesions. We employed three novel MRI techniques, sodium MRI, diffusion MRI via the spherical mean technique, and quantitative magnetization transfer to measure tissue sodium concentration (TSC, for axonal dysfunction), apparent axonal volume fraction (Vax, for axon loss), and macromolecular-to-free pool-size-ratio (PSR, for demyelination degree), respectively. The results showed significant differences of the measures between black holes and the contralateral normal appearing white matters, indicating the potential of using these techniques to provide more specific information on underlying pathology in MS.
Introduction
Multiple sclerosis (MS) is a chronic neurological disorder where the myelin sheath in the central nervous becomes damaged (demyelination) due to inflammation.1 Black holes (BH) in MS, which are characterized by T1-hypointensity and T2-hyperintensity, are considered to a more specific surrogate marker of axonal loss and neuronal destruction than T2 lesions. 2,3 Characterization of BHs using quantitative imaging methods may elucidate the underlying pathology of BHs and provide new means of evaluating therapeutic efficacy. Here we will evaluate three methods: 1) sodium MRI, 2) diffusion MRI via the spherical mean technique (SMT), and quantitative magnetization transfer (qMT) for three independent but complementary measures to characterize pathology in BHs comprehensively. Sodium MRI is of increasing interest in MS as it reflects metabolic deficits in brain tissue in vivo. When demyelination occurs, the mitochondrial defects in axons induce ATP deprivation and dysfunction of the Na+/K+ pump, which produces a sustained sodium influx into the axoplasm from the redistributed sodium channels, imposing a huge burden on the axonal metabolism, thus increasing the risk of axonal damage.4,5 SMT 6 has been recently proposed to describe tissue diffusion using an intra- and extra-axonal compartmental model from which the SMT-derived apparent axonal volume fraction (Vax) is in principle sensitive to axon loss, and SMT analysis has shown its potential in spinal cord in MS patients.7 Finally, qMT, which models the MT exchange between immobilized protons in white matter and free water, is considered a relatively tissue-specific measure of myelin content via the macromolecular-to-free pool-size-ratio (PSR).8,9 In this study, we employed sodium MRI, SMT, and qMT to assess black holes in MS patients. We propose that tissue sodium concentration (TSC) reports axon metabolic changes, Vax reflects axon loss, and PSR measures the degree of demyelination. We compared these measures between BHs and the contralateral normal appearing white matters (NAWMs), where the pathology is less severe.Methods
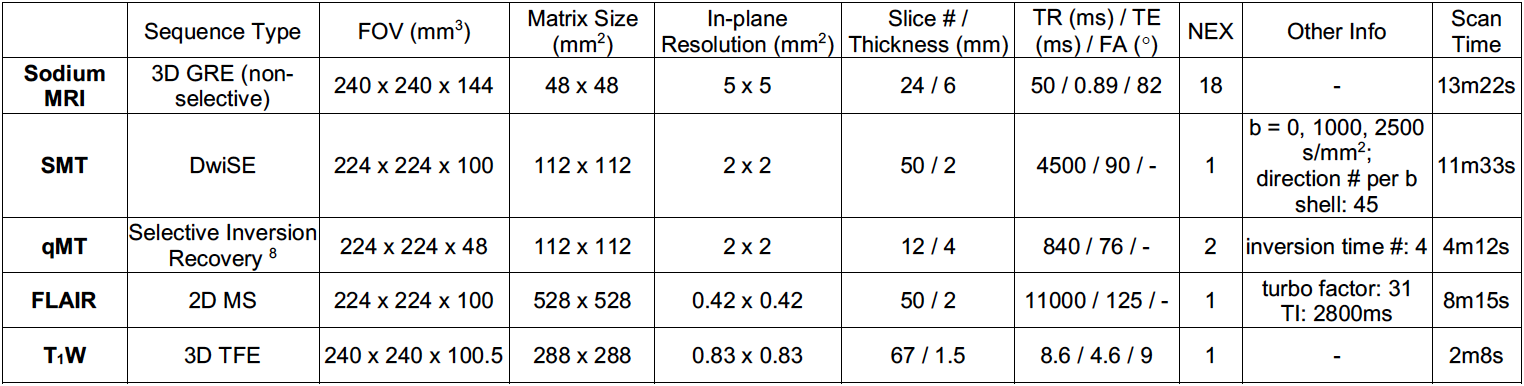
Seven relapse-remitting MS patients (6 females and 1 male, age = 36.4 ± 12.7 years, mean ± standard deviation) were included in this study. Informed consent was obtained in accordance with the local IRB. MRI was performed on a Philips Achieva 3.0T scanner (Philips Healthcare, Best, the Netherlands). Sodium MRI was acquired using a sodium quadrature head coil (Rapid Biomedical GmbH, Rimpar, Germany) with five calibration phantoms (NaCl aqueous solutions of 20mM, 50mM, 70mM, 100mM, and 140mM) scanned simultaneously for quantifying TSC through linear analysis. The SMT, qMT, and high-resolution anatomical images (FLAIR and T1-weighted) were acquired with a 32-channel NOVA coil. Table 1 summarizes the detailed imaging parameters.
After acquisition, maps of TSC, Vax, and PSR were computed and then co-registered (together with T1) to FLAIR using FSL (https://fsl.fmrib.ox.ac.uk/fsl/fslwiki). Black holes were identified by referring to both the registered T1 and FLAIR, volumes-of-interest (VOIs) were manually drawn on FLAIR using MIPAV (https://mipav.cit.nih.gov) for both the BHs and the NAWMs. For the seven MS patients, 53 BH VOIs were covered in the TSC and Vax maps, 48 of which were covered in the PSR (due to smaller F-H FOV in the qMT scans). Finally, student t-tests (two-tailed, unequal variance) were used to examine the differences of TSC, Vax, and PSR between BHs and the NAWMs, with a p < 0.05 considered statistically significant.
Results
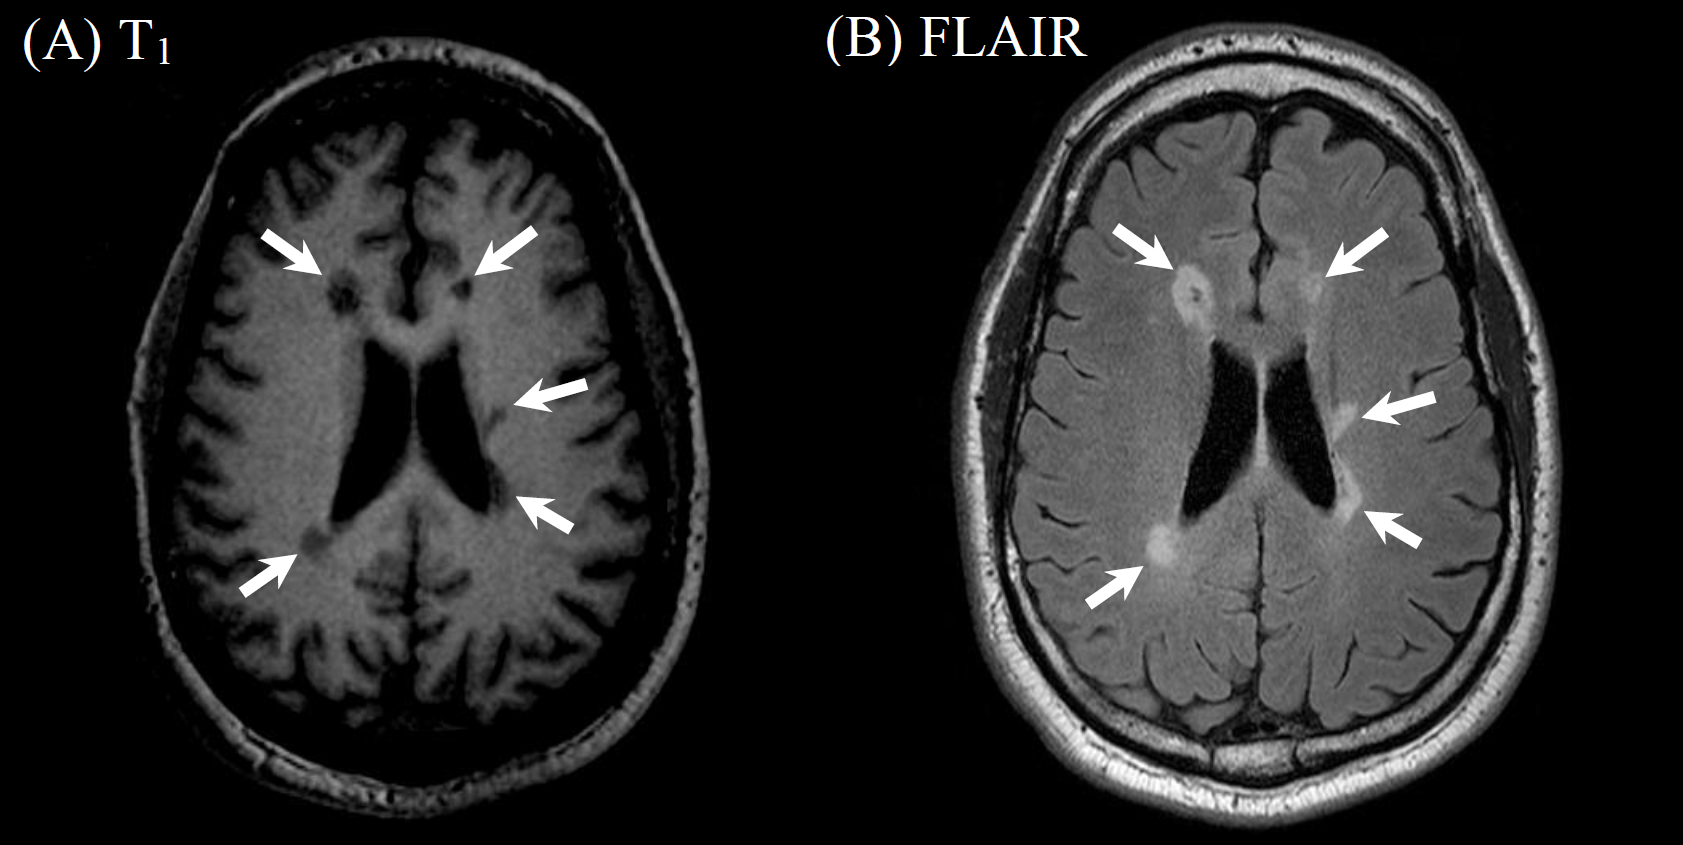
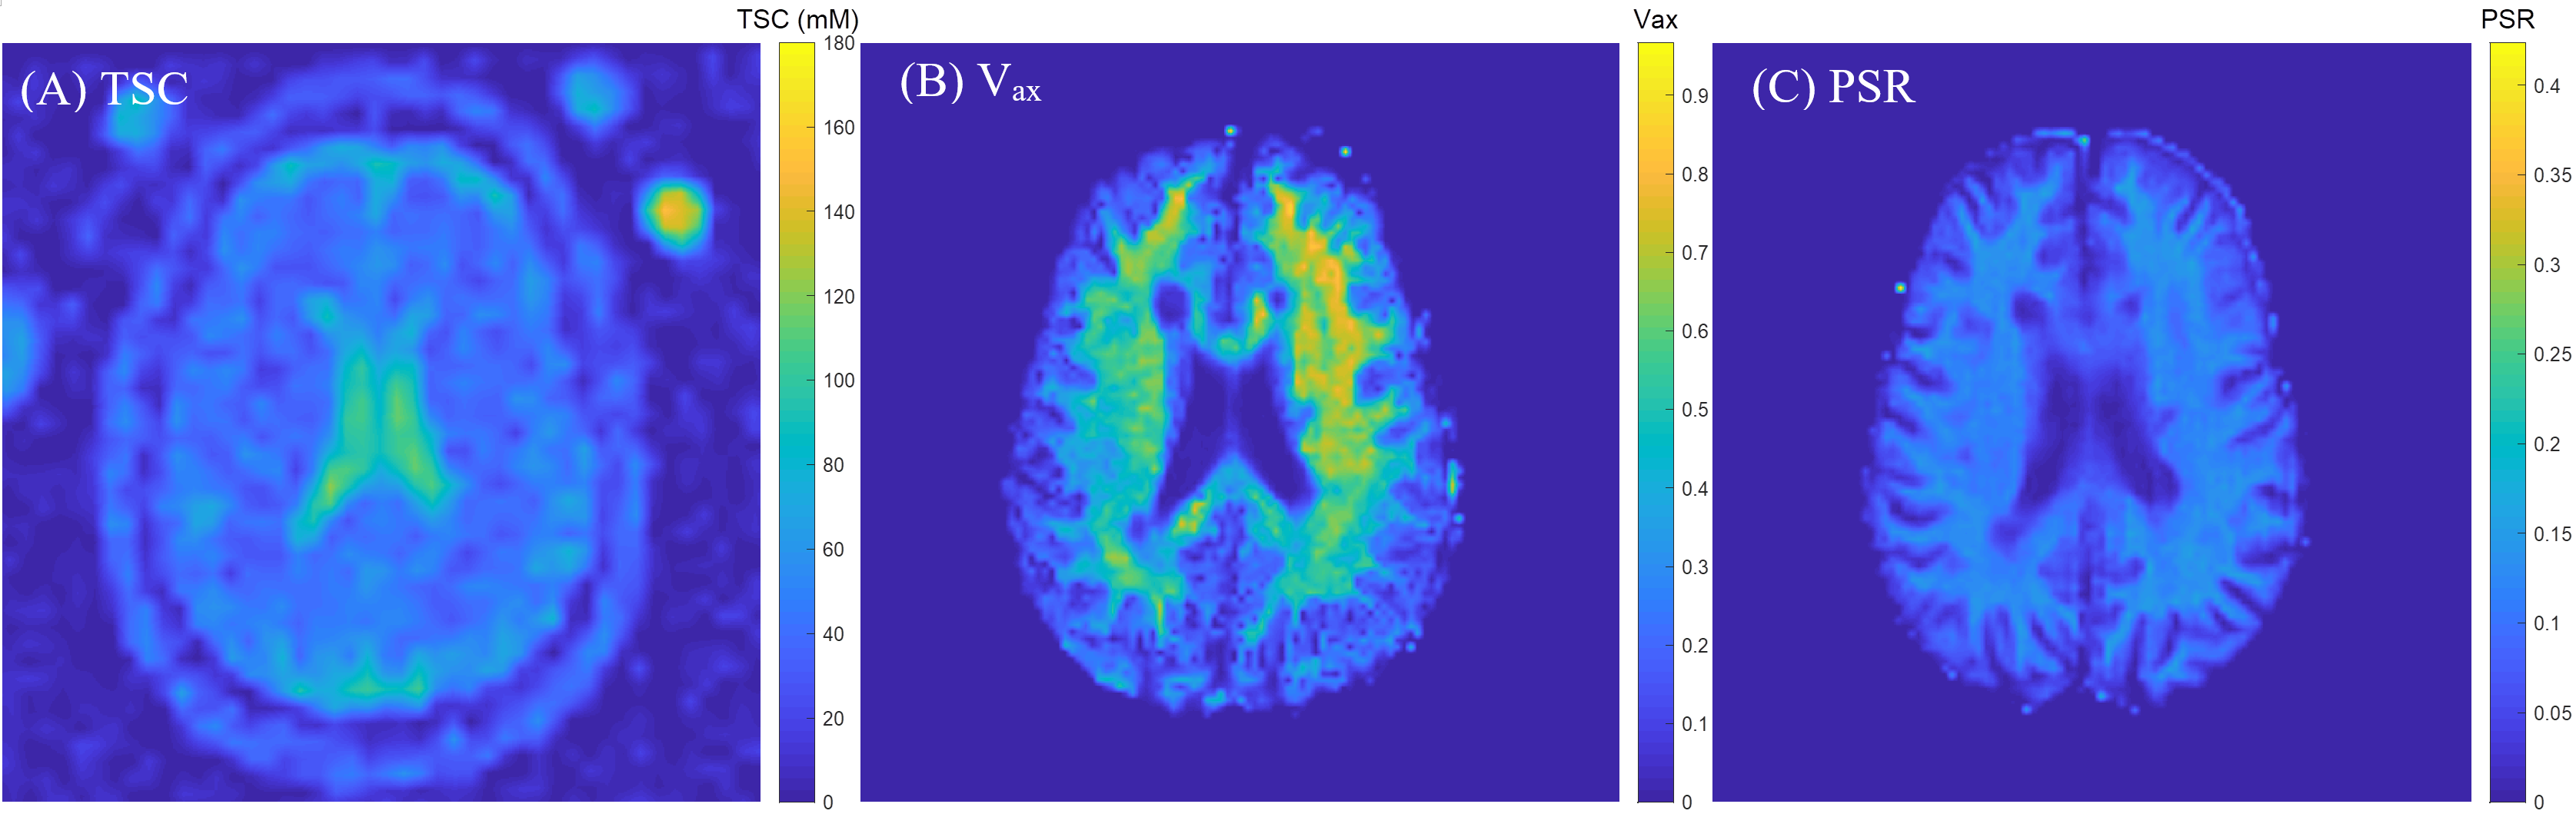
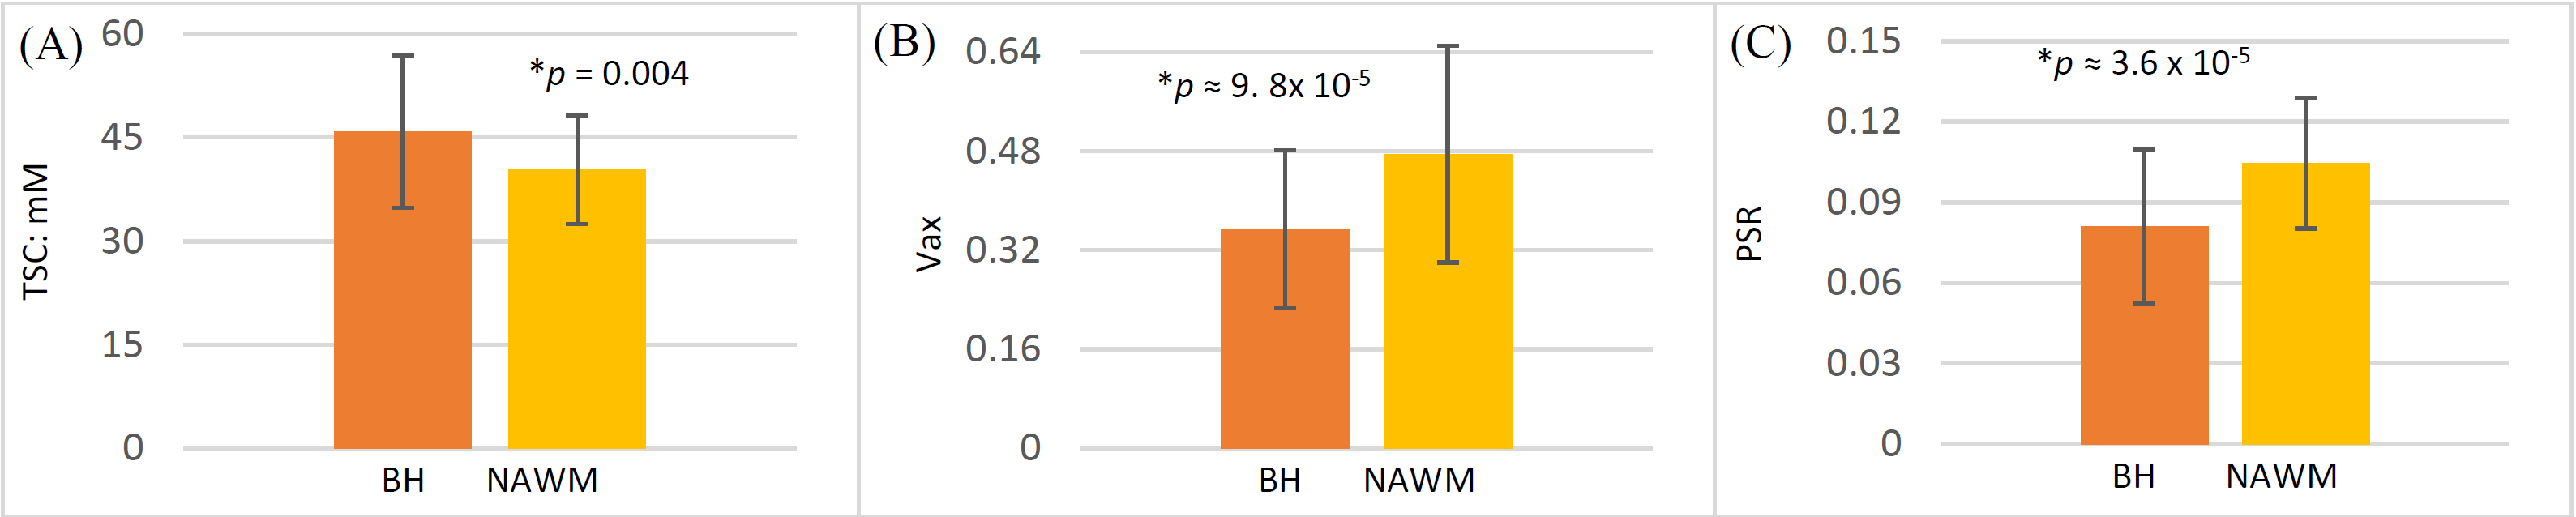
Figure 1 shows typical black holes in an MS patient. Corresponding TSC, Vax, and PSR maps are displayed in Figure 2, with all images registered to the FLAIR. The statistical analysis is given in Figure 3, showing the significant differences of TSC, Vax, and PSR between BHs and the contralateral NAWMs.Discussion
This preliminary study showed significant difference of TSC, Vax, and PSR between BHs and the contralateral NAWMs, which potentially offers information for the early detection and assessment of therapeutic interventions in MS before the generation of stable, irreversible axonal damage. It should be noted that each of the imaging techniques aims to quantify a specific feature, with sodium to report axonal Na+/K+pump dysfunction and sodium channel redistribution, Vax to reflect the axon loss, and PSR the degree of demyelination. It is expected that higher TSC, lower Vax and PSR are in BHs than in NAWMs. Higher TSC is likely an indicator of axonal metabolism dysfunction that leads to elevated sodium level in the axoplasm and/or an expansion of the extracellular space due to axonal loss, which is consistent with the lower Vax in black holes. The lower PSR in BHs may suggest more severe demyelination. Future work will focus on the evaluation in a large cohort of patients (including follow-up patients), as well as the development of alternative sodium MRI capable of selective assessment of intracellular sodium that is more indicative of physiopathology.Acknowledgements
N/AReferences
1.Compston A, Coles A. Multiple sclerosis. Lancet. 2008; 372(9648): 1502-1517.
2.Sahraian MA, Radue E-W, Haller S, et al. Black holes in multiple sclerosis: definition, evolution, and clinical correlations. Acta Neurol Scand. 2010; 122(1): 1-8.
3.SimonJH, JacobsL, SimonianN. T1-Hypointense Lesions (T1Black Holes) in Mild-to-Moderate Disability Relapsing Multiple Sclerosis. In: Hommes OR, Comi G, editors. Early Indicators Early Treatments Neuroprotection in Multiple Sclerosis. Springer Milan. 2004; pp 135-139.
4.Mahad D, Lassmann H, Turnbull D. Mitochondria and disease progression in multiple sclerosis. Neuropathol Appl Neurobiol. 2008; 34(6): 577-589.
5.Petracca M, Fleysher L, Oesingmann N, et al. Sodium MRI of multiple sclerosis. NMR Biomed. 2016; 29(2): 153-161.
6.Kaden E, Kelm ND, Carson RP, et al. Multi-compartment microscopic diffusion imaging. Neuroimaging. 2016; 139(1): 346-359.
7.By S, Xu J, Box B, Bagnato F, et al. Multi-compartmental diffusion characterization of the human cervical spinal cord in vivo using the spherical mean technique. NMR Biomed. 2018;31(4): 1-12.
8.Dortch R, Li K, Gochberg D, Welch EB, et al. Quantitative Magnetization Transfer Imaging in Human Brain at 3T via Selective Inversion Recovery. Magn Reson Med. 2011; 66(5): 1346-1352.
9.Levesque I, Sled JG, Narayanan S, et al. The role of edema and demyelination in chronic T1black holes: a quantitative magnetization transfer study. J Magn Reson Imaging. 2005; 21(2): 103-110.
Figures