3302
Quantitative Evaluation of Brain Tissue Damage in Multiple Sclerosis with SMART (Simultaneous Multi-Angular Relaxometry of Tissue) MRI1Department of Chemistry, Washington University in St. Louis, St. Louis, MO, United States, 2Department of Radiology, Washington University in St. Louis, Saint Louis, MO, United States, 3Division of Biostatistics, Washington University in St. Louis, Saint Louis, MO, United States, 4Department of Neurology, Washington University in St. Louis, Saint Louis, MO, United States
Synopsis
Quantitative MRI would be beneficial in evaluating tissue damage in Multiple Sclerosis (MS), but existing quantitative techniques are not yet widely used. Recently developed SMART MRI technique generates quantitative magnetization transfer and MR relaxometry data from a single protocol. Herein we present data suggesting that the SMART metrics can serve as biomarkers for MS tissue damage. Our results showed that SMART metrics readily distinguish RRMS from progressive MS subtypes, and correlate with clinical assessments of MS patients. These data suggest that SMART MRI is a highly promising technique for MS monitoring, and for use as an endpoint in clinical trials.
Introduction
Multiple sclerosis (MS) is a chronic disease damaging white and gray matter (WM, GM) of the central nervous system, causing disability in many. Quantitative MRI (magnetization transfer (MT), MR relaxometry and diffusion)(1-4) could play an important role in evaluating tissue damage in MS, but their value has not been realized in clinical practice. Recently developed a novel technique, SMART MRI, generates quantitative MT and MR relaxometry data from a single protocol(5). In this study, we demonstrate that SMART metrics might serve as biomarkers of WM and GM tissue damage in MS patients.Method
All studies were approved by the Washington University IRB. Twenty-two progressive and eleven relapsing-remitting MS (RRMS) patients were recruited. MRI data were collected using a 3T Trio MRI scanner (Siemens, Erlangen, Germany) equipped with a 32-channel phased-array head coil. SMART data of voxel size 1x1x1 mm3 were acquired using a three dimensional multi-gradient-echo sequences with five flip angles α(5,10,20,40,60°) and three gradient echoes (echo times 2.3,6.2,10.1ms) for each α. A phase-based B1 mapping technique accounting for the effects of imperfect RF spoiling and magnetization relaxation was implemented(6). Data were analyzed on a voxel-by-voxel basis using the theoretical model that takes into account cross-relaxation effects between “free” (intra- and extra-cellular) and “bound” (attached to macromolecules) water(5):
S(α,TR,TE)=S0·(1-exp(-R1·TE)–kf’·TR·α2/(λ·(γ·τ·TR)+α2))·sinα·exp(-R2*·TE)·F(TE)/(1-exp(-R1·TE)·cosα);
R1=R1(f)+kf’; kf’= kf·(1+kb/R1(b))-1; λ=R2(b)·(R1(b)+kf); kf=K·BPF; kb=K·(1-BPF);
In these equations S0 is a spin density of free water; F(TE) represents the part of the signal decay due to the macroscopic field inhomogeneities (herein we use a voxel spread function (VSF) approach to compensate this effect)(7); superscripts/subscripts “f” and “b” indicate “free” and “bound” water, respectively, R1, R2 and k are longitudinal, transverse and cross-relaxation rates constants respectively; τ is the RF pulse duration, the factor ν depends on the RF pulse shape. BPF is the bound proton fraction and K is the exchange rate between the bounded and free pools. was fixed as 16 ms-1(8) and R1(b)<< kb was assumed to generate the BPF map.
Tissue damage defined by SMART metrics in cortical GM and subcortical WM were examined for correlations with MS Functional Composite (MSFC), Expanded Disability Status Scale (EDSS), 25-foot timed walk (25FTW), nine-hole peg test (9HPT), paced auditory serial addition tests (PASAT) and Symbol Digit Modality tests (SDMT). Analyses were done in the statistical program R, with age and gender as covariates. False discovery rate was used to adjust for multiple comparisons.
Results
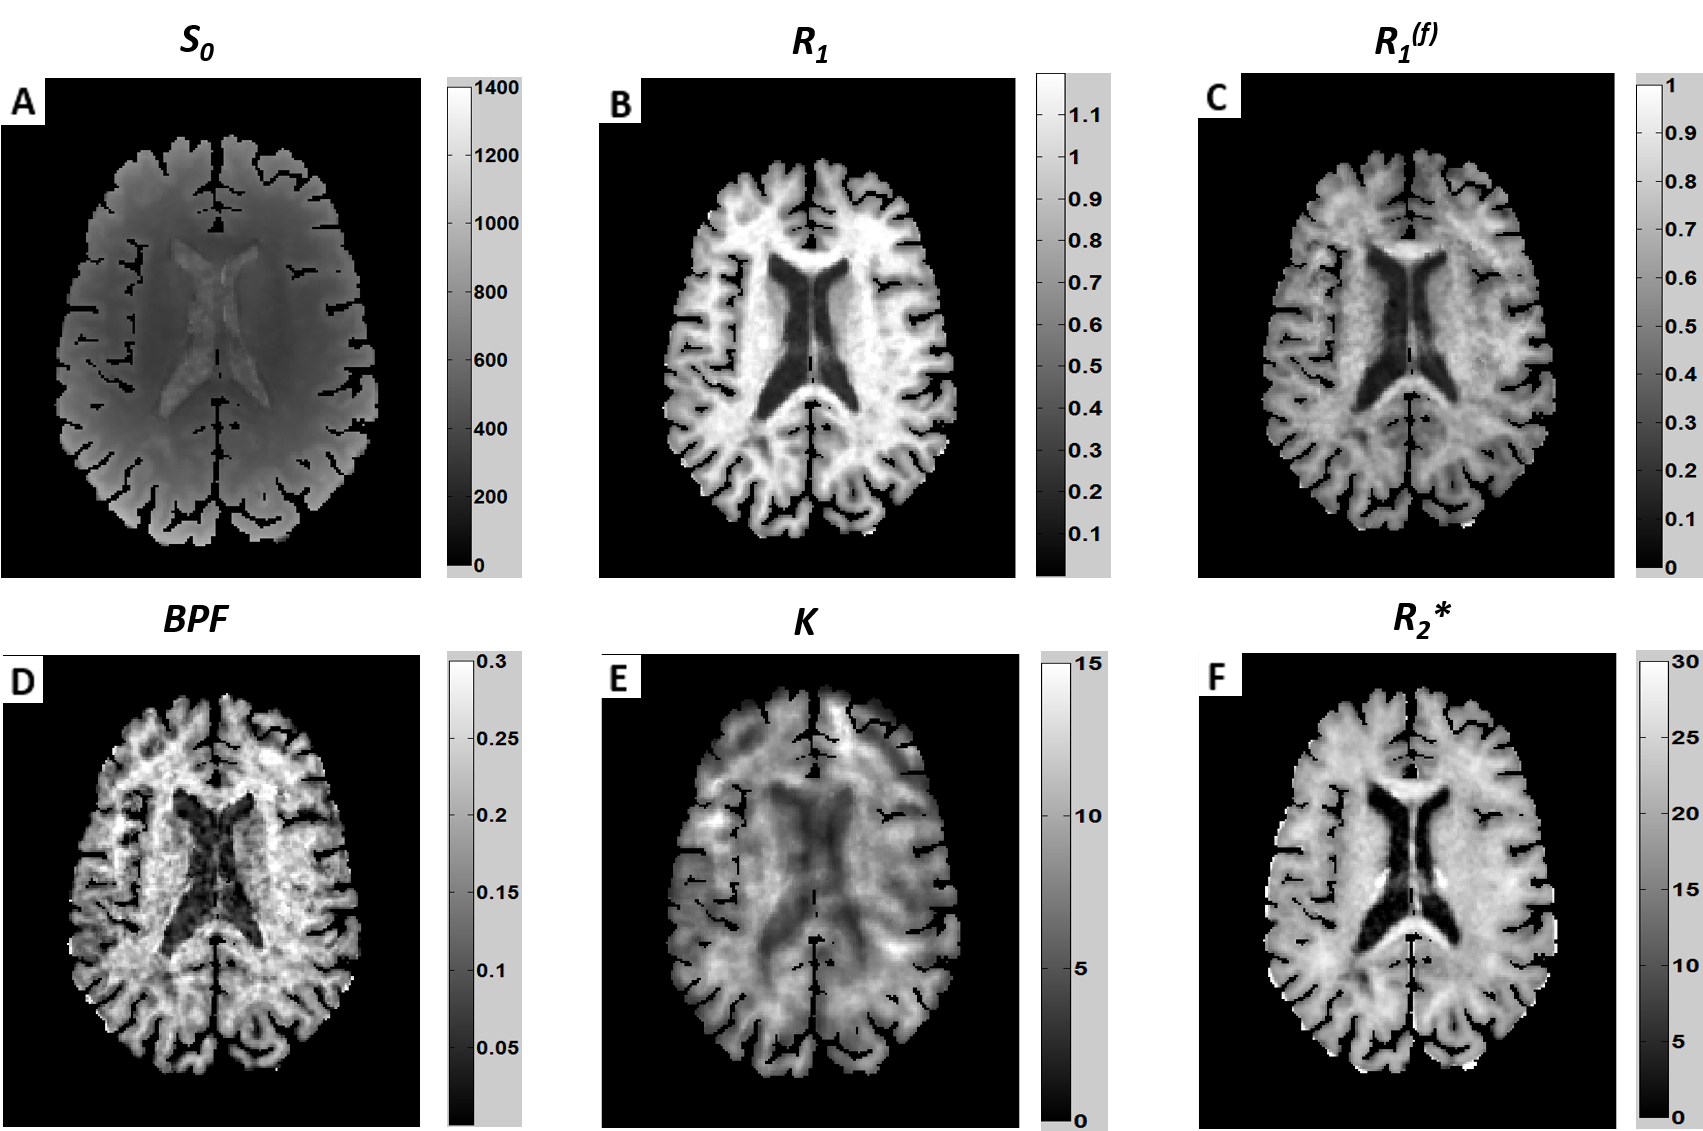
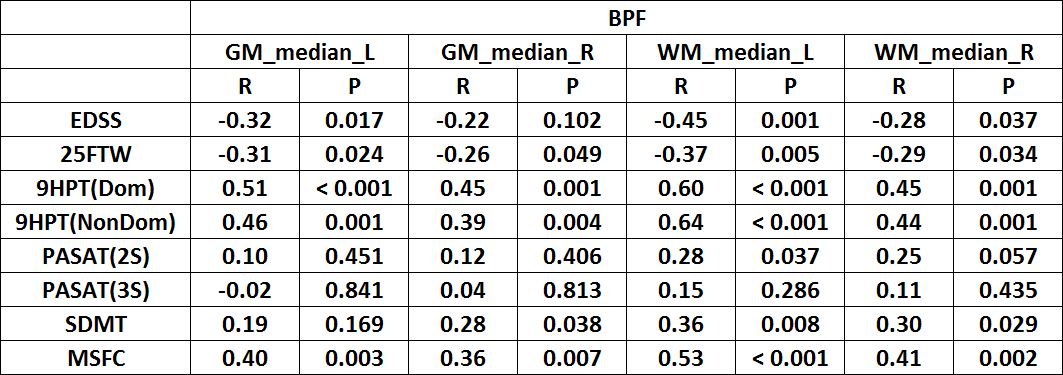
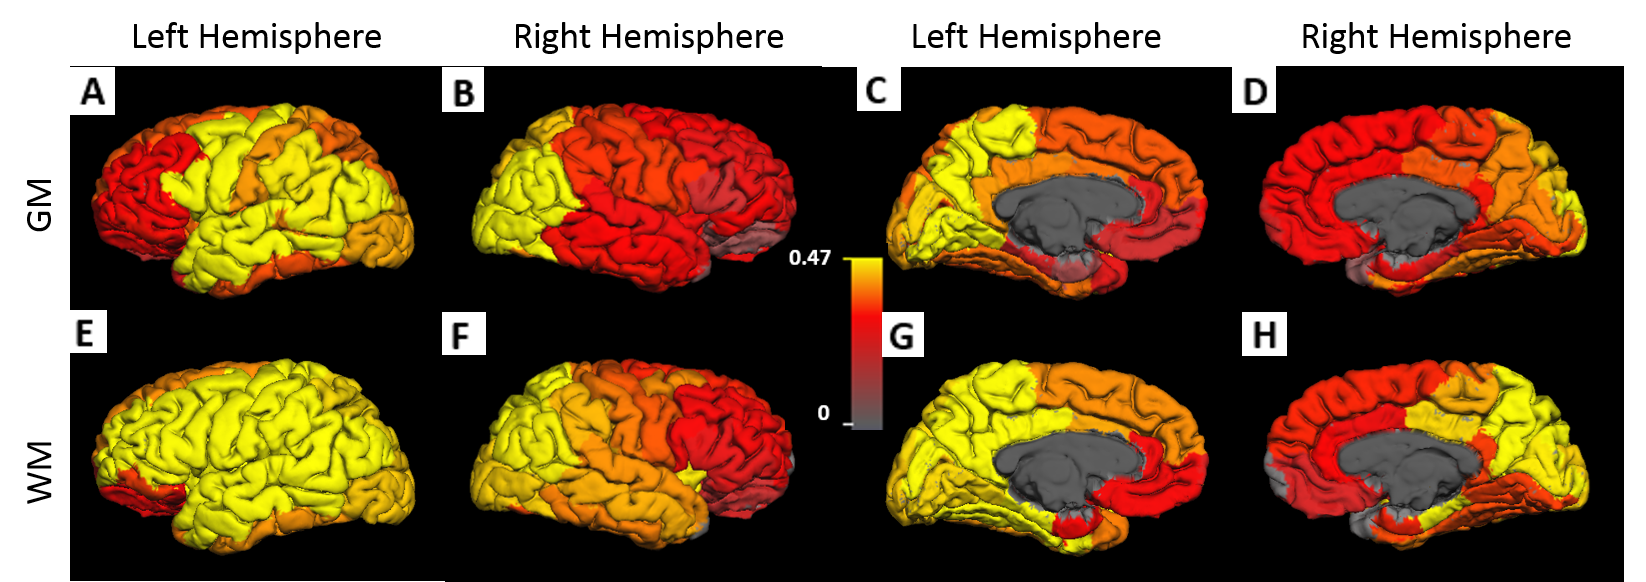
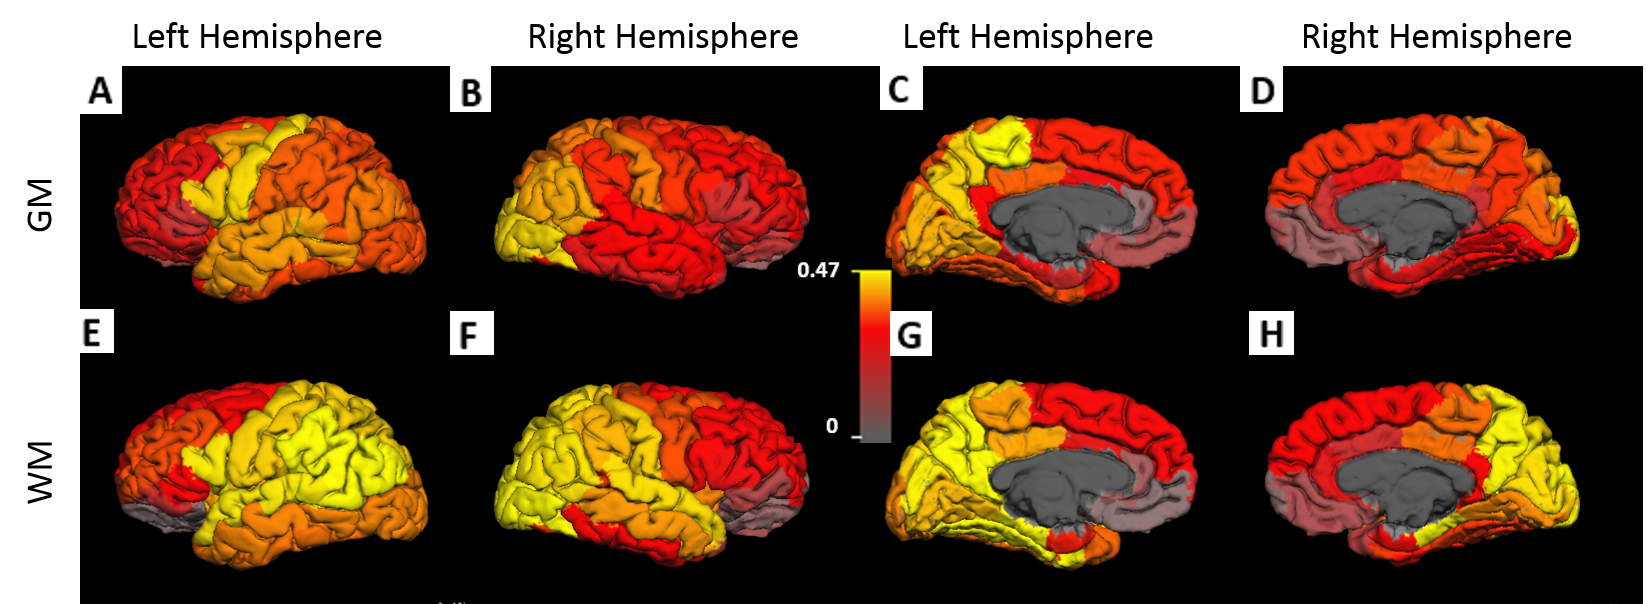
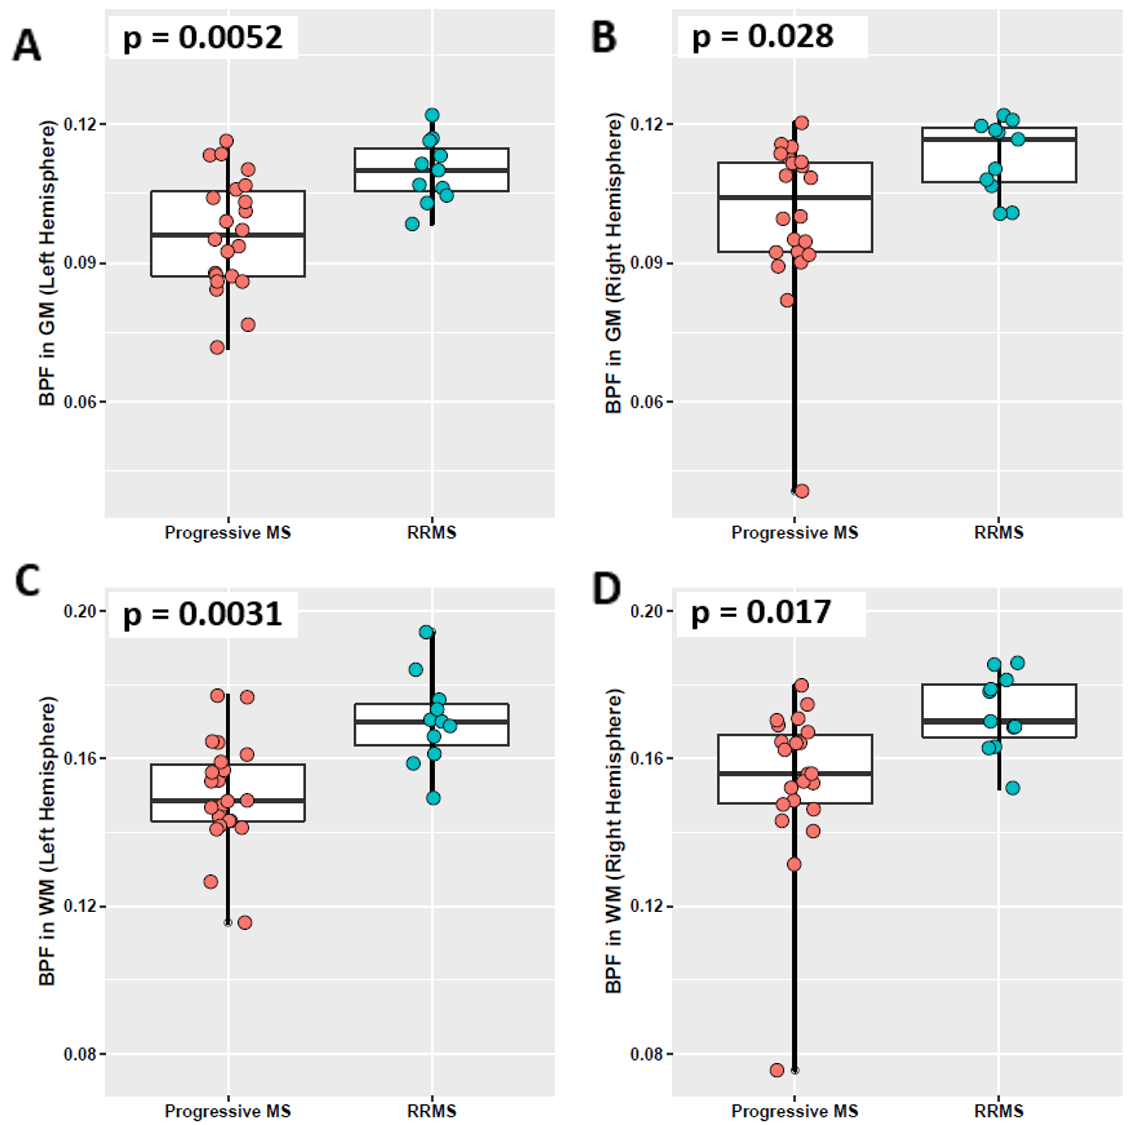
Examples of S0, R1, R1(f), BPF, K and R2* maps for a RRMS patient are shown in Figure 1. BPF measurements had several significant correlations with motor related clinical assessments (Fig. 2). BPF measurements in subcortical WM demonstrated greater correlation with clinical tests than cortical GM BPF. In both WM and GM, BPF in the left hemisphere showed greater correlations than in the right hemisphere with clinical assessments. Unlike BPF, quantitative R1 and R2* metrics showed significant correlation only with cognitive-related clinical test PASAT in GM (r=0.49, p=0.001; r=0.40, p=0.017, respectively) and in WM (r=0.41, p=0.010; r=0.40, p=0.017, respectively). Region-wise correlation analysis were performed between 9HPT, MSFC and BPF measurements (Fig. 4 &5). Interestingly, the left hemisphere showed higher correlation than right hemisphere when assessing correlations between MSFC, 9HPT and BPF. Additionally, in most of the ROIs, BPF in WM had greater correlation with clinical assessments than in GM. BPF measurements in both left and right hemispheres of GM and WM differentiated relapsing-remitting from progressive groups (Fig. 5). BPF in left hemisphere of subcortical WM showed the best separation between the two subtypes.
Discussion
The SMART technique generates naturally co-registered quantitative maps: R1, R1(f), BPF, K and R2*. These MRI metrics obtained using SMART technique allow assessment of relaxation (T1, T2*) properties of “free” and “bound” water as well as exchange between them in a single experiment. Our BPF measurement, which is in agreement with previous studies(9), appears to be directly related to the integrity of myelin structure. The correlations between clinical tests and BPF in WM were higher than in GM consistent with greater WM myelin content than GM. Additionally, BPF in left hemisphere correlates better with motor-related clinical assessments than in right hemisphere. In this study 90% of the subjects were right-handed. One of the possible explanations for this finding is that tissue damage in the dominant hemisphere has more global effects on motor function.Conclusion
The SMART MRI metrics showed significant correlations with clinical motor assessments in MS patients and distinguished RRMS from progressive MS subtypes at a group level. These findings indicate potential for this technique for monitoring MS patients clinically and in treatment trials.Acknowledgements
The studies were funded by grant from The Conrad N. Hilton Foundation (20140257). Anne H. Cross and Dmitriy A. Yablonskiy hold a Marilyn Hilton Award for Innovation in MS Research from the Conrad N. Hilton Foundation.References
1. Pike GB, Stefano ND, Narayanan S, Worsley KJ, Pelletier D, Francis GS, Antel JP, Arnold DL. Multiple Sclerosis: Magnetization Transfer MR Imaging of White Matter before Lesion Appearance on T2-weighted Images. Radiology 2000;215(3):824-830.
2. Li DKB, Held U, Petkau J, Daumer M, Barkhof F, Fazekas F, Frank JA, Kappos L, Miller DH, Simon JH, Wolinsky JS, Filippi M. MRI T2 lesion burden in multiple sclerosis. A plateauing relationship with clinical disability 2006;66(9):1384-1389.
3. Asaf A, Evan S, Anat A. Injury to white matter tracts in relapsing–remitting multiple sclerosis: A possible therapeutic window within the first 5 years from onset using diffusion-tensor imaging tract-based spatial statistics. NeuroImage: Clinical 2015;8:261-266.
4. Yarnykh VL, Bowen JD, Samsonov A, Repovic P, Mayadev A, Qian P, Gangadharan B, Keogh BP, Maravilla KR, Henson LKJ. Fast Whole-Brain Three-dimensional Macromolecular Proton Fraction Mapping in Multiple Sclerosis. Radiology 2015;274(1):210-220.
5. Sukstanskii AL, Wen J, Cross AH, Yablonskiy DA. Simultaneous multi-angular relaxometry of tissue with MRI (SMART MRI): Theoretical background and proof of concept. Magnetic resonance in medicine : official journal of the Society of Magnetic Resonance in Medicine / Society of Magnetic Resonance in Medicine 2016.
6. Wen J, Sukstanskii AL, Yablonskiy DA. Phase-sensitive B1 mapping: Effects of relaxation and RF spoiling. Magnetic resonance in medicine : official journal of the Society of Magnetic Resonance in Medicine / Society of Magnetic Resonance in Medicine 2018;80(1):101-111.
7. Yablonskiy DA, Sukstanskii AL, Luo J, Wang X. Voxel spread function method for correction of magnetic field inhomogeneity effects in quantitative gradient-echo-based MRI. Magnetic resonance in medicine : official journal of the Society of Magnetic Resonance in Medicine / Society of Magnetic Resonance in Medicine 2013;70(5):1283-1292.
8. van Gelderen P, Duyn JH. White matter intercompartmental water exchange rates determined from detailed modeling of the myelin sheath. Magnetic resonance in medicine : official journal of the Society of Magnetic Resonance in Medicine / Society of Magnetic Resonance in Medicine 2018.
9. West KL, Kelm ND, Carson RP, Gochberg DF, Ess KC, Does MD. Myelin volume fraction imaging with MRI. NeuroImage 2018;182:511-521.
Figures