3301
Myelin measurements using GRASE and mcDESPOT are strongly correlated with those from Multi-Echo Spin-Echo myelin water imaging in postmortem Multiple Sclerosis tissue1Neurology, University of British Columbia, Vancouver, BC, Canada, 2Medicine, University of Calgary, Calgary, AB, Canada, 3Radiology, University of British Columbia, Vancouver, BC, Canada, 4Pathology & Laboratory Medicine, University of British Columbia, Vancouver, BC, Canada, 5Neuroscience, Lerner Research Institute, Cleveland Clinic, Cleavland, OH, United States
Synopsis
We compared myelin water fraction (MWF) results from the gold standard multi-spin-echo (MSE) sequence to two accelerated techniques: gradient-and-spin-echo (GRASE), and multicomponent-driven equilibrium single pulse observation of T1/T2 (mcDESPOT) in a formalin-fixed multiple sclerosis brain. All three techniques were sensitive to differences in myelin throughout the sample, with MSE and GRASE producing equivalent MWF values. mcDESPOT estimated significantly higher MWF in both normal appearing white matter and lesion compared to MSE and GRASE. However, the MWF was strongly correlated (p<0.0001) between all three methods (r=0.88 for MSE vs. GRASE; r=0.89 for MSE vs. mcDESPOT; r=0.89 for GRASE vs. mcDESPOT).
Introduction:
The myelin sheath is a plasma membrane composed of concentric layers of myelin wrapped radially around portions of an axon. Numerous disorders manifest with demyelination in the central nervous system; in particular multiple sclerosis (MS), for which demyelination is a hallmark feature1. Techniques that quantitatively map myelin (multi-echo spin echo (MSE)2, gradient and spin echo (GRASE)3, and multicomponent-driven equilibrium single pulse observation of T1/T1 (mcDESPOT)4) have been used to study demyelinating diseases. While MSE has been extensively validated as a marker for myelin5, the accelerated GRASE and the rapid steady-state imaging-based mcDESPOT myelin water imaging techniques have not been explored in postmortem human tissue. The goal of this study was to determine whether myelin water fraction (MWF) estimates produced by GRASE and mcDESPOT are comparable to MWF results from the gold standard MSE technique in formalin-fixed brain.Methods:
Acquisition: 3T data (Achieva, Philips Medical Systems) was acquired from one formalin-fixed MS brain sample using an 8 channel SENSE head coil: (1) MSE (32 echoes, 10ms echo spacing, TR=1200ms, 1 average, acquisition time 16:07); (2) GRASE (32 echoes, 10ms echo spacing, TR=1073ms, 2 gradient echoes per spin echo, 8 averages, acquisition time 23:41); (3) mcDESPOT (SPGR, TE/TR= 3.7/7.7ms, flip angles=[3,4,5,6,7,8,9,10,11,12,13,14,15,17,19,21,24,27,31]°; bSSFP (with 0° and 180° RF phase-cycling patterns6), TE/TR=3.5/7.0ms, flip angles=[5,7,9,11,13,15,17,19,21,23,25,28,31,35,40,45,50,55,60,64]°; inversion-prepared SPGR, inversion delays=250,350,450,550ms, TR=7.6ms at 5° to correct for flip angle errors; acquisition time 25:497). All experiments had 6 slices and voxel size 1x1x4mm, reconstructed to 0.75x0.75x2mm.
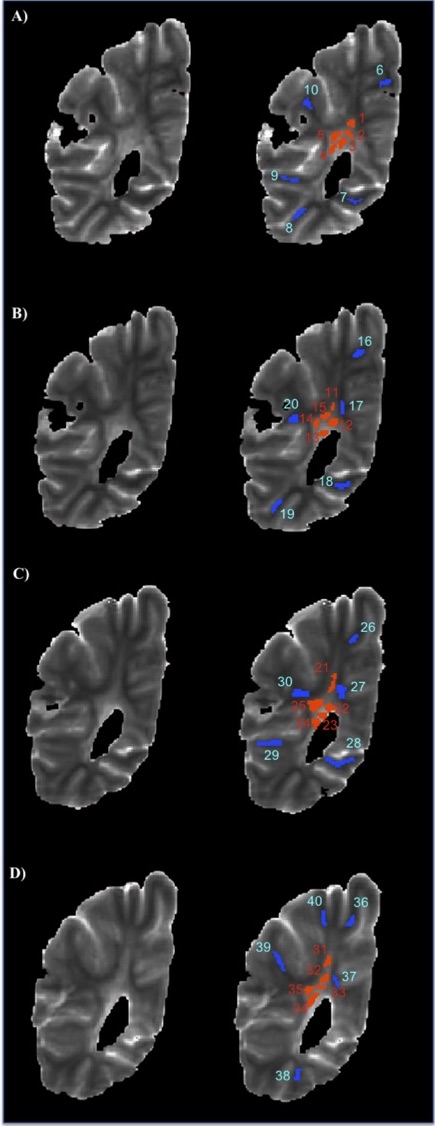
Analysis: Images were processed using in house software [MATLAB 2012b, The MathWorks Inc.]. The T2 distribution was determined by analyzing the multi-echo decay curves using NNLS with stimulated echo correction8,9 for MSE and GRASE. mcDESPOT fitting was performed using Despot1-HIFI10, Despot2-FM11, and the stochastic region contraction algorithm12 which requires boundaries for the T1 and T2 of myelin water (T1M and T2M) and intra/extracellular water (T1IE and T2IE), MWF, and the exchange rate between myelin and IE water. These were set for this fixed tissue sample as follows: 200ms≤T1M≤ 550ms; 600ms≤ T1IE≤ 5000ms; 1ms≤T2M≤30ms; 30ms≤T2IE≤165 ms; 0.00000001ms≤MWFD≤0.50ms. Exchange was assumed to be too long to affect the model. A brain parenchymal mask was created by excluding artifacts along the edges of the brain slice. 40 regions of interest (ROIs) were drawn by a single observer on the T2 maps obtained from the Despot1 and Despot2 analyses in white matter (20 in normal appearing white matter ROIs; 20 lesion ROIs) (Figure 1). For each ROI the mean MWF for MSE (MWFSE), GRASE (MWFG), and mcDESPOT (MWFD) was determined. Inter-sequence agreement of MWF across the 40 ROIs between techniques was determined using Pearson’s correlation ratio and linear regression (assuming Gaussian distribution), and Bland-Altman analysis13.
Results:
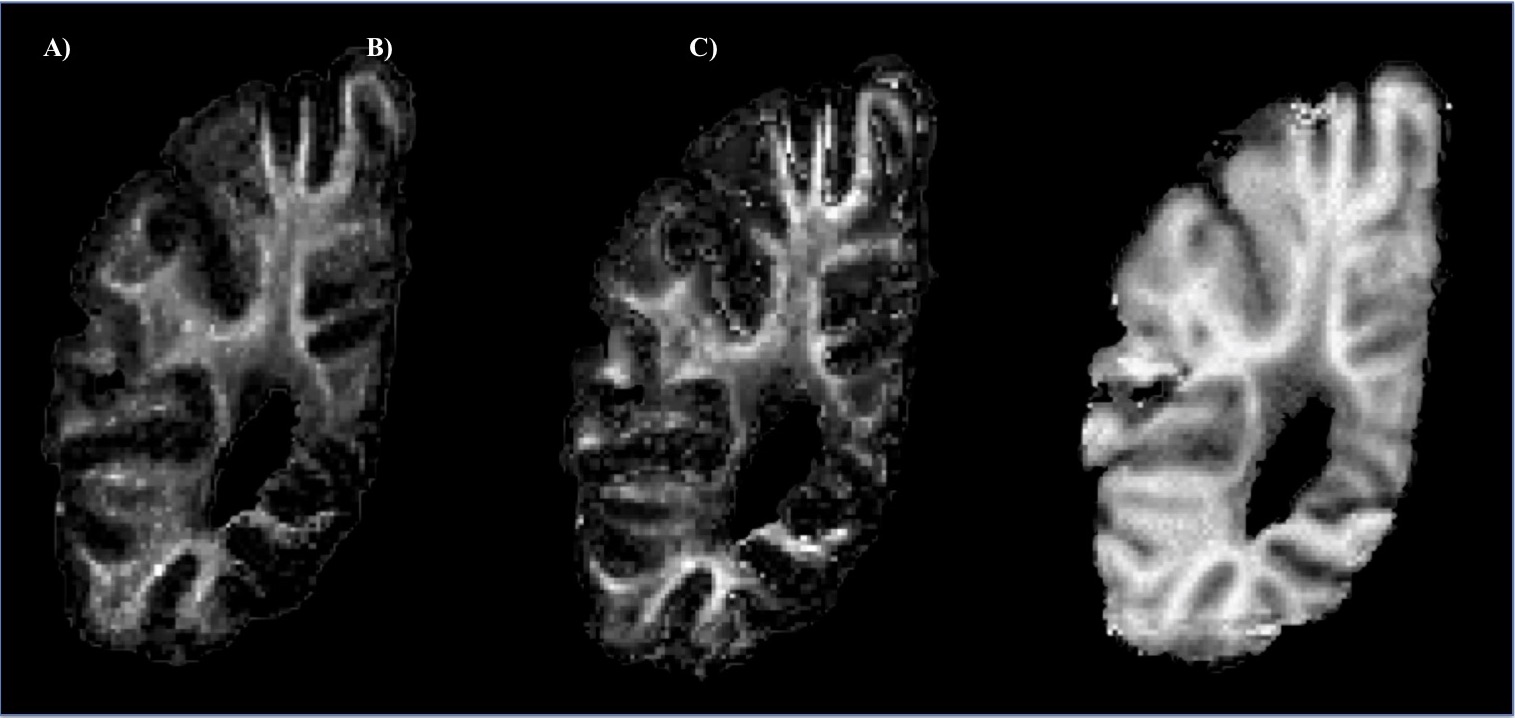
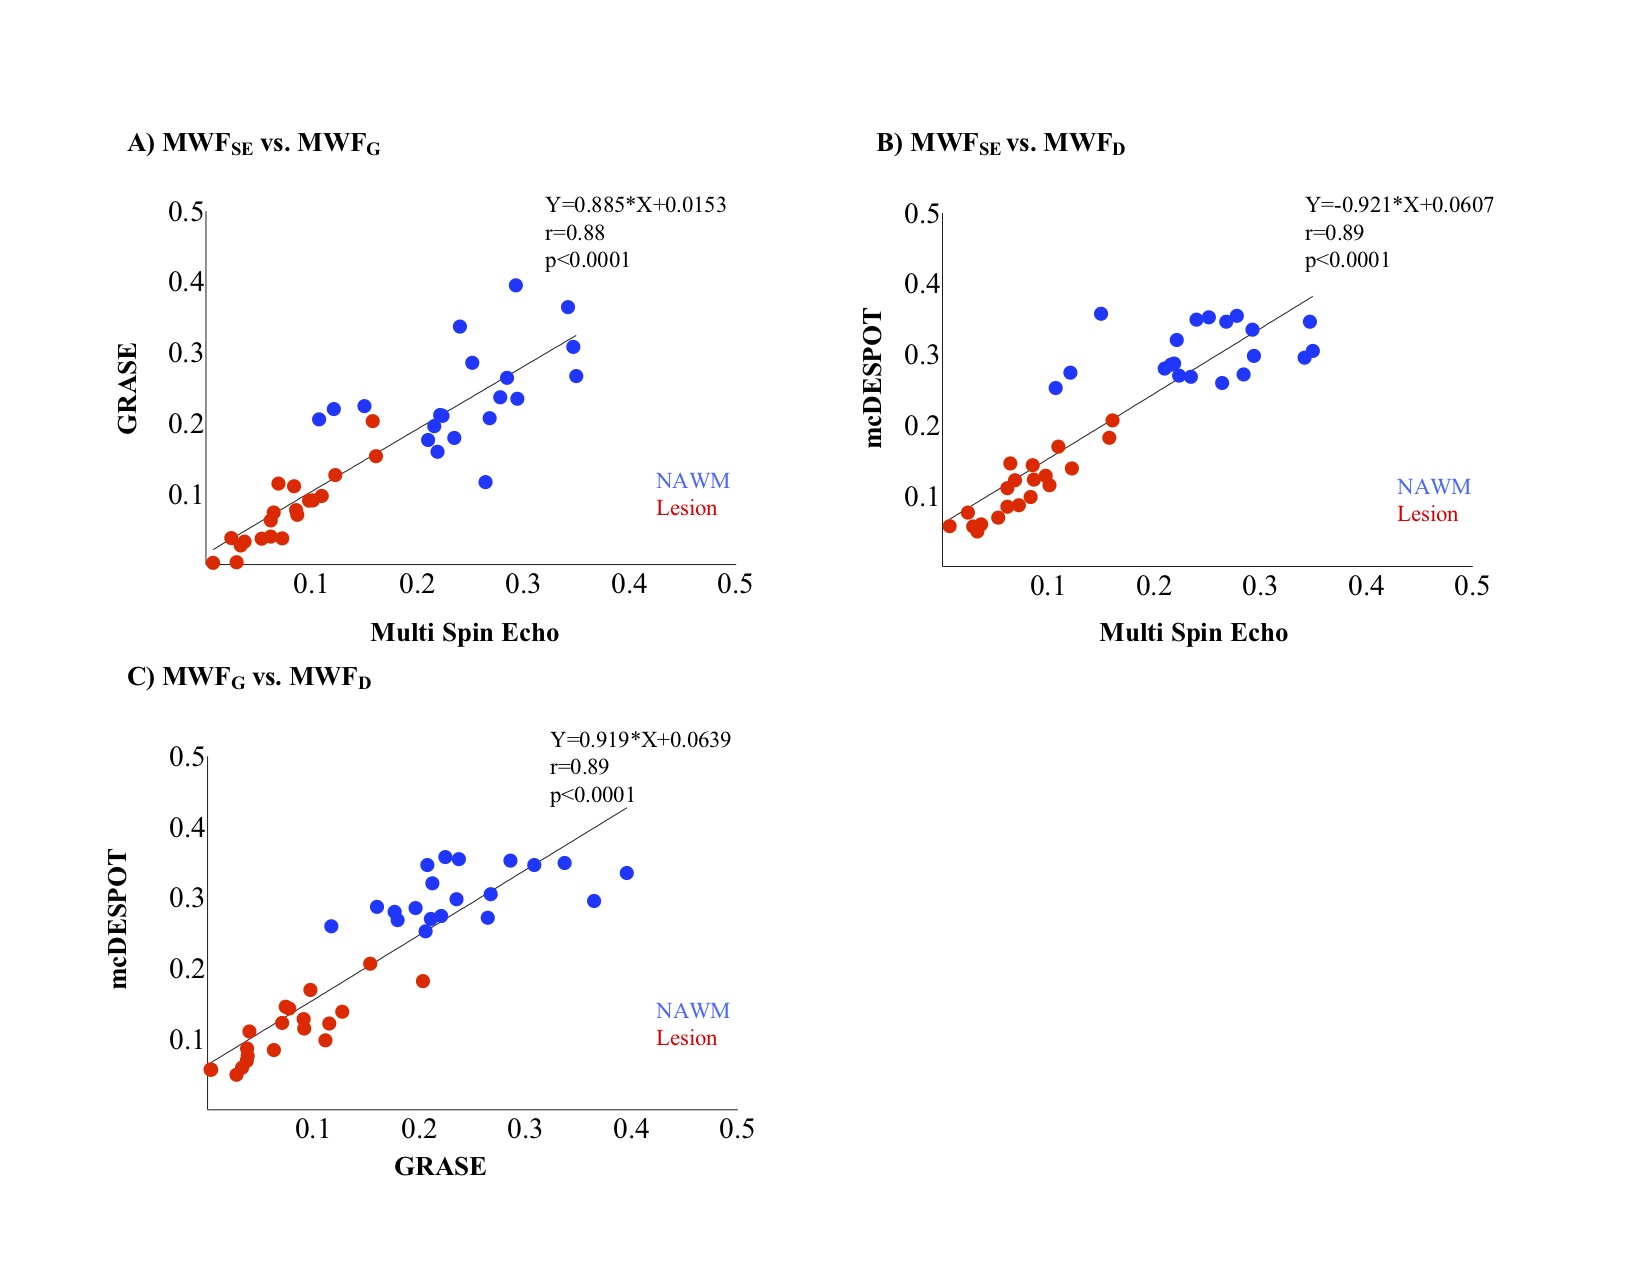
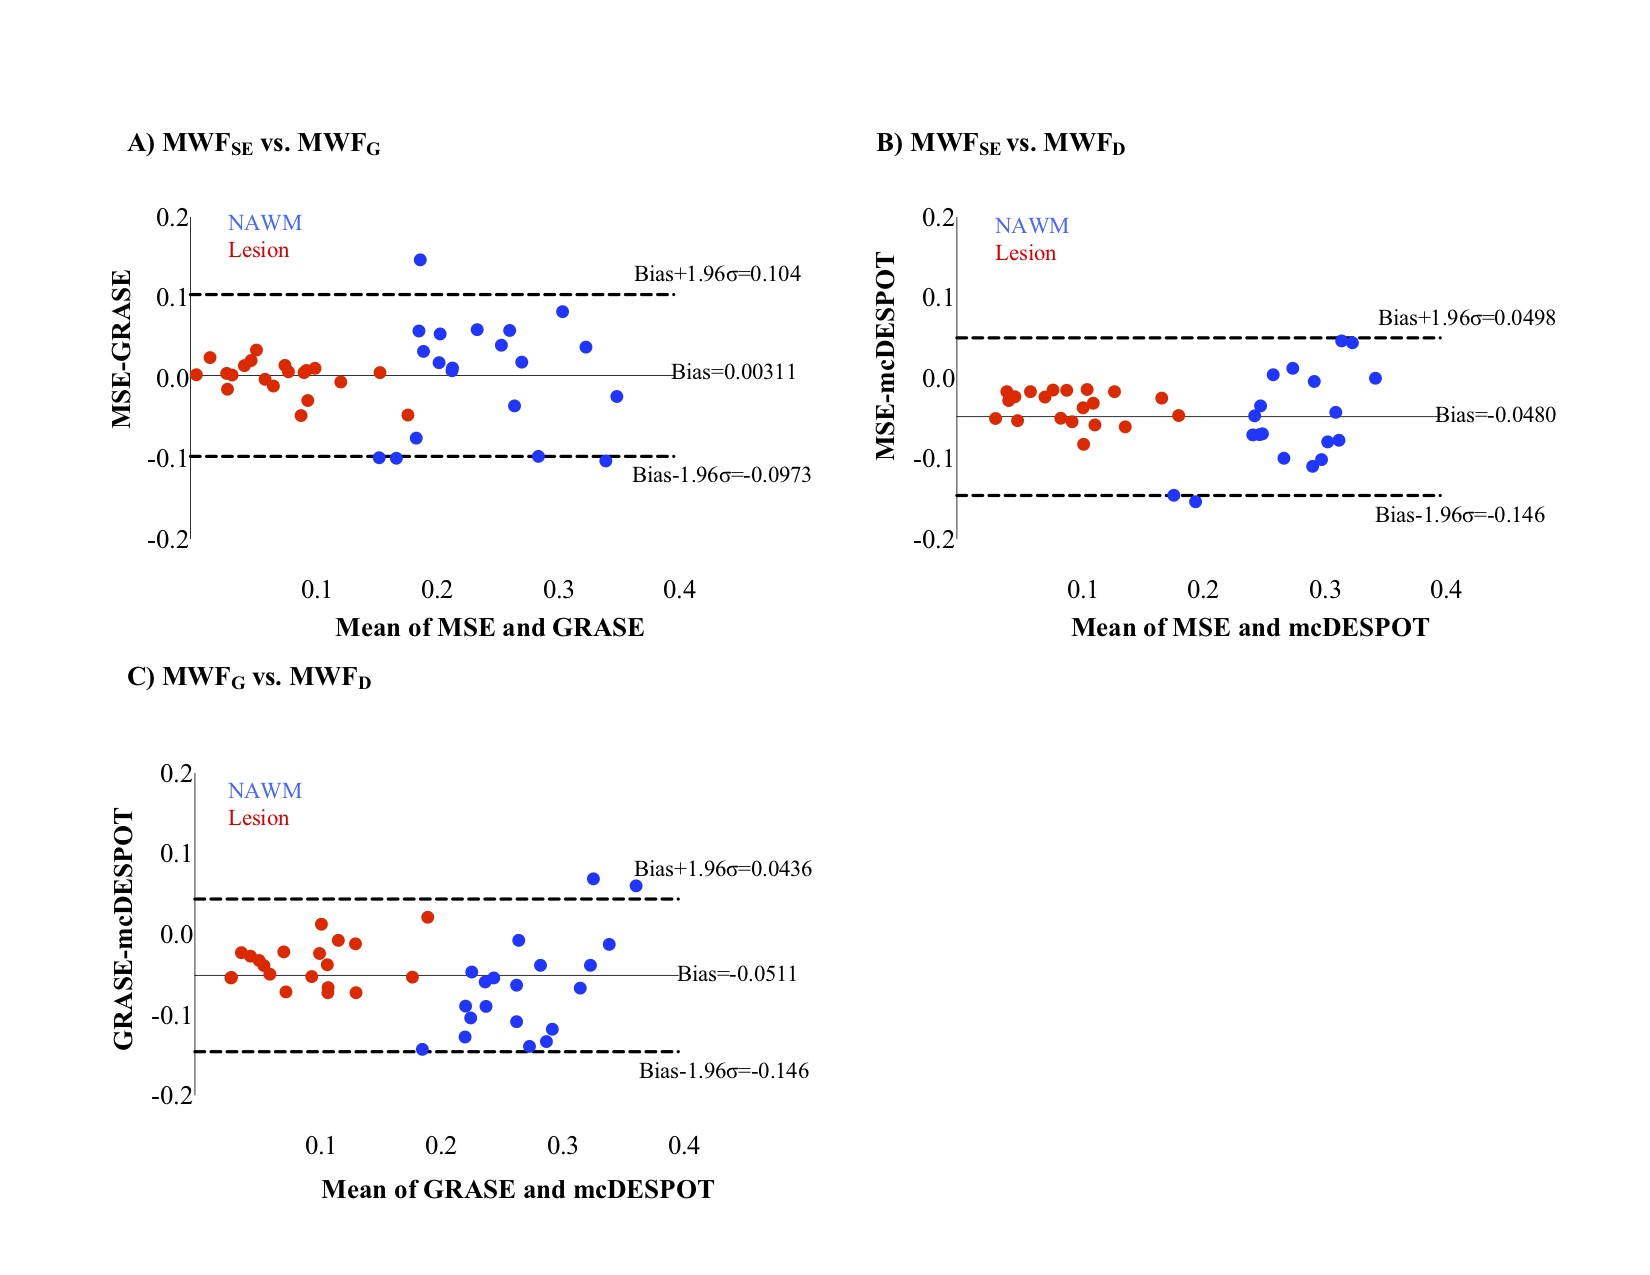
All three techniques were sensitive to myelin across the sample (Figure 2), with MSE and GRASE producing equivalent MWF estimates. mcDESPOT estimated significantly higher MWF in both normal appearing white matter (p<0.0001) and lesion (p=0.004) compared to MSE and GRASE. Although MWF was higher using mcDESPOT than the multi-component T2 relaxation techniques, MWF values from all three methods were significantly correlated (p<0.0001) with each other (MWFG vs MWFSE: r = 0.88; MWFD vs MWFSE: r = 0.89; MWFD vs MWFG: r = 0.89) (Figure 3). When separating white matter into distinct tissue types, lesion MWF correlated strongly across all techniques (MWFG vs. MWFSE: r=0.91; MWFD vs MWFSE: r=0.90; MWFD vs MWFG: r=0.90), while the normal appearing white matter MWF was more varied and had a lower correlation (MWFG vs. MWFSE: r=0.48; MWFD vs MWFSE: r=0.29; MWFD vs MWFG: r=0.51). We compared the difference in MWF as a function of the intersequence mean across the ROIs using Bland-Altman plots, which showed good agreement between the techniques with no significant slope (Figure 4). The bias was +0.0031 for MWFG vs. MWFSE, -0.048 for MWFD vs MWFSE, and -0.051 for MWFD vs. MWFG.Conclusion:
Noninvasive quantitative mapping of myelin has broad clinical applications in neurological diseases, and using myelin measures in postmortem tissue can provide useful insights into the associated pathology of such diseases. Further, this controlled environment can be used to compare results from accelerated myelin water imaging techniques to the gold standard approach. This study demonstrates that in postmortem tissue, MWF values from MSE, GRASE, and mcDESPOT acquisitions are highly correlated with each other over the whole brain and in MS lesions, with lesser correlations in normal appearing white matter. Overall, this study demonstrates similar impacts of different levels of myelin or demyelination on the three approaches.
Acknowledgements
No acknowledgement found.References
1. Popescu BF and Lucchinetti CF. Pathology of demyelinating diseases. Annu Rev Pathol 2012; 7: 185-217. 2012/02/09. DOI: 10.1146/annurev-pathol-011811-132443.
2. MacKay A, Whittall K, Adler J, et al. In vivo visualization of myelin water in brain by magnetic resonance. Magn Reson Med 1994; 31: 673-677. 1994/06/01.
3. Prasloski T, Rauscher A, MacKay AL, et al. Rapid whole cerebrum myelin water imaging using a 3D GRASE sequence. Neuroimage 2012; 63: 533-539. 2012/07/11. DOI: 10.1016/j.neuroimage.2012.06.064.
4. Deoni SC, Rutt BK, Arun T, et al. Gleaning multicomponent T1 and T2 information from steady-state imaging data. Magn Reson Med 2008; 60: 1372-1387. 2008/11/26. DOI: 10.1002/mrm.21704.
5. Laule C, Leung E, Lis DK, et al. Myelin water imaging in multiple sclerosis: quantitative correlations with histopathology. Mult Scler 2006; 12: 747-753. 2007/02/01.
6. Deoni SC, Matthews L and Kolind SH. One component? Two components? Three? The effect of including a nonexchanging "free" water component in multicomponent driven equilibrium single pulse observation of T1 and T2. Magn Reson Med 2013; 70: 147-154. 2012/08/24. DOI: 10.1002/mrm.24429.
7. Deoni SC. Correction of main and transmit magnetic field (B0 and B1) inhomogeneity effects in multicomponent-driven equilibrium single-pulse observation of T1 and T2. Magn Reson Med 2011; 65: 1021-1035. 2011/03/18. DOI: 10.1002/mrm.22685.
8. Whittall KP and MacKay AL. Quantitative interpretation of NMR relaxation data. Journal of Magnetic Resonance (1969) 1989; 84: 134-152. DOI: https://doi.org/10.1016/0022-2364(89)90011-5.
9. Prasloski T, Madler B, Xiang QS, et al. Applications of stimulated echo correction to multicomponent T2 analysis. Magn Reson Med 2012; 67: 1803-1814. 2011/10/21. DOI: 10.1002/mrm.23157.
10. Deoni SC. Correction of main and transmit magnetic field (B0 and B1) inhomogeneity effects in multicomponent-driven equilibrium single-pulse observation of T1 and T2. Magn Reson Med 2011; 65: 1021-1035. 2011/03/18. DOI: 10.1002/mrm.22685.
11. Deoni SC. Transverse relaxation time (T2) mapping in the brain with off-resonance correction using phase-cycled steady-state free precession imaging. J Magn Reson Imaging. 2009 Aug;30(2):411-7. doi: 10.1002/jmri.21849.
12. Deoni SC and Kolind SH. Investigating the stability of mcDESPOT myelin water fraction values derived using a stochastic region contraction approach. Magn Reson Med 2015; 73: 161-169. 2014/01/28. DOI: 10.1002/mrm.25108.
13. Bland JM and Altman DG. Statistical methods for assessing agreement between two methods of clinical measurement. Lancet 1986; 1: 307-310. 1986/02/08.
Figures