3298
Longitudinal changes in diffusion basis spectrum imaging metrics of normal-appearing white matter and lesions in ocrelizumab-treated relapsing multiple sclerosis1Medicine, University of British Columbia, Vancouver, BC, Canada, 2Physics, Martin-Luther University Halle-Wittenberg, Halle (Saale), Germany, 3Radiology, University of British Columbia, Vancouver, BC, Canada, 4Physics and Astronomy, University of British Columbia, Vancouver, BC, Canada, 5International Cooperation on Repair Discoveries (ICORD), University of British Columbia, Vancouver, BC, Canada, 6Pathology and Laboratory Medicine, University of British Columbia, Vancouver, BC, Canada, 7School of Biomedical Engineering, University of British Columbia, Vancouver, BC, Canada, 8School of Medicine, Washington University, St. Louis, MO, United States, 9Genentech, Inc., South San Francisco, CA, United States
Synopsis
Diffusion Basis Spectrum Imaging (DBSI) probes axonal and myelin damage by modeling the diffusion-weighted MRI signal as discrete anisotropic diffusion tensors while simultaneously differentiating and quantifying inflammation and edema through a modeled isotropic diffusion tensor spectrum. We studied 15 RMS patients beginning ocrelizumab treatment over two years as well as 10 healthy controls.
DBSI detected microstructural differences between RMS normal-appearing white matter, chronic and enhancing lesions, and healthy control white matter. Further, the metrics were sensitive to changes within two years of follow-up and showed improvement towards healthy control values in patients treated with ocrelizumab.
Introduction
Coexisting pathologies in multiple sclerosis (MS) such as inflammation, demyelination and axonal injury/loss confound interpretation of conventional, and many quantitative, MRI techniques, preventing pathologically specific assessment of the underlying tissue damage.
Diffusion Basis Spectrum Imaging (DBSI) probes myelin damage and axonal injury/loss by modeling the diffusion-weighted MR signal as discrete anisotropic diffusion tensors while simultaneously differentiating and quantifying inflammation and edema through a modeled isotropic diffusion tensor spectrum1-3.
Compared with conventional diffusion tensor imaging, metrics derived from DBSI analysis include improved estimates of axial and radial diffusivity (AD, RD) and fractional anisotropy (FA), now labeled fiber AD, fiber RD and fiber FA, as measures of axon and myelin integrity. DBSI provides additional fractional metrics related to extra-cellular water content (hindered fraction), apparent cellularity (restricted fraction) and apparent fiber density (fiber fraction); these metrics have been validated using autopsy specimens from MS patients and experimental autoimmune encephalomyelitis2-4.
In this study we applied DBSI longitudinally over two years in a cohort of relapsing MS (RMS) patients beginning treatment with ocrelizumab. We hypothesized that this potent anti-inflammatory therapy would be associated with stability or improvement in DBSI imaging biomarkers in normal-appearing white matter (NAWM) and lesions.
Methods
Subjects: 15 RMS patients participating in a substudy of a phase IIIb clinical trial (NCT02545868) had advanced 3T MRI (Philips Achieva 3.0T, Best, Netherlands) prior to and 1 and 2 years after initiation of ocrelizumab treatment. 10 healthy controls (HC) were scanned once (Table 1).
Acquisition: The acquisition protocol consisted of an echo-planar diffusion weighted sequence with 99 diffusion encoding directions for DBSI (range of b-values 0-1500s/mm2, TR 4943ms, TE 85ms, voxel size 2x2x2mm3, 40 slices), and a 3D T1-weighted MPRAGE sequence (TE 3.5ms, TR 7.8ms, TI 817ms, shot TR 1800ms, voxel size 1x1x1mm3). MRI for MS participants also included FLAIR and a post-gadolinium T1-weighted sequence for lesion identification.
Analysis: Diffusion data was eddy-current corrected and analyzed using a matlab package developed in-house to calculate maps of hindered and restricted fractions, fiber fraction, fiber FA, fiber AD and fiber RD. Restricted diffusion was defined as isotropic apparent diffusion coefficients ≤ 0.3 μm2/ms. Images and maps were registered to the corresponding structural baseline image. Lesions were manually delineated by two experienced researchers as chronic (stable and not gadolinium enhancing at all timepoints) and enhancing (25 lesions in 4 patients, gadolinium enhancing at baseline with the same ROI for follow-up timepoints). WM masks were created from 3D T1-weighted images using FAST5. Mean values in HC normal white matter (NWM), MS NAWM, chronic and enhancing lesions were calculated. Paired and unpaired t-tests were used for significance testing; because of the exploratory nature of the study no corrections for multiple testing were performed.
Results
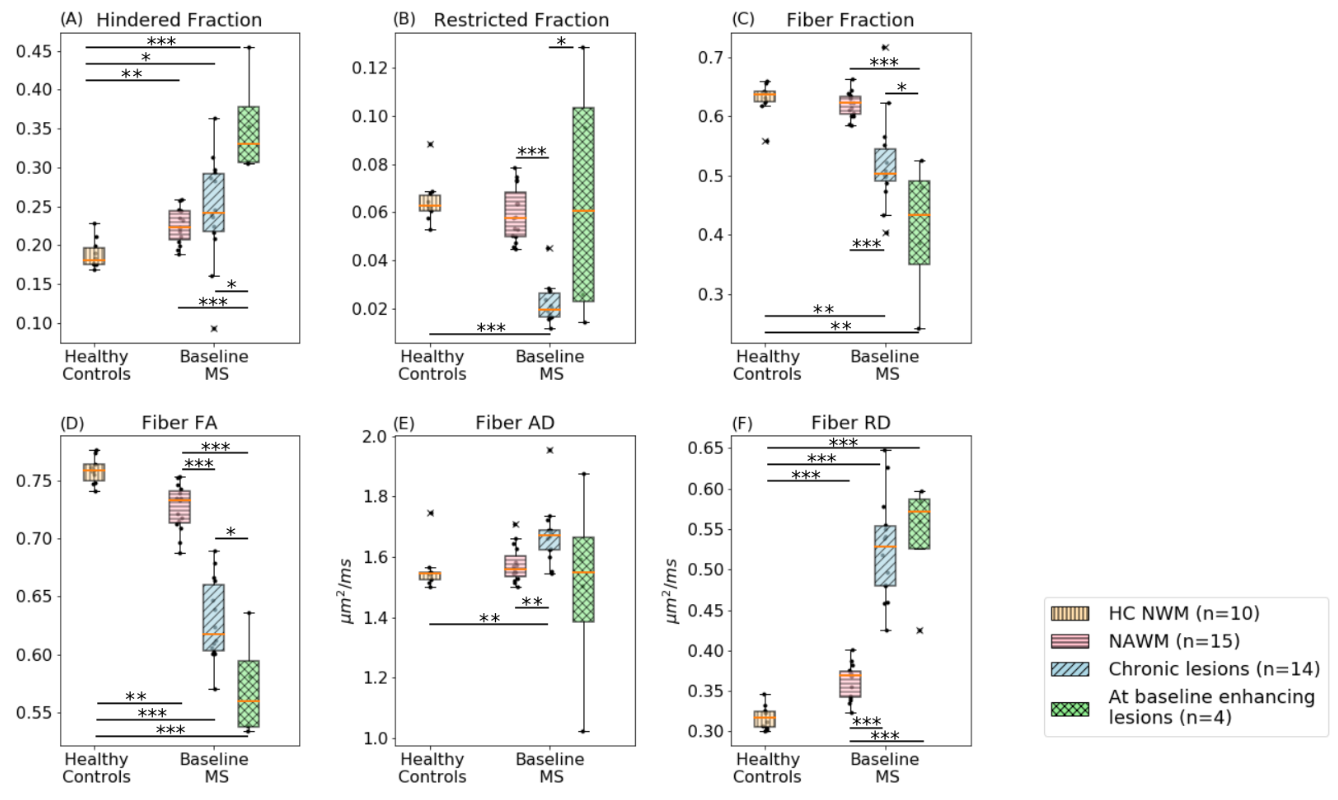
At baseline, RMS NAWM and lesions had increased hindered fraction and fiber RD, altered restricted fraction, and decreased fiber fraction and fiber FA compared to HC NWM (Figure 1).
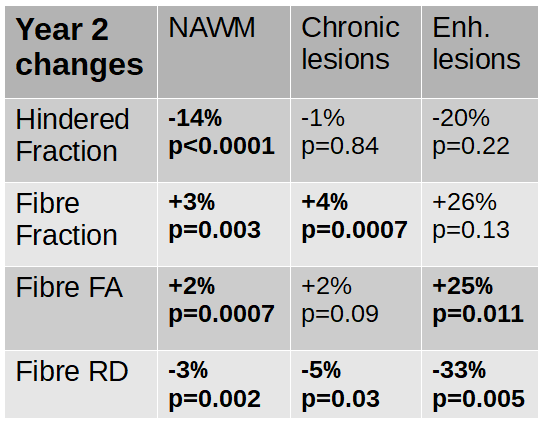
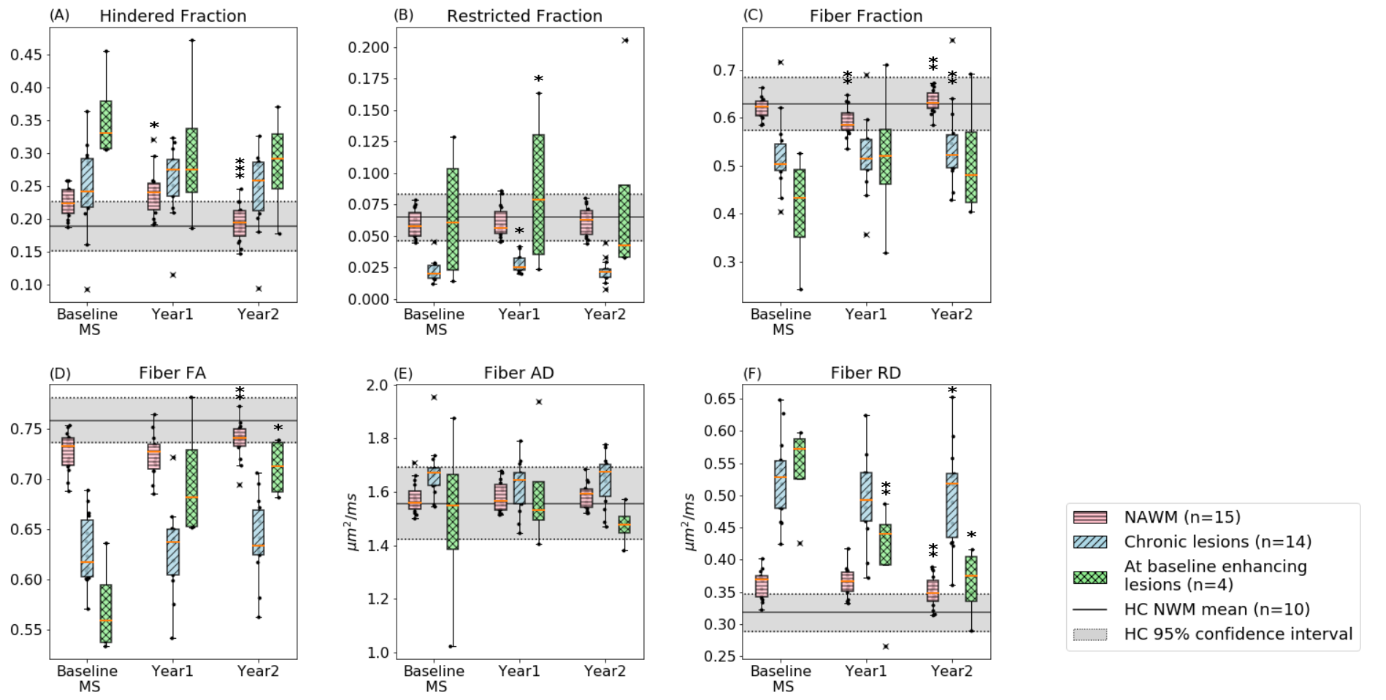
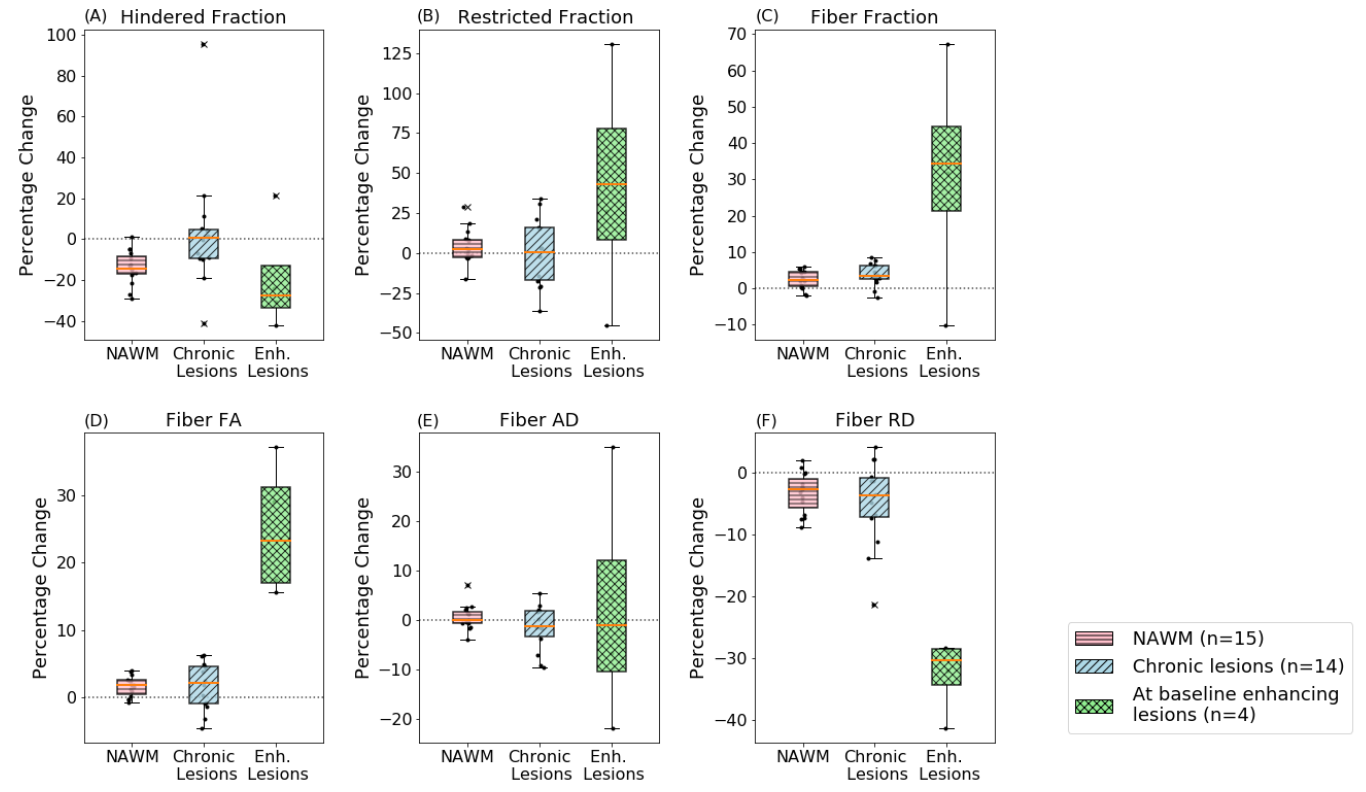
At year two, RMS hindered fraction and fiber RD decreased compared to baseline (-14% and -3% in NAWM, -1% and -5% in chronic lesions, -20% and -33% in enhancing lesions), and fiber fraction and fiber FA increased (+3% and +2% in NAWM, +4% and +2% in chronic lesions, +26% and +25% in enhancing lesions; Table 2, Figures 2 and 3), with values approaching HC measures.
Discussion
Consistent with known MS pathology in NAWM and lesions6,7, as well as prior DTI and smaller DBSI studies3,8,9, DBSI in RMS showed diffuse and focal vasogenic edema and/or increased extra-cellular water (increased hindered fraction), decreased cellularity in chronic lesions (restricted fraction), decreased axonal density (fiber fraction) and diffusion anisotropy (fiber FA), and diffuse and focal myelin damage (increased fiber RD).
Longitudinal DBSI results revealed evidence of decreasing NAWM edema and/or extra-cellular water (hindered fraction), increasing apparent fiber density (fiber fraction) and diffusion anisotropy (fiber FA) in NAWM and lesions, and focal and diffuse myelin repair (decreasing fiber RD).
Conclusion
DBSI is capable of assessing tissue damage in MS NAWM and lesions, and appears to be sensitive to microstructural changes in a relatively small group within two years of follow-up. Longitudinal results showed improvement towards HC values in RMS patients treated with ocrelizumab over two years. These preliminary results demonstrate the potential value of DBSI as an imaging biomarker that could improve the understanding of the mechanism of action of MS therapies beyond the effect of preventing new lesion formation.Acknowledgements
This study was partially funded by F. Hoffmann-La Roche. The authors thank the MS patients, healthy controls and MRI technologists at the UBC MRI Research Centre. Statistical analysis was performed based on the recommendations of the data scientists from the UBC Applied Statistics and Data Science Group and the Statistical Opportunity for Students program.References
1. Wang Y, Wang Q, Haldar JP, et al. Quantification of increased cellularity during inflammatory demyelination. Brain 2011; 134: 3587–3598.
2. Wang X, Cusick MF, Wang Y, et al. Diffusion basis spectrum imaging detects and distinguishes coexisting subclinical inflammation, demyelination and axonal injury in experimental autoimmune encephalomyelitis mice. NMR Biomed. 2014; 27: 843–852.
3. Wang Y, Sun P, Wang Q, et al. Differentiation and quantification of inflammation, demyelination and axon injury or loss in multiple sclerosis. Brain 2015; 138: 1223–1238.
4. Chiang CW, Wang Y, Sun P, et al. Quantifying white matter tract diffusion parameters in the presence of increased extra-fiber cellularity and vasogenic edema. Neuroimage 2014; 101: 310–319.
5. Zhang Y, Brady M, Smith S. Segmentation of brain MR images through a hidden Markov random field model and the expectation-maximization algorithm. IEEE Trans. Med. Imaging 2001; 20: 45–57.
6. Kutzelnigg A, Lucchinetti CF, Stadelmann C, et al. Cortical demyelination and diffuse white matter injury in multiple sclerosis. Brain 2005; 128: 2705–2712.
7. Lassmann H, Van Horssen J, Mahad D. Progressive Multiple Sclerosis: pathology and pathogenesis. Nat. Rev. Neurol. 2012; 8: 647–656.
8. Song SK, Sun SW, Ju WK, et al. Diffusion tensor imaging detects and differentiates axon and myelin degeneration in mouse optic nerve after retinal ischemia. Neuroimage 2003; 20: 1714–1722.
9. Sun SW, Liang HF, Trinkaus K, et al. Noninvasive detection of cuprizone induced axonal damage and demyelination in the mouse corpus callosum. Magn. Reson. Med. 2006; 55: 302–308.
Figures
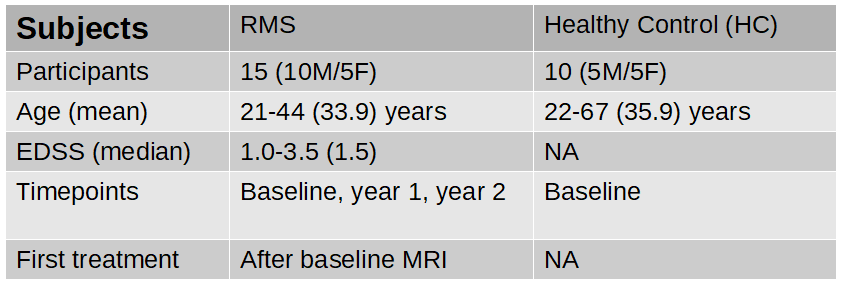
Table 1: Patient and healthy control demographics, MRI and treatment timeline.