3295
Evaluation of white matter integrity in multiple sclerosis using ultra-high gradient diffusion imaging1Radiology, UT Southwestern, Dallas, TX, United States, 2Neurology, MASSACHUSETTS GENERAL HOSPITAL, Boston, MA, United States, 3MASSACHUSETTS GENERAL HOSPITAL, Boston, MA, United States
Synopsis
Conventional MRI of multiple sclerosis lacks specificity for the underlying disease-related processes. The use of ultra-high gradient diffusion imaging increases sensitivity for small caliber axons. When used in combination with myelin-sensitive imaging, estimates of axonal volume fraction (
Introduction
Myelin and axonal damage are thought to be the primary disease processes in multiple sclerosis (MS), with the latter thought to be the substrate of clinical disability. Unfortunately, conventional MRI lacks specificity for these processes. Advances in MRI hardware (ultra-high gradients) and multi-compartment models have allowed for estimations of axonal density within the white matter (NAWM) 1. We recently introduced a method based on the spherical mean framework which circumvents the issue of crossing fibers and dispersion 2 3. When combined with myelin-sensitive imaging, the g-ratio and axonal volume fraction (AVF) can be estimated. In this work, we employed the spherical mean technique (SMT) with macromolecular tissue volume (MTV) to estimate myelin volume fraction (MVF), AVF, and g-ratio for MS lesions, normal appearing white matter (NAWM), and healthy controls (HC) 4 5.Methods
Data Acquisition: 30 MS patients (24 relapsing-remitting, 6 secondary progressive, 1 primary progressive subtype) and 29 age-matched HCs were scanned on a 3T system (Magnetom Connectom; Siemens Healthcare, Erlangen, Germany) with a 64-channel head coil. Diffusion data was acquired using a sagittal 1.5-mm isotropic resolution diffusion-weighted spin echo EPI images with the following parameters: TE/TR = 83/3600 ms, d = 8 ms, Δ=19/49 ms, 8 diffusion gradient increments linearly spaced 30-290 mT/m per Δ, parallel imaging (R=2), simultaneous multislice (MB=2). The diffusion gradients were applied in 64 and 32 non-colinear directions for b-values greater and less than 2300 s/mm2, respectively (maximum b-value 17,800 s/mm2) 6 7. MTV data was acquired using a multiple flip angle (FA) 1-mm isotropic spoiled GRE 3D FLASH sequence (TE/TR = 2.74/20 ms, FA = [4°, 10°, 20°]). Anatomic 1-mm isotropic T2-FLAIR and T1 MEMPRAGE images were also acquired.
Data processing: Diffusion data was corrected for motion, gradient nonlinearity, eddy current distortions and susceptibility artifact using TOPUP and EDDY in FSL. Voxel-wise fitting for hindered diffusion (Dh), restricted (fr) and CSF (fcsf) volume fractions was performed according to the spherical mean model using Markov Chain Monte Carlo (MCMC) sampling. To generate the MTVF maps, the magnitude images from each of the three FAs were skull-stripped and co-registered. M0 and T1 maps were generated using weighted least squares fitting 5. Proton density maps were then calculated, with MTVF determined as MTVF=1-WVF (water volume fraction). Regions of interests (ROIs) in MS lesions were automatically segmented using in-house scripts based on the T2-FLAIR images and manually edited by an experienced neuroradiologist.
Statistical analysis was performed in Stata 12.1. A linear mixed-effects model was developed to test the association between EDSS and the advanced MR imaging metrics of g-ratio, axonal volume fraction, and myelin volume fraction, adjusting for age, sex, and within-patient lesion correlations (i.e., lesions from the same person are not independent).
Results
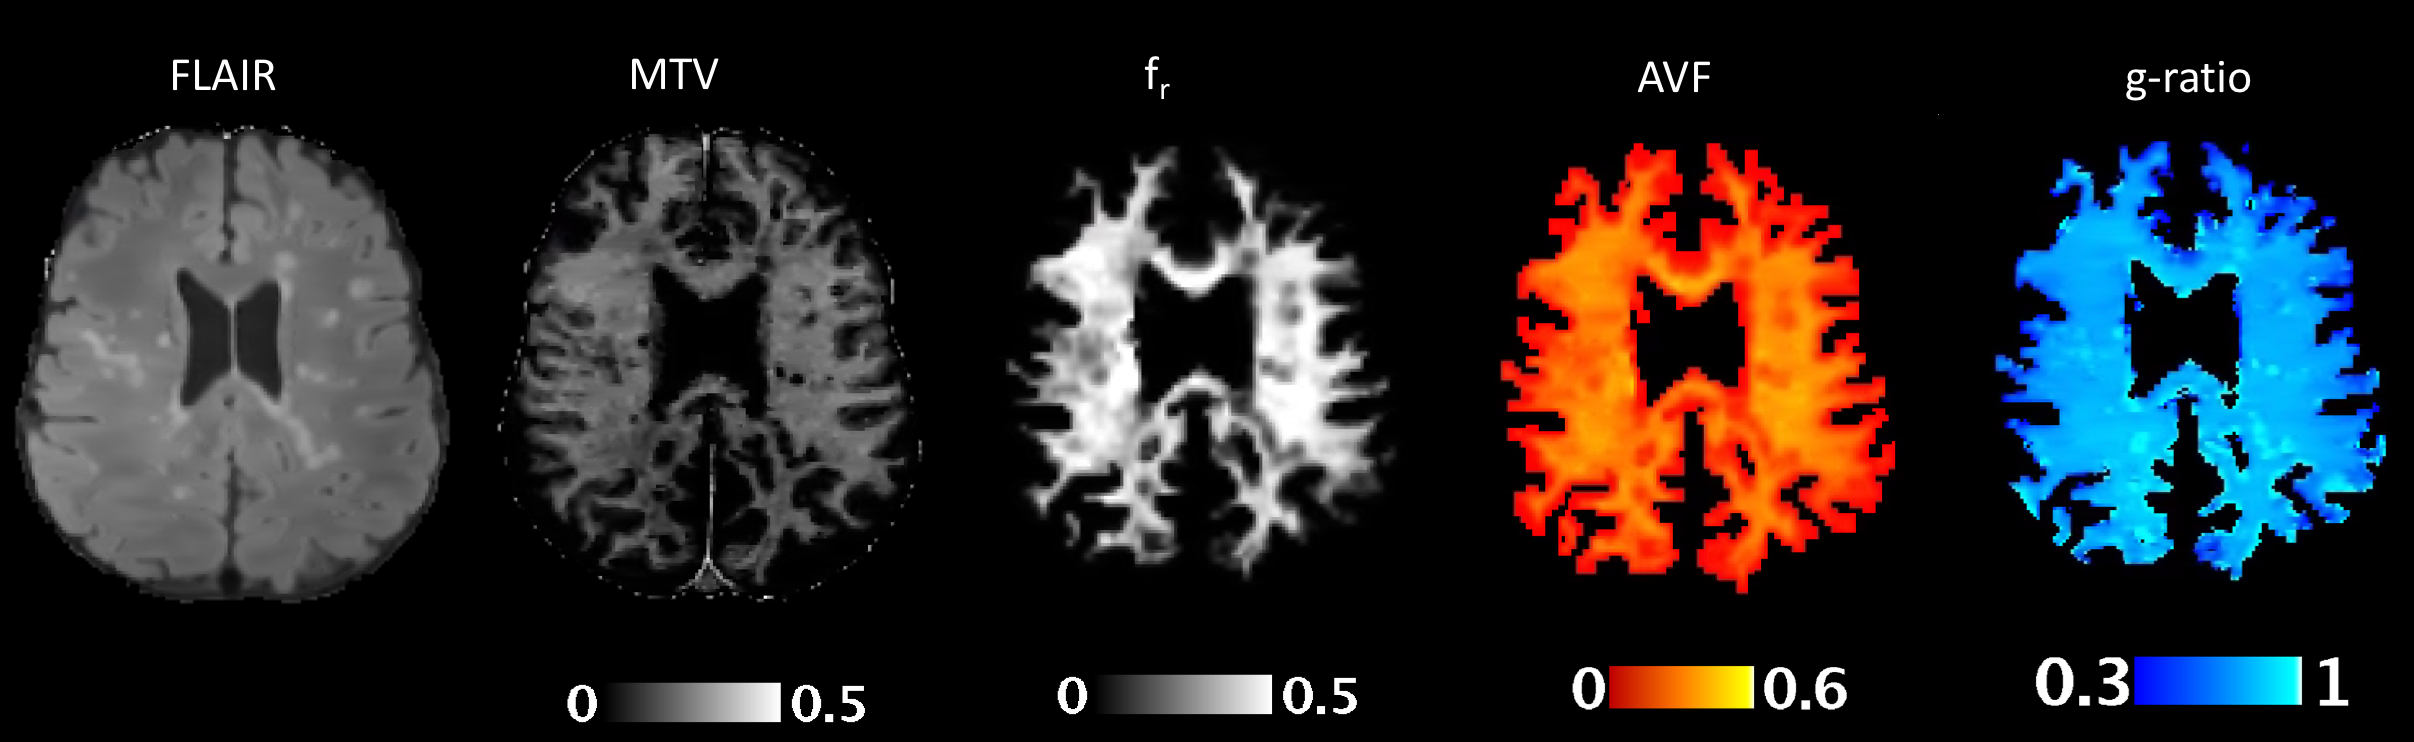
There were a total of 1426 supratentorial lesions with a minimum volume of 5 mm3. The mean g-ratio was significantly elevated in lesions compared to NAWM (0.74 and 0.67, p=1.6 x 10⁻⁶). Average lesion AVF (0.17 and 0.23, p=9.3 x 10⁻⁸) and MVF (0.17 and 0.25, p=2.7 x 10⁻¹⁴) were significantly decreased compared to NAWM (Figures 1).
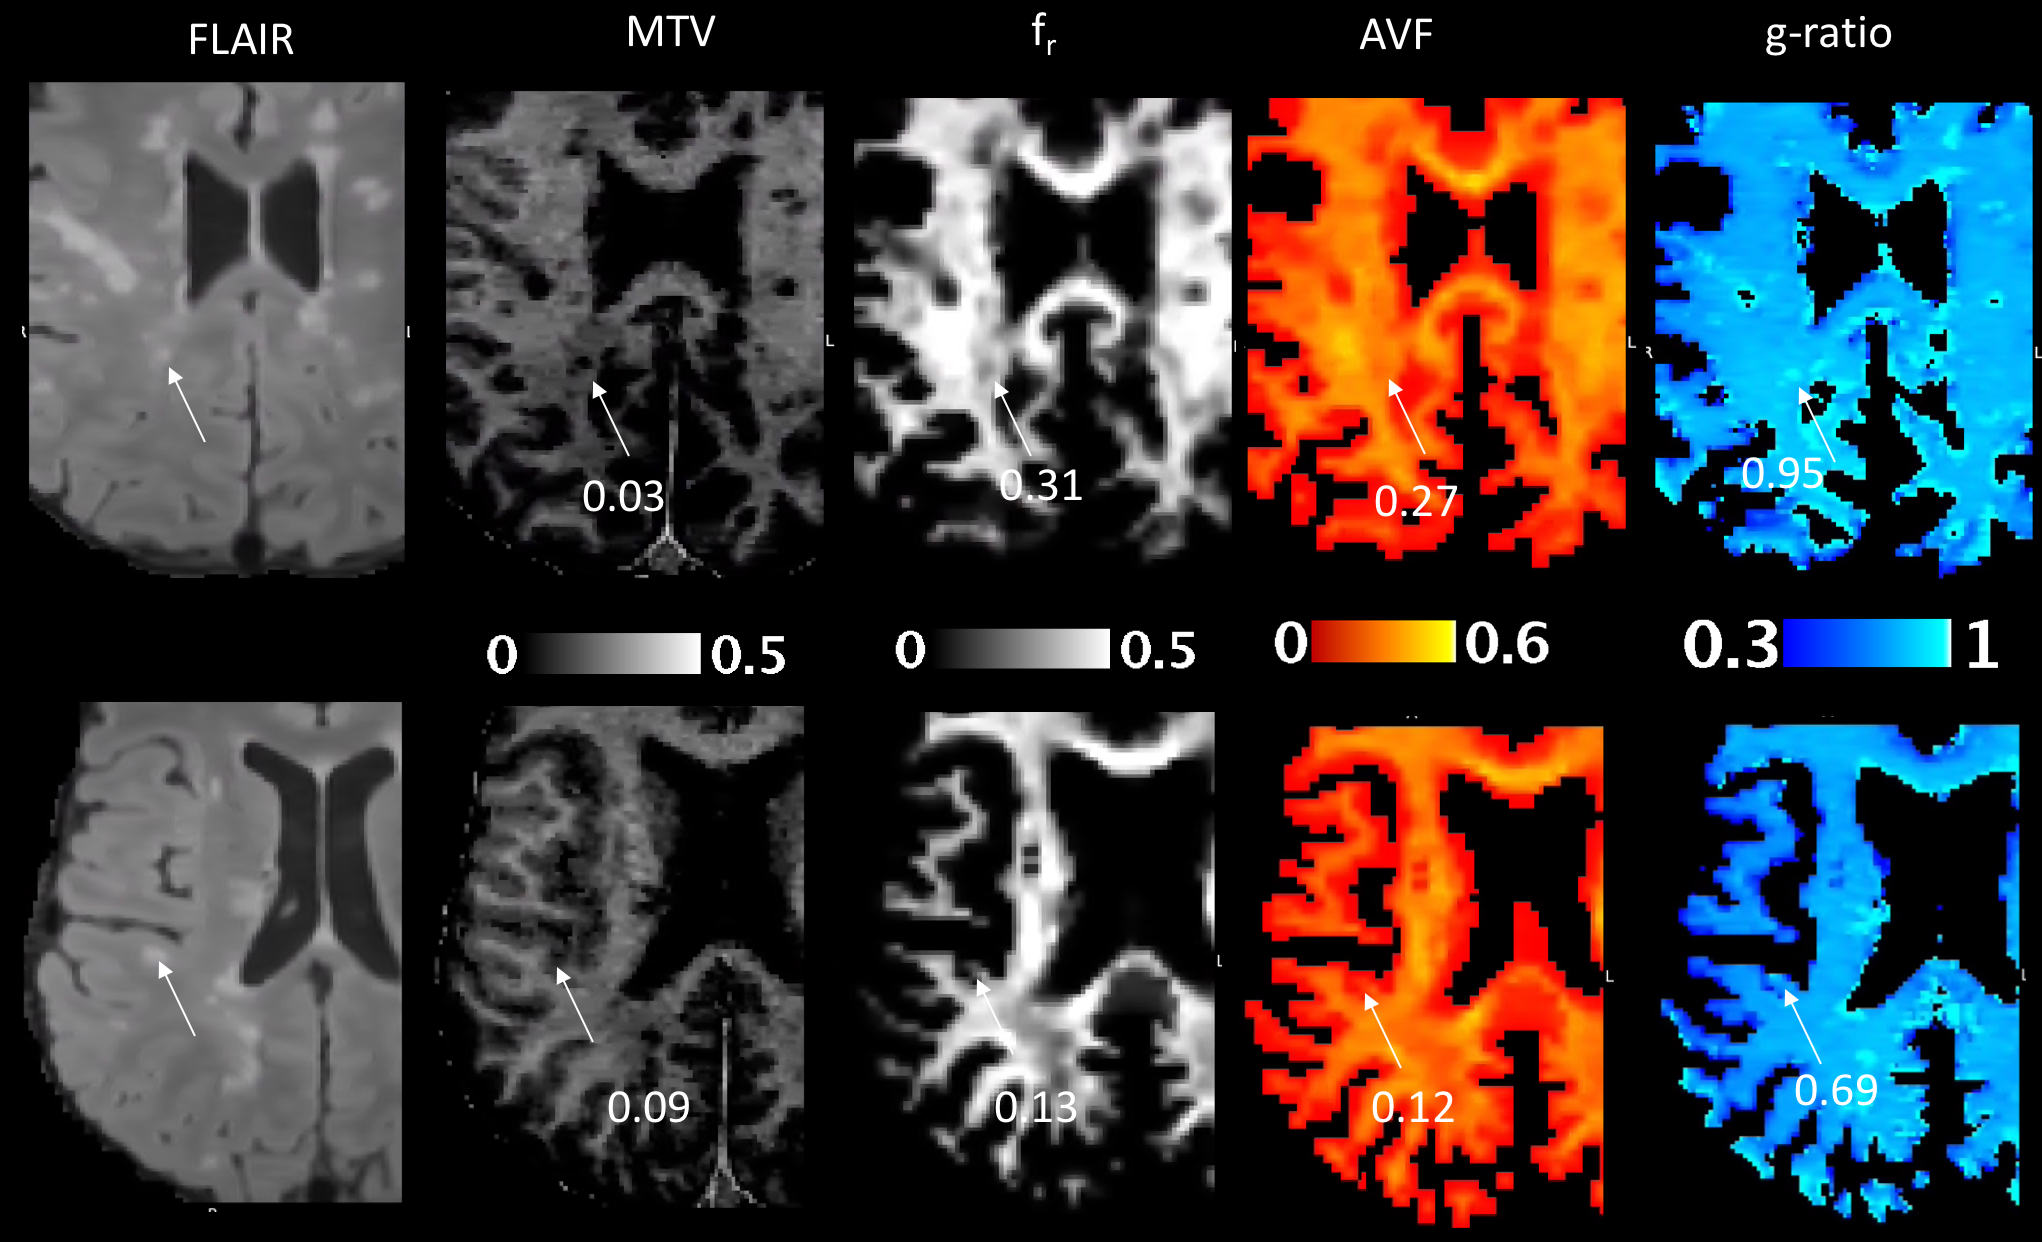
Of note, individual lesions demonstrated variable MVF, AVF, and g-ratio (Figure 2). From the linear mixed-effects model, higher EDSS scores were observed with higher g-ratio (p<0.0001), lower axonal volume fraction (p<0.0001) and lower myelin volume fraction (p<0.0001).
The g-ratio was significantly elevated in lesions compared to HC (0.74 and 0.66, p=1.53 x 10⁻⁵), although not significant in NAWM compared to HC (p=0.31). AVF and MVF were both significantly decreased in lesions compared to HC (p=5.75 x 10⁻⁸ and 1.68 x 10⁻¹⁴, respectively). Similar findings for AVF and MVF were noted in NAWM compared to HC to a lesser extent (p=0.18 and 0.009, respectively).
Discussion
In this study, we employed ultra-high gradient diffusion (SMT) and myelin-sensitive imaging (MTV) to probe the microstructural changes within focal lesions and NAWM. Compared to HC, we found evidence of myelin and axonal damage within lesions and to a lesser degree the NAWM. Lesions showed increased the g-ratio on average which may reflect predominantly demyelinating pathology, although there was heterogeneity consistent with prior histologic reports. Interestingly, from our linear mixed model, we found significant correlations between lesion g-ratio, AVF, and MVF and clinical disability. Future work with longitudinal studies and histopathologic correlation may yield additional insights into potential clinical applications in clinical trials.Acknowledgements
No acknowledgement found.References
Huang SY, Nummenmaa A, Witzel T, et al. The impact of gradient strength on in vivo diffusion MRI estimates of axon diameter. NeuroImage 2015;106:464–72.
2. Fan Q, Nummenmaa A, Witzel T, et al. Characterization of Axonal Pathology Independent of Fiber Crossings in Multiple Sclerosis Using High-Gradient Diffusion MRI. In: Proc. Intl. Soc. Mag. Reson. Med. 26. Paris, France; 2018.
3. Kaden E, Kelm ND, Carson RP, et al. Multi-compartment microscopic diffusion imaging. NeuroImage 2016;139:346–59.
4. Stikov N, Campbell JSW, Stroh T, et al. In vivo histology of the myelin g-ratio with magnetic resonance imaging. NeuroImage 2015;118:397–405.
5. Mezer A, Yeatman JD, Stikov N, et al. Quantifying the local tissue volume and composition in individual brains with magnetic resonance imaging. Nat Med 2013;19:1667–72.
6. Feinberg DA, Moeller S, Smith SM, et al. Multiplexed echo planar imaging for sub-second whole brain FMRI and fast diffusion imaging. PloS One 2010;5:e15710.
7. Setsompop K, Cohen-Adad J, Gagoski BA, et al. Improving diffusion MRI using simultaneous multi-slice echo planar imaging. NeuroImage 2012;63:569–80.
Figures