3291
Application of multi-shell NODDI to characterize acute and chronic MS lesions.1Department of Clinical Surgical Diagnostic and Pediatric Sciences, University of Pavia, Pavia, Italy, 2Department of Neurology, University of California San Francisco, San Francisco, CA, United States, 3Department of Brain and Behavioral Sciences, University of Pavia, Pavia, Italy
Synopsis
In order to overcome the limitations of conventional MRI in MS, we explored the ability of NODDI to characterize features of acute and chronic lesions. In our study, in line with a recent work that histologically investigated animal models, Orientation Dispersion Index (ODI) was significantly higher in enhancing lesions, thus representing a reliable tool for detecting acute inflammation. After enhancement, lesions could be divided based on their change in Neurite Density Index (NDI): lesions showing increasing NDI values were likely to be characterized by partial remyelination, whereas lesions showing decreasing NDI values might be expression of chronic focal damage.
Introduction
Multiple sclerosis (MS) is a chronic neurological immune-mediated disease characterized by multi-focal plaques of inflammation and demyelination along with diffuse white matter (WM) injury. (1) Conventional MRI is essential for diagnosis by revealing plaques as focal hyperintensities on T2-weighted images, but has limited sensitivity to microstructural changes in normal appearing WM (NAWM). (2) Moreover conventional imaging lacks specificity because it fails to differentiate the wide spectrum of pathology within each plaque (inflammation, axonal loss, gliosis, including demyelination as well as remyelination). (3,4,5) Gadolinium, improves the utility of conventional MRI in MS by detecting focal Gad-enhancing lesions (GEL) with blood–brain barrier disruption. Although GEL represents a radiological correlate of acute inflammation, helpful for diagnosis and therapeutic management, gadolinium’s usage is now restricted due to safety concerns. Alternative MRI markers of acute inflammation are needed. Neurite Orientation Dispersion and Density Imaging (NODDI) is an advanced diffusion MRI approach that models microstructural features of neurites contributing to the diffusion signal and provides key metrics namely Neurite Density Index (NDI), Orientation Dispersion Index (ODI) and extra-neurite compartment (VEC). (6) The aim of this research was to provide a longitudinal NODDI assessment of GEL and NAWM in order to test NODDI as a marker of acute and chronic damage.Methods
Twenty MS subjects (mean age 36.4+/-8.7years, 16female, 15 relapsing remitting MS, 3 clinically isolated syndrome, 2 primary progressive MS, EDSS 2.6+/-1.6), underwent two MRI acquisitions (3T Siemens Skyra), 12.6+/-9 months apart. Conventional T1-weigthed and T2-weigthed sequences anda NODDI protocol were acquired (30 directions at b=700s/mm2TR/TE=4300/96ms, along with 9 b0 scans, and 64 directions at b=2000s/mm2 with TR/TE=4300/96ms, along with 1 b0 scan; 2.2mm3 cubic voxel; 66 axial slices; FOV:220mmx220mm, multiband acceleration factor=2). Twenty age-matched healthy-controls underwent one unenhanced 3T MRI with same scan and protocol. GELs with volume >3mm3 were segmented semi-automatically on post-contrast MPRAGE images at baseline. After linear registration the baseline regions of interest (ROI) were estimated for the follow up MRI. NAWM masks were generated by subtracting lesion masks from SIENAX estimated WM masks. Median values of NODDI and DTI metrics were computed at both time points within the NAWM, the GEL and non-enhancing (N-GEL) masks. Differences were assessed by parametric t-tests. A logistic regression analysis was conducted to identify which NODDI metric best discriminates Gd-enhancing status by comparing baseline GEL to their follow-up N-GEL.Results
We found 58 GEL, of which all were not enhancing at the follow up. ODI was significant higher in GEL (p<0.001) but was not different in N-GEL and NAWM. Logistic regression indicated ODI and lesion size as best discriminators between GEL and N-GEL states for the lesions (AUC 0.87). At follow-up, N-GEL lesions with decreasing NDI (half of the lesions) had less average size reduction (38% of their original size) compared to those lesions with increasing NDI value that decreased in size in average of the 50% (P <0.05). Interestingly, those 9 subjects (including the 2 primary progressive MS) with decreasing lesion NDI also demonstrated decreasing NDI at follow-up within the NAWM.Discussion
To our knowledge, only a single study assessed longitudinally induced demyelinated lesions in a murine model that combined NODDI with histological evaluation. (7) This study found that ODI is increased in acute demyelination, but subsequently decreases with remyelination. In contrast, NDI was decreased at the acute lesion stage and progressively increased over time in association with the remyelination. The authors suggested that the combination of decreasing ODI and increasing NDI might reflect progressive improvement in fiber coherency with remyelination. Our data are consistent with these observations. We found higher ODI in GELs with ODI normalizing following resolution of acute enhancement. Subsequent to the acute stage, we observed lesions with both increasing and decreasing NDI. We therefore speculate that lesions showing decreasing NDI overtime (Figure1) may represent plaques with ongoing persistent chronic damage and/or progressive demyelination that are associated with less shrinkage, whereas lesions showing increasing NDI overtime (Figure2) shrink more, and might represent plaques with different degrees of remyelination. Our finding suggesting remyelination in approximately half of the observed lesions is consistent with prior histologic data in MS. (8)Conclusion
ODI is a potential imaging marker of acute inflammation. The evaluation of the NDI changes overtime might identify lesions with absent or reduced remyelination and/or persistent demyelination and degeneration. NODDI could potentially be useful in evaluating in vivo responses to potential neuroprotective or myelin repairing therapies.Acknowledgements
Special Acknowledgements to the whole UCSF Henry lab
References
1) Frohman EM, Racke MK, Raine CS. Multiple sclerosis, the plaque and its pathogenesis. New England Journal of Medicine. Mar 2; 2006 354(9):942–55.
2) Filippi M, Rocca MA, Ciccarelli O, et al. MRI criteria for the diagnosis of Multiple Sclerosis: MAGNIMS consensus guidelines. The Lancet Neurology. 2016;15(3):292-303.
3) Van Walderveen MA, Kamphorst W, Scheltens P, et al. Histopathologic correlate of hypointense lesions on T1-weighted spin-echo MRI in multiple sclerosis. Neurology 1998;50:1282Y88.
4) Bitsch A, Kuhlmann T, Stadelmann C, et al. A longitudinal MRI study of histopathologically defined hypointense multiple sclerosis lesions. Ann Neurol 2001;49:793Y96
5) De Groot CJ, Bergers E, Kamphorst W, et al. Post-mortem MRI-guided sampling of multiple sclerosis brain lesions: Increased yield of active demyelinating and (p)reactive lesions. Brain 2001;124:1635Y45.
6) Zhang H, Schneider T, Wheeler-Kingshott CA, et al. NODDI: practical in vivo neurite orientation dispersion and density imaging of the human brain. NeuroImage 2012;61:1000-16
7) Luo, T. , Oladosu, O. , Rawji, K. S., Zhai, P. et al, Characterizing Structural Changes With Devolving Remyelination Following Experimental Demyelination Using High Angular Resolution Diffusion MRI and Texture Analysis. J. Magn. Reson. Imaging. 2018
8) Barkhof F, Brück W, De Groot CJA, et al. Remyelinated Lesions in Multiple SclerosisMagnetic Resonance Image Appearance. Arch Neurol. 2003;60(8):1073–1081.
9) Caverzasi, E. , Papinutto, N. , Castellano, A. , Zhu, A. H., Scifo, P. , Riva, M. , Bello, L. , Falini, A. , Bharatha, A. and Henry, R. G. (2016), Neurite Orientation Dispersion and Density Imaging Color Maps to Characterize Brain Diffusion in Neurologic Disorders. J Neuroimaging, 26: 494-498.
Figures
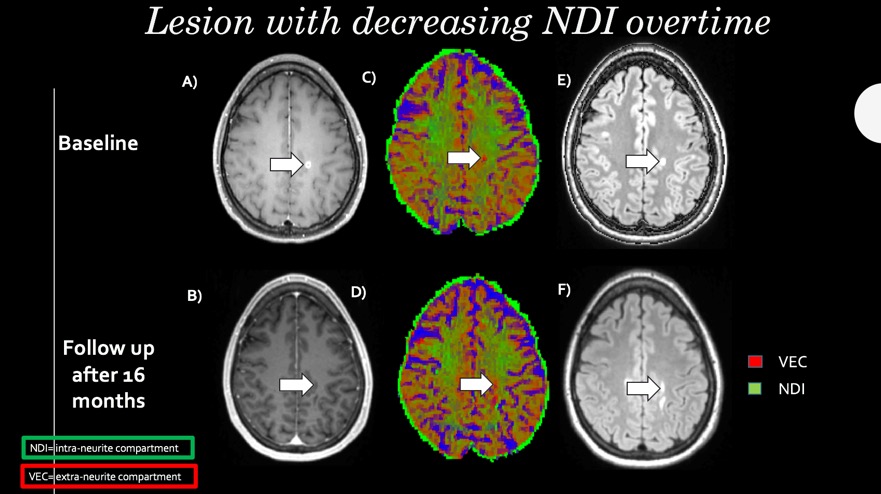
Figure 1
NODDI color map ( reference 9) graphically showing NDI (green) and VEC (red) values in a focal WM lesion (arrows) at the moment of enhancement (A,C,E) and at the disappearing of the enhancement (B,D,F). The green in the focal lesion, is less represented after the disappearing of the enhancement, with a relative increment of the red voxels. FLAIR sequences (E,F) show change in shape but not in size of the lesion. VEC and NDI are fraction in each voxel: if NDI decreases VEC increases and viceversa.
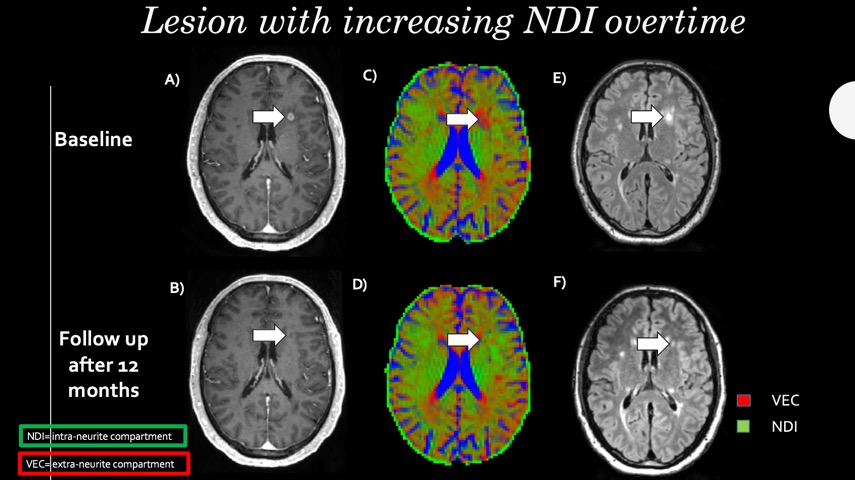
Figure 2
NODDI color map ( reference 9) graphically showing NDI (green) and VEC (red) values in a focal WM lesion (arrows) at the moment of enhancement (A,C,E) and at the disappearing of the enhancement (B,D,F). The green in the focal lesion is more represented after the disappearing of the enhancement with a relative decrement of the red voxels. FLAIR sequences (E,F) show important decreasing in size. VEC and NDI are fraction in each voxel: if NDI increases VEC decreases and viceversa.