3288
The Structural Connectivity Network of Basal Ganglia in Mouse Brain: MR Diffusion-Tractography at 9.4 T1Department of Health Science and Technology, GAIHST, Gachon University, gachon university, Incheon, Republic of Korea, Korea, Republic of, 2Lee Gil Ya Cancer and & Diabetes Institute, Gachon university, Incheon, Republic of Korea, Korea, Republic of
Synopsis
Tractography is becoming increasingly common in clinical settings for understanding pathological development and disease, and for assessing pre- and post-operative diagnosis. However, the study on neuronal connectivity network for basal ganglia, a DBS treatment target for Parkinson’s patients, remains unestablished. Therefore, in the present study we have visualized probabilistic diffusion tractography and investigated detailed 3D reconstruction of the projection of basal ganglia structures in mouse model using high-resolution 9.4T MRI. Multi-fiber tractography methods combined with diffusion MRI data have the poential to help identify brain DBS targets in function neurosurgery intervention.
Introduction
The basal ganglia is a complex system of a subcortical nuclei network which plays a fundamental role in a wide range of processes related to motor and limbic functions1. Altered neural connectivity of basal ganglia may contribute to a number of neurologic and psychiatric disease such as Parkinson’s disease (PD)2. Deep brain stimulation (DBS) of the subthalamic nucleus (STN) and the globus pallidus pars interna (GPi) provides an efficient treatment to reduce symptoms in PD3. Despite the fundamental importance of neuronal connectivity on basal ganglia, it remains remarkably incomplete. Furthermore, these connections using Diffusion MRI have not been established for the mouse, an animal model which has been increasingly used for understanding the molecular genetic mechanisms of human brain diseases4. Therefore, we present a comprehensive, probabilistic diffusion tractography connectome of the basal ganglia (STN, Substantia nigra compacta (SNr), Substantia nigra reticulate (SNc), Globus pallidus external (GPe) and GPi) of an ex vivo mouse brain using 9.4 T.Methods
Two wild-type adult (C57BL/6J) mice were chosen for imaging. The animals were perfusion-fixed and doped with 4% paraformaldehyde and 0.1% Magnevist®. 9.4 T MRI data were acquired using a 3D-T2 sequence with TR/TE = 3000/42.5 ms, isotropic resolution = 100 µm with an acquisition time of 52 min. Diffusion data were acquired using 2D diffusion-weighted spin-echo sequence with the parameters, TR/TE = 12000/33.63 ms, resolution = 150x133 µm, slice thickness = 150 µm, diffusion directions = 30, b-value = 2000 with an acquisition time of 2h 1min. All image volumes were registered to the first bo image using Atlas Normalization Toolbox using elastix (ANTx). Fiber data for probabilistic tractography were reconstructed using FSL’s BEDPOSTX with a maximum of 3 fiber orientations per voxels5. To investigate the connectivity pattern of the basal ganglia including STN, SNr, SNc, GPe and GPi, probabilistic tractography was performed using FSL’s PROBTRACKX. For waypoint connectivity studies, one or more label masks were used as target regions, and only fibers passing through these targets were included in output maps5.Results
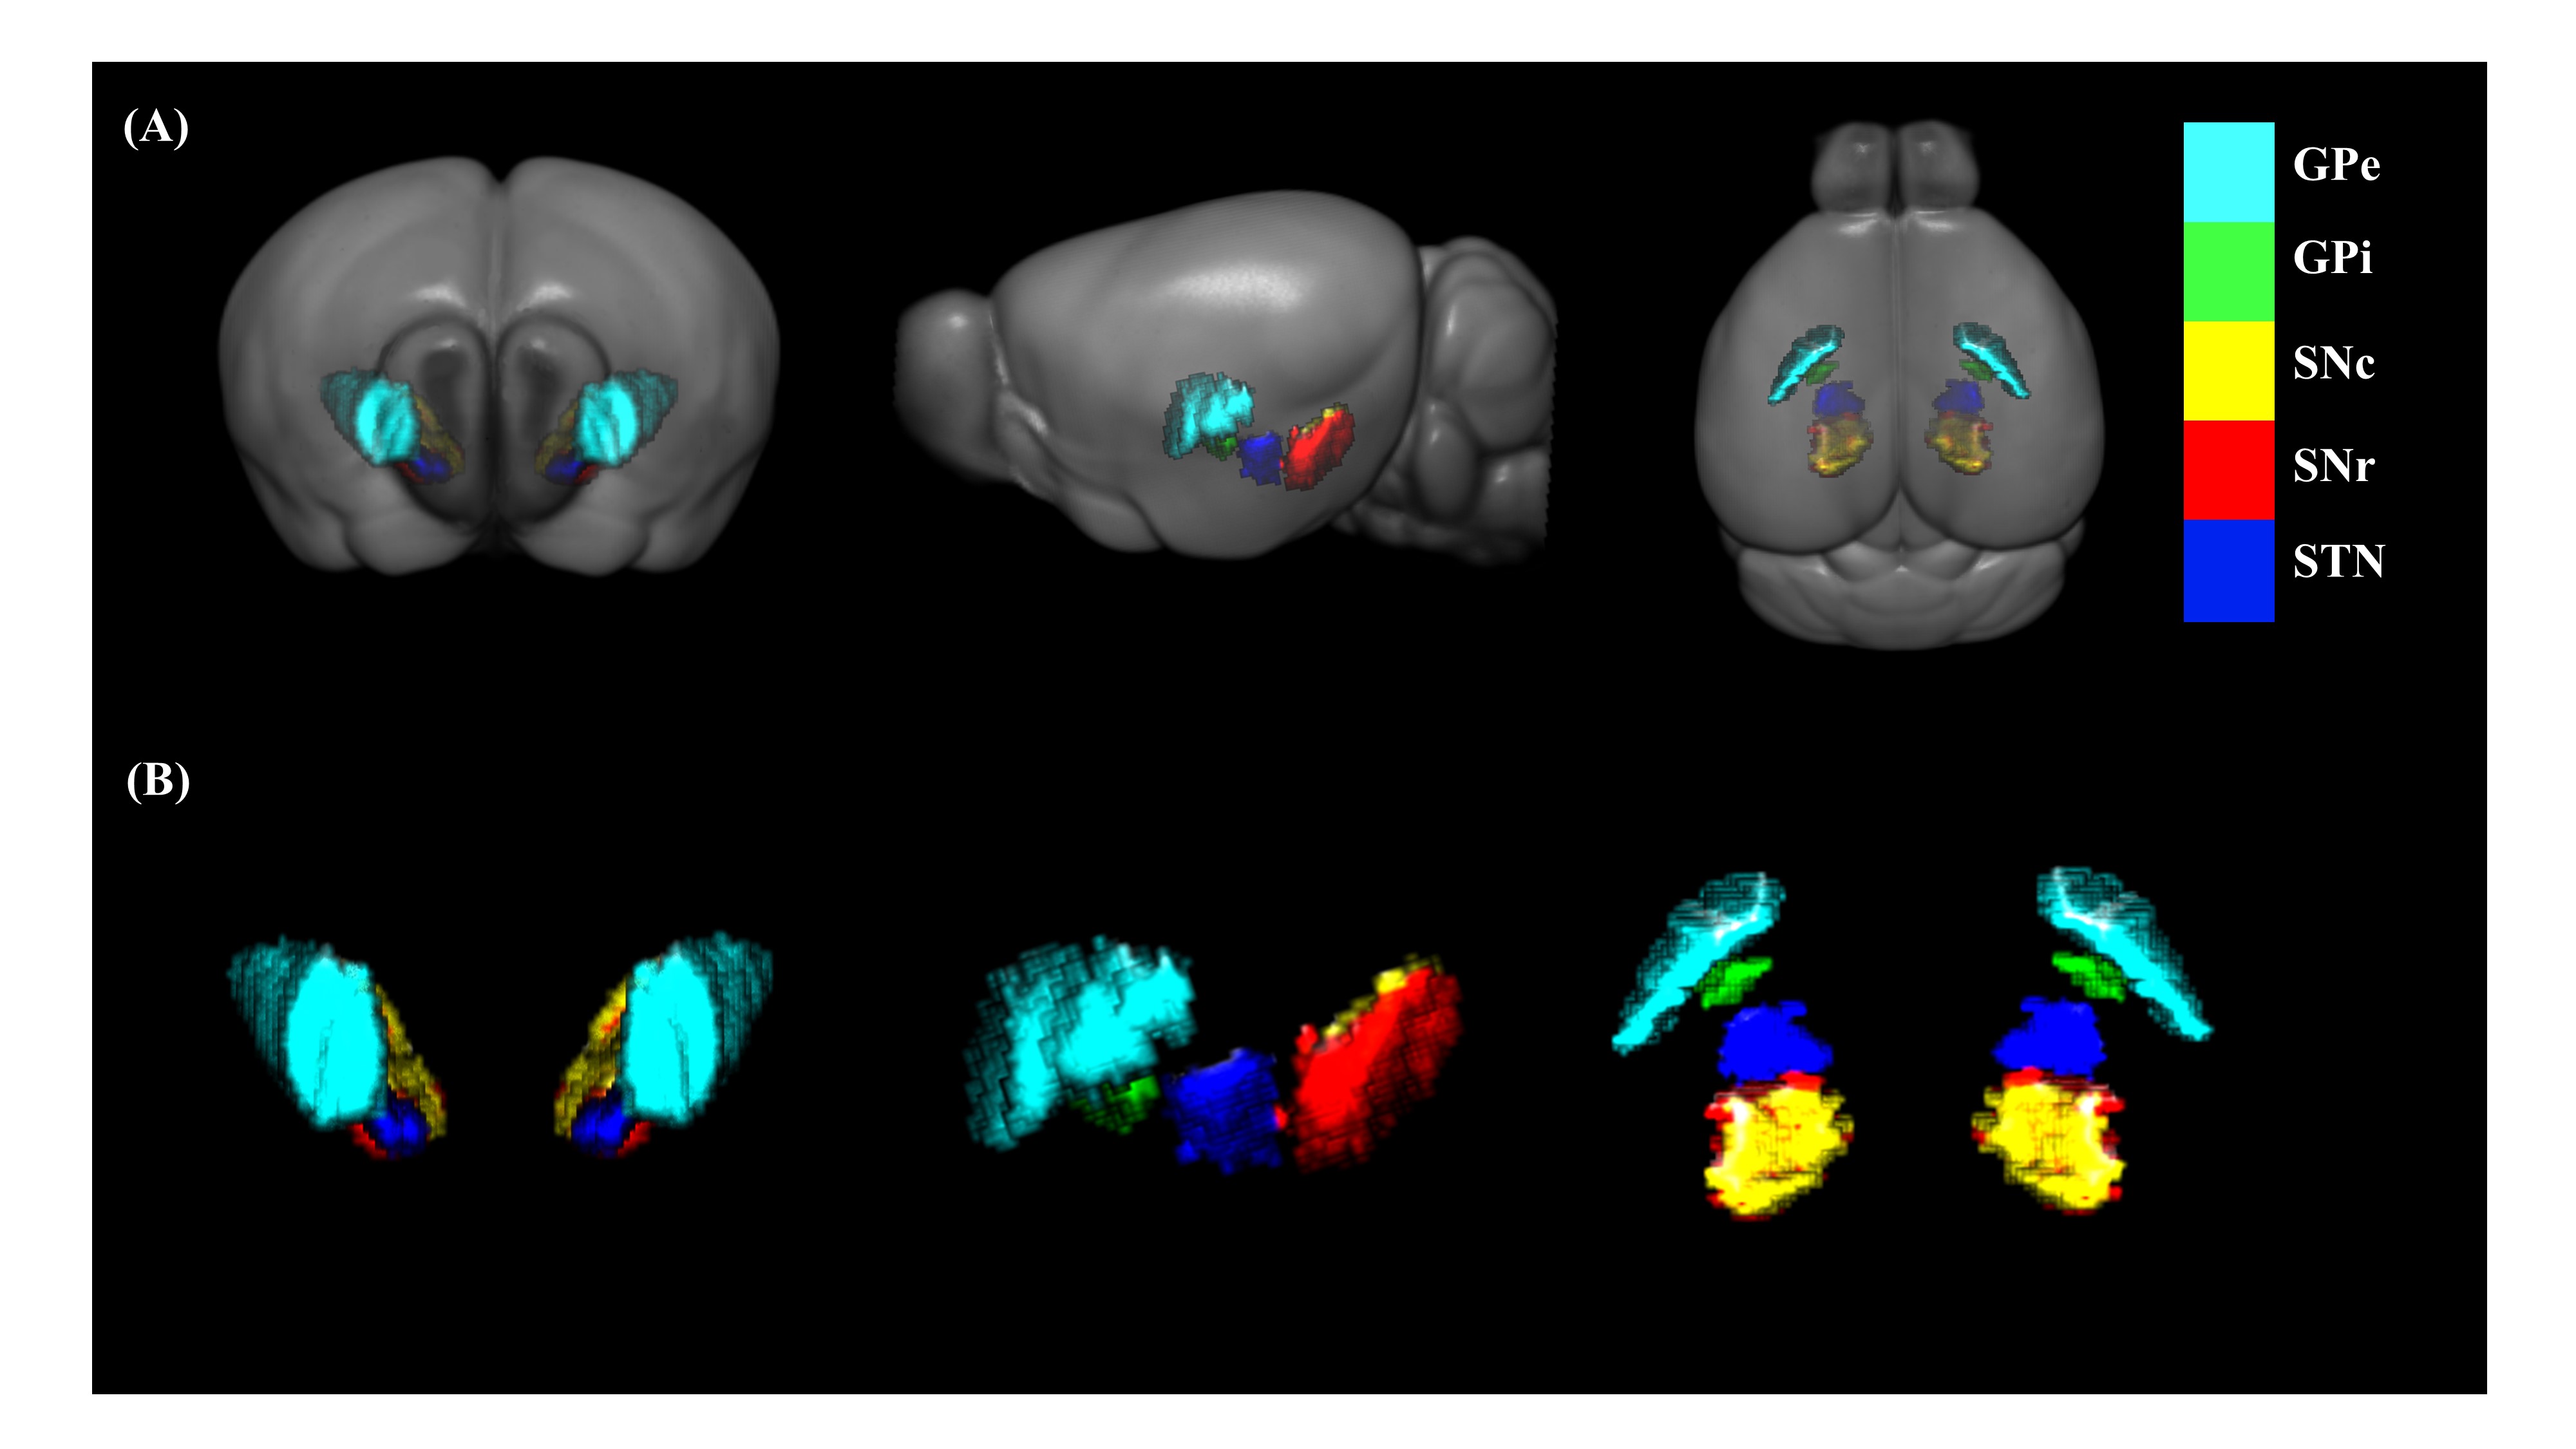
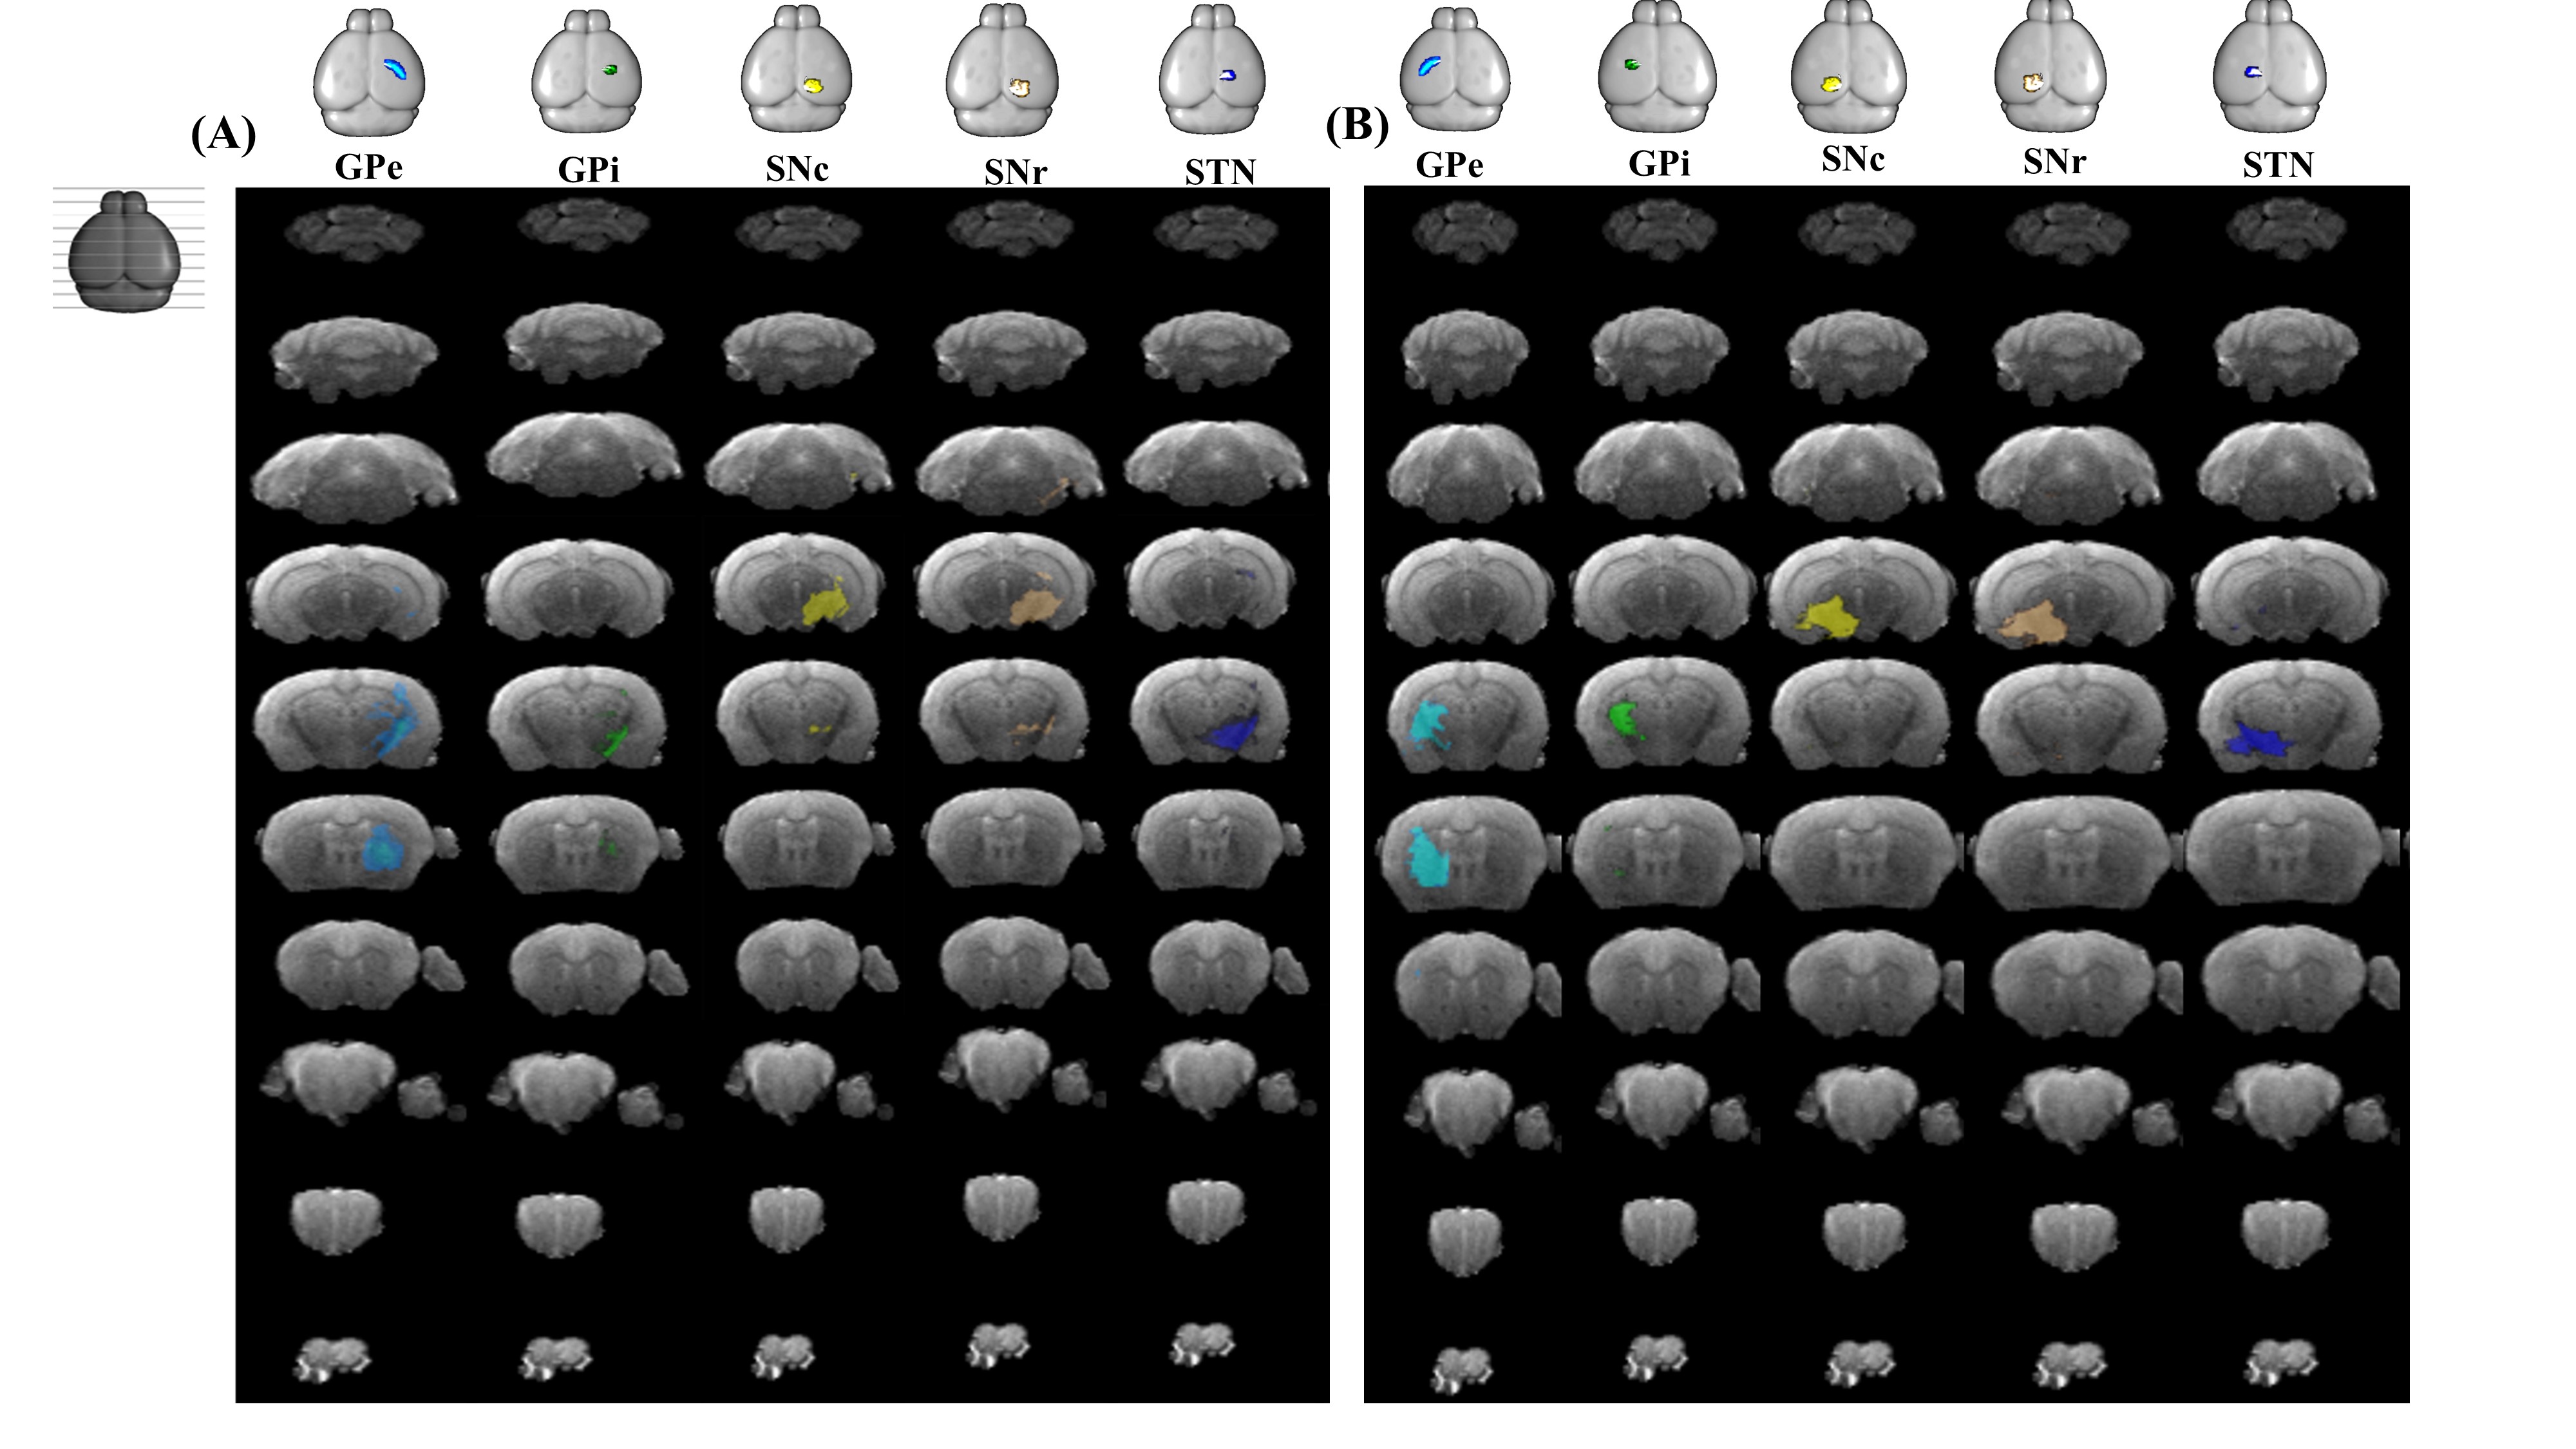
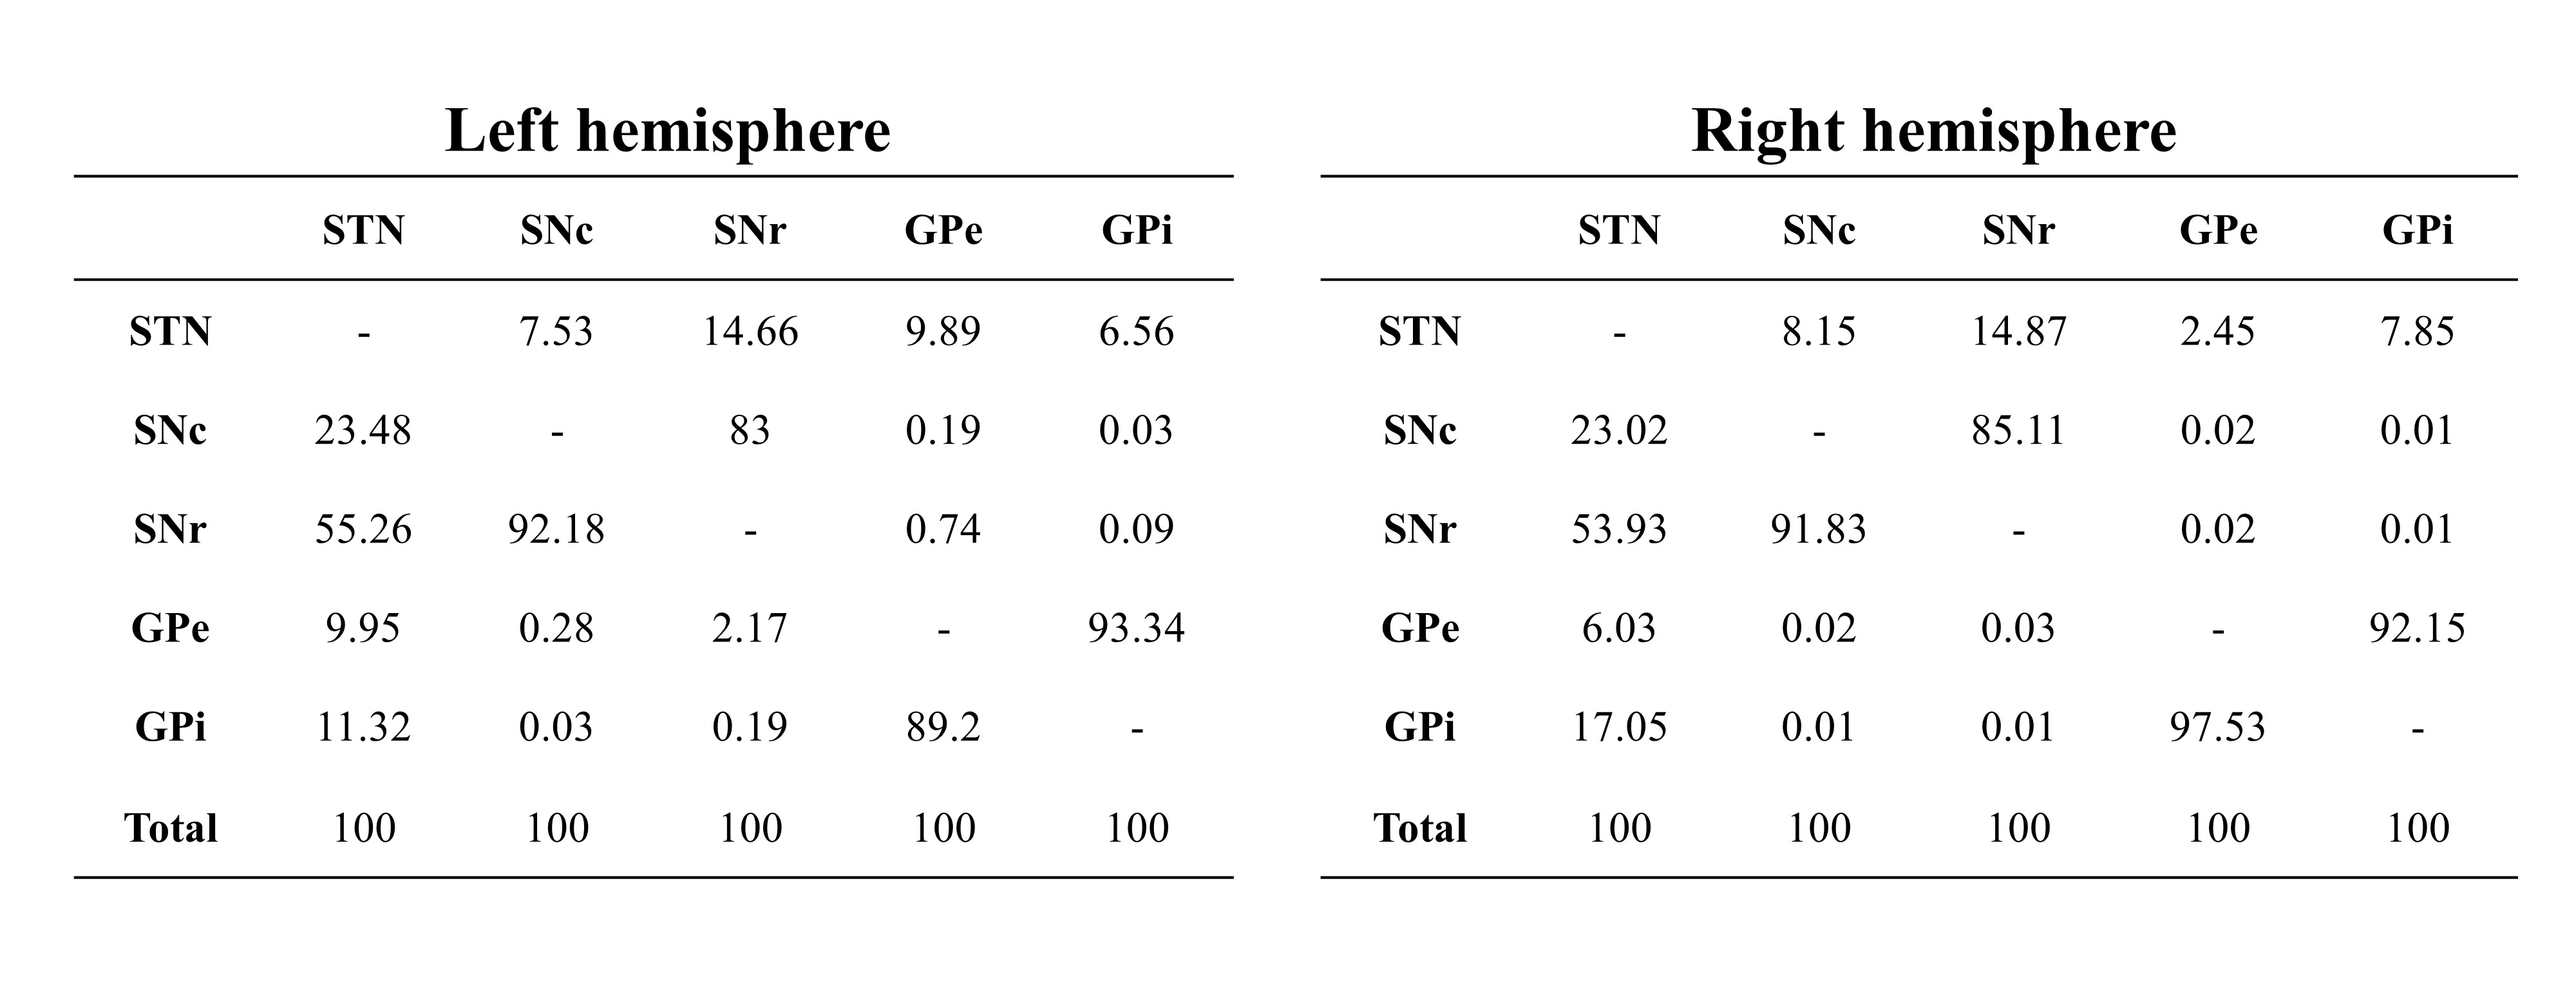
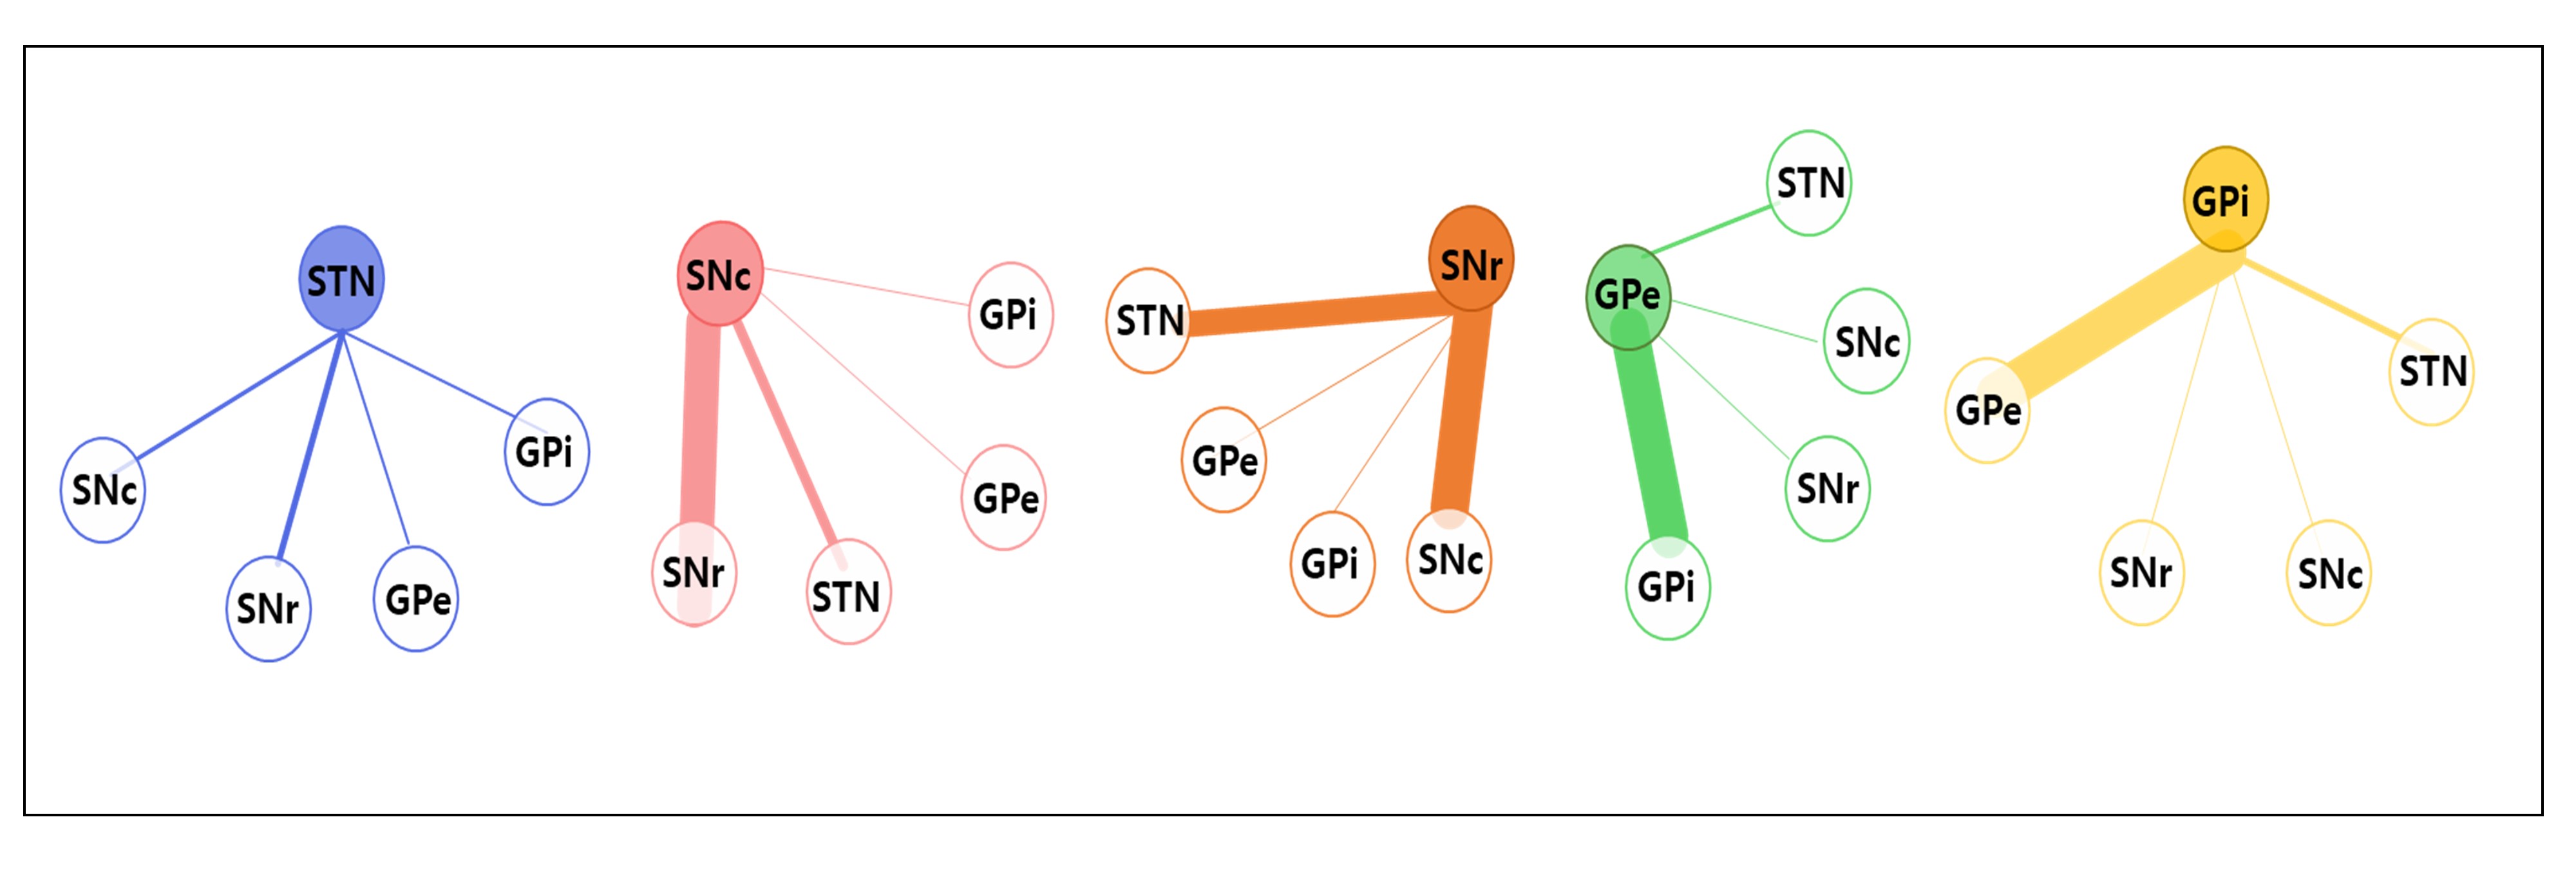
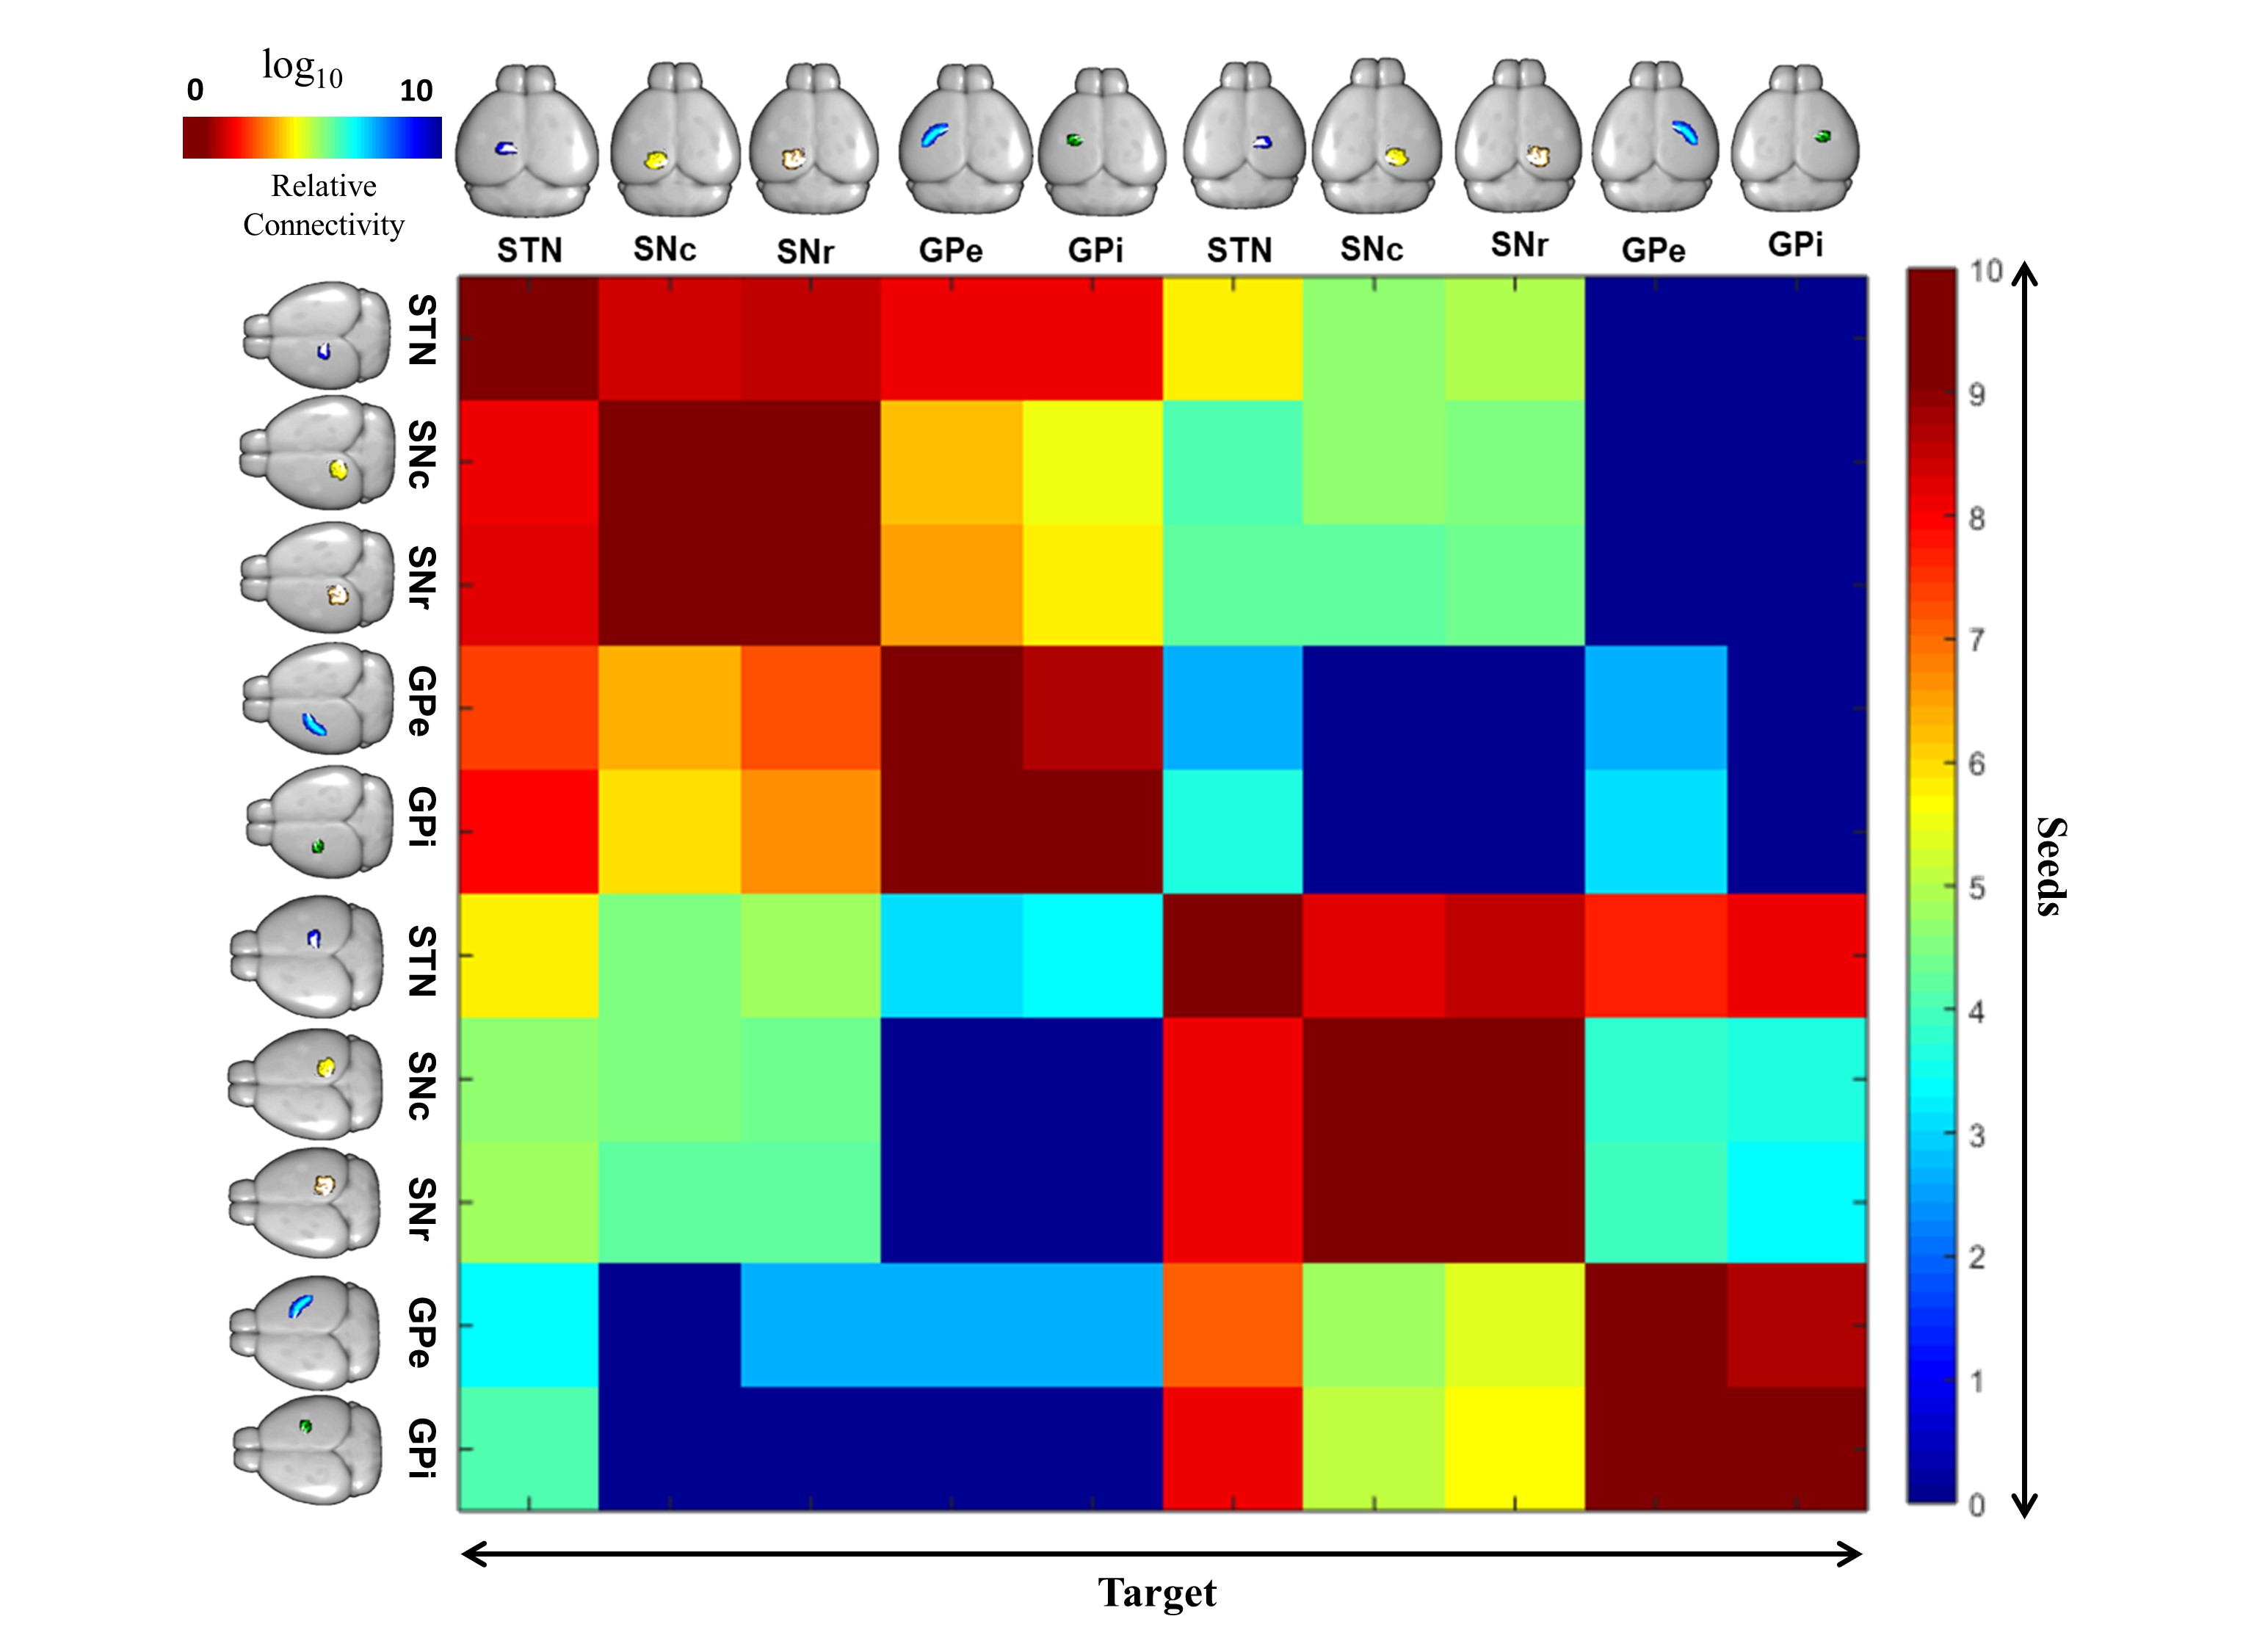
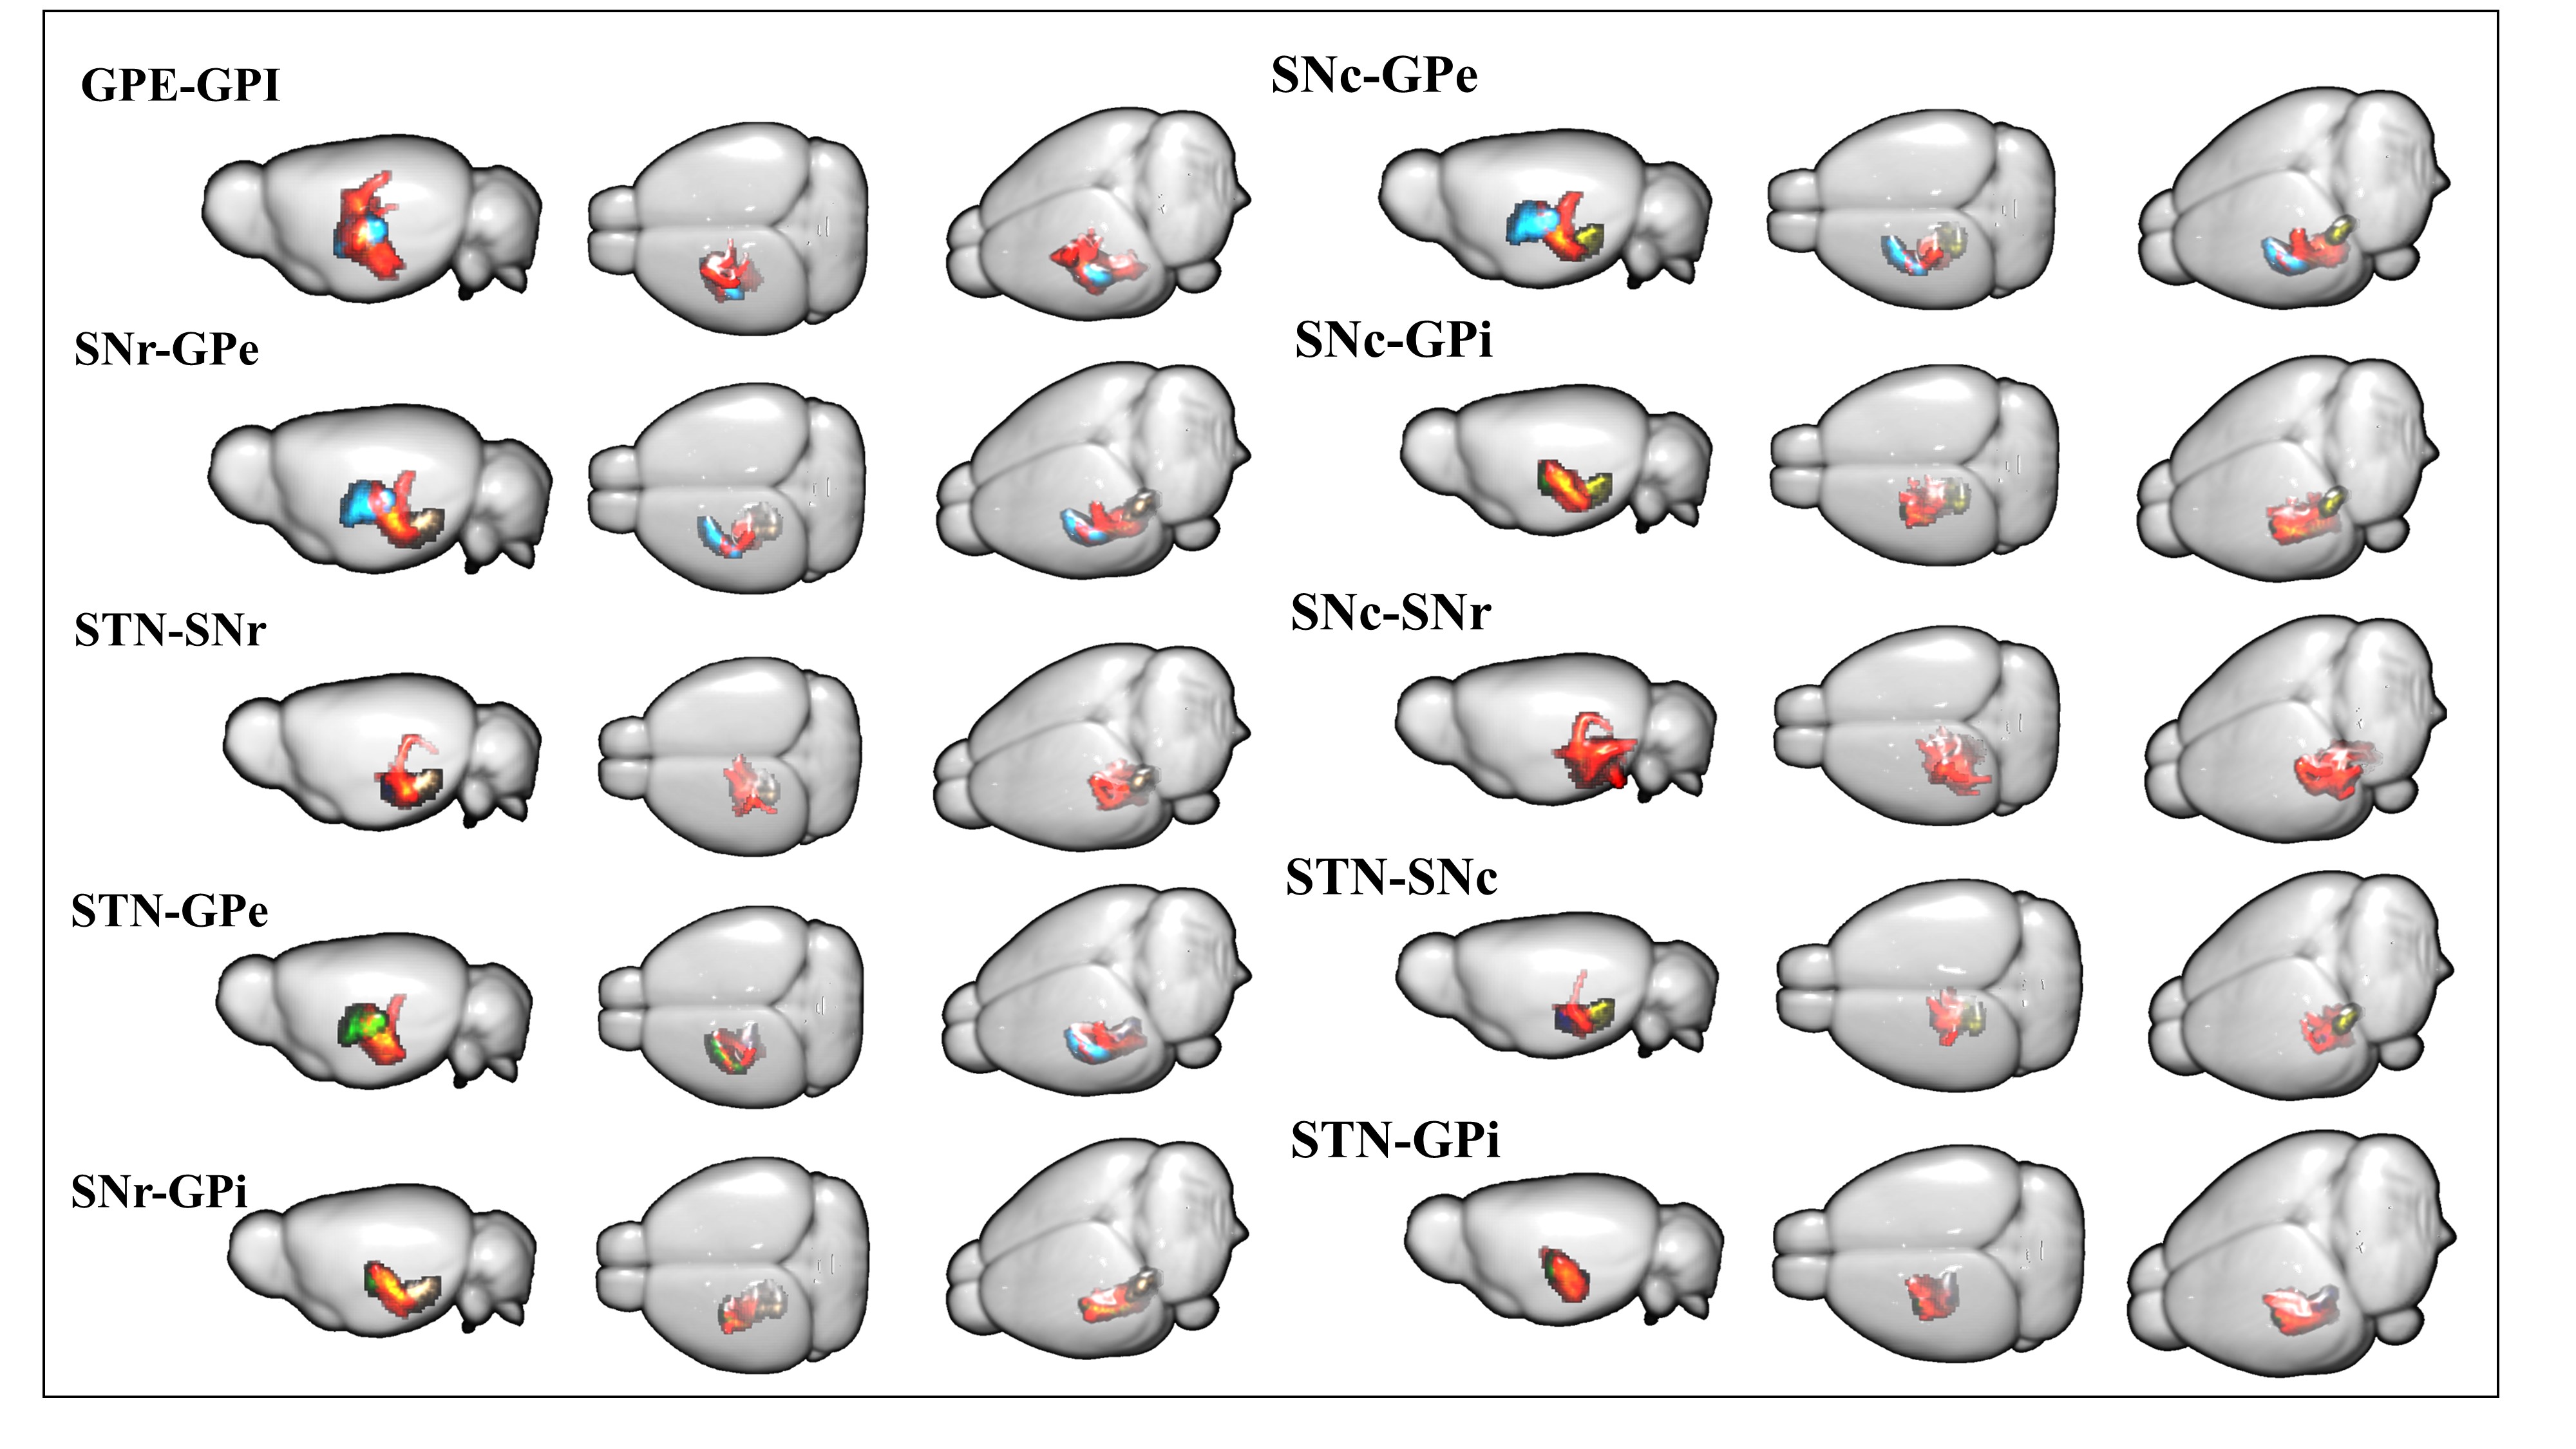
The basal ganglia segmented for both left and right hemisphere in 3D rendering is shown in Figure 1. Five representative seed region connectivity maps are presented in Figure 2 as color overlays on top of standard anatomic MR mask images in each hemispheres. The percentage of direct fiber connections between the STN, SNc, SNr, GPe and GPi are represented in Table 1. Graphical representation of Table 1 is depicted in Figure 3. A probabilistic tractography connectivity matrix for the mouse brain is shown in Figure 4. Being two adjacent structures, many fiber tracks were found to connect the SNc-SNr and GPe-Gpi. Waypoint connectivity map between the segmented each five structures is generated in Figure 5. This allows visualization of the specific pathway connecting 2 regions without extraneous connectivity to other regions.Discussion
The study on probabilistic connectivity of basal ganglia have not reported in mouse model. However, in this work, we have quantified fiber connectivity and visualized specific tractography pathway. We have also identified connections contribute to understanding of the basal ganglia in ex vivo mouse model. In line with previous human brain connectivity study, direct connections within the basal ganglia were approximately the same4. It is likely that short distance connections are overrepresented because they are easier to track than long distance connections. The STN-GPi connections (Left: 6.56 % , Right: 7.85%) which have been established as effective targets of DBS, for example, are fewer than the STN-SNr connections (Left:14.66%, Right: 14.87%). This could reflect a relatively important role for the STN-SNr connection in humans, or it could be an overestimation due to its shorter distance5. The same holds for the many projections found between the GPi and GPe. Furthermore, the percentage of connectivity is asymmetric, importantly, because seeding was done independently for each region, the connectivity estimate between seed region A and target region B is not necessarily the same as that between seed region B and target region A4. In general, ipsilateral connectivity was higher than contralateral connectivity, which is consistent with previous studies of the mouse brain6.Conclusion
This study shows that probabilistic diffusion tractography allows for detailed 3D reconstruction of the projections of basal ganglia in ex vivo mouse brain. Multi-fiber tractography methods combined with diffusion MRI data have the potential to help identify brain DBS targets in function neurosurgery intervention. In addition, this study is critical to further understand the complementary and differential roles of basal ganglia, as well as better understand their connectivity relationships to other brain region. Therefore, this work serves as a reference database for future tractography studies in the Parkinson disease model.Acknowledgements
This study was supported by Research Program through the National Research Foundation of Korea (NRF) funded by the Ministry of Science and ICT (NRF-2017M3C7A1044367). The funders had no role in study design, data collection and analysis, decision to publish, or preparation of the manuscript.References
1. Plantinga B, Roebroeck A, Kemper V, et al. Ultra-high field MRI post mortem structural connectivity of the human subthalamic neucleus, substantia nigra, and globus pallidus. Front Neuroanat. 2016;10:
2. Wu T, Wang J, Wang C, et al. Basal ganglia circuits changes in Parkinson’s disease patients. Neurosci Lett. 2012;524(1):55-59
3. Pujol S, Cabeen R, Sebille B, et al. In vivo exploration of the connectivity between the subthalamic nucleus and the globus pallidus in the human brain using multi-fiber tractography. Front. Neuroanat. 2016;10(119):1-12
4. David A.G, Orion P.K, Keifer J, et al. A DTI tractography analysis of infralimbic and prelimbic connectivity in the mouse using High-throughput MRI. Neuroimage. 2012;63(2):800-811
5. Calbrese E, Badea A, Cofer G, et al. A diffusion MRI tractography connectome of the mouse brain and comparison with neuronal tracer data. Cerebral cortex. 2015;25:4628-4637
6. Plantinga B, Roebroeck A, Kemper V, et al. Ultra-high field MRI post mortem structural connectivity of the human subthalamic nucleus, subtantia nigra, and globus pallidus. Front. Neuroanat. 2016;10:1-10
Figures