3281
Functional network-based statistics reveal abnormal resting-state functional connectivity in minimal hepatic encephalopathy1Fujian Medical University Union Hospital, Fuzhou, China, 2Siemens Healthcare, Fuzhou, China
Synopsis
Whole-brain functional network analysis is an emerging methodology for the investigation of the pathophysiology of MHE. A nonparametric statistical approach, called “network-based statistics” (NBS), has also been used in the field of connectome analysis. However, few whole-brain NBS studies have been conducted on MHE patients, which limits the further clarification of the network pathophysiology of MHE. We performed NBS analysis to identify FC changes related to MHE at the whole-brain functional connectome level and indentified two subnetworks with significant differences in FC matrices between patients and controls. Correlation analyses revealed that the PHES score was significantly positively correlated with the strength of two FCs within the first subnetwork. In summary, our findings indicate that DMN dysfunction may be one of the core issues in the pathophysiology of MHE.
Purpose
Whole-brain functional network analysis is an emerging methodology for exploring the mechanisms underlying hepatic encephalopathy (HE). This study aimedto identify the brain subnetwork that is significantly altered within the functional connectome in minimal HE (MHE), the earliest stage of HE.Materials and Methods
A MAGNETOM Prisma 3.0T MR scanner (Siemens Healthcare, Erlangen, Germany) was used to acquire resting-state functional magnetic resonance imaging from nineteen cirrhotic patients with MHE and 19 controls. Psychometric Hepatic Encephalopathy Score (PHES) examination was used in the diagnosis of MHE. A whole-brain functional connectivity (FC) matrix was calculated for each subject. Then, network-based statistical analyses of the functional connectome were used to perform group comparisons, and correlation analyses were conducted to identify the relationships between FC alterations and cognitive performance.Results
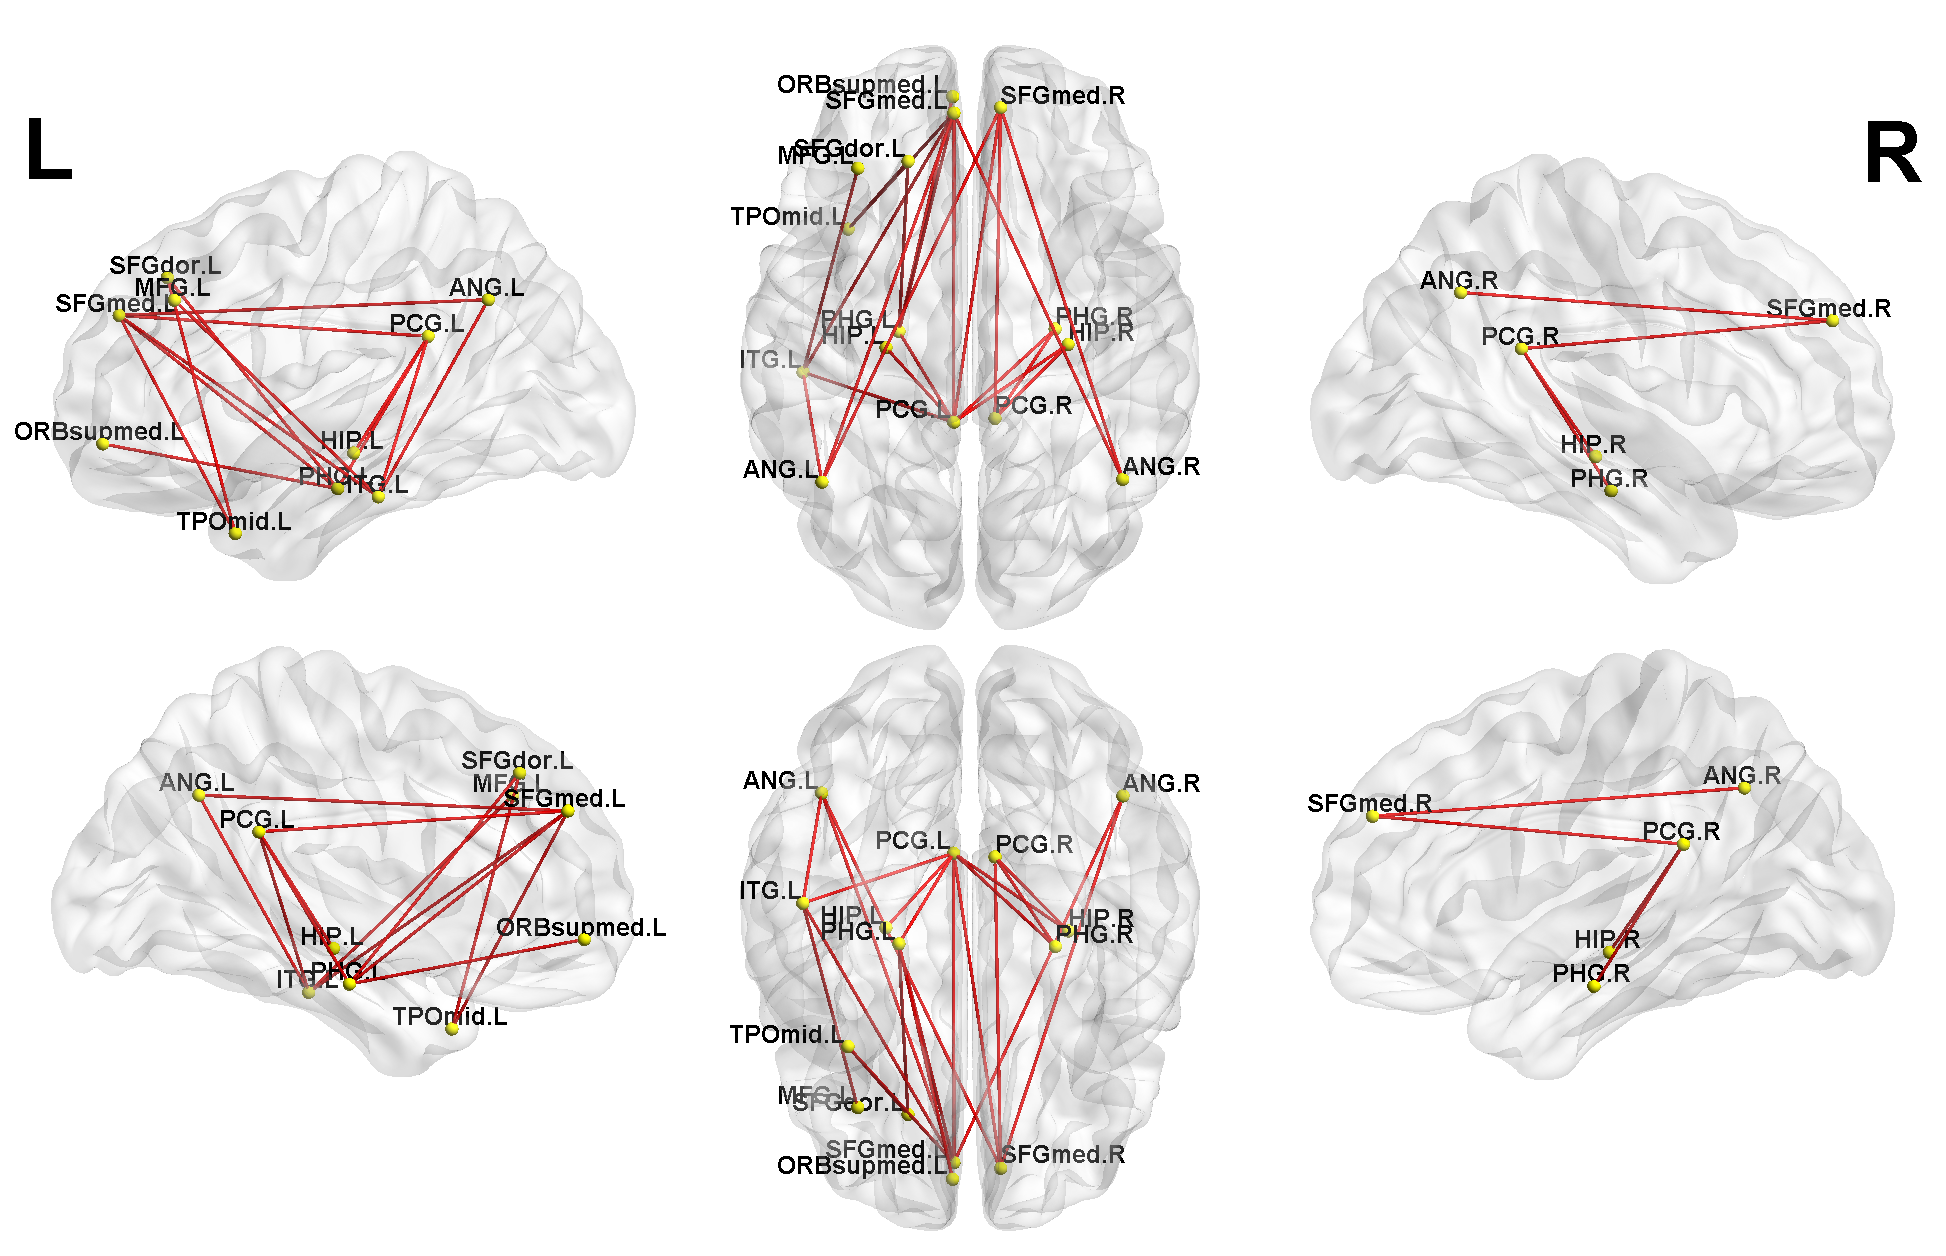
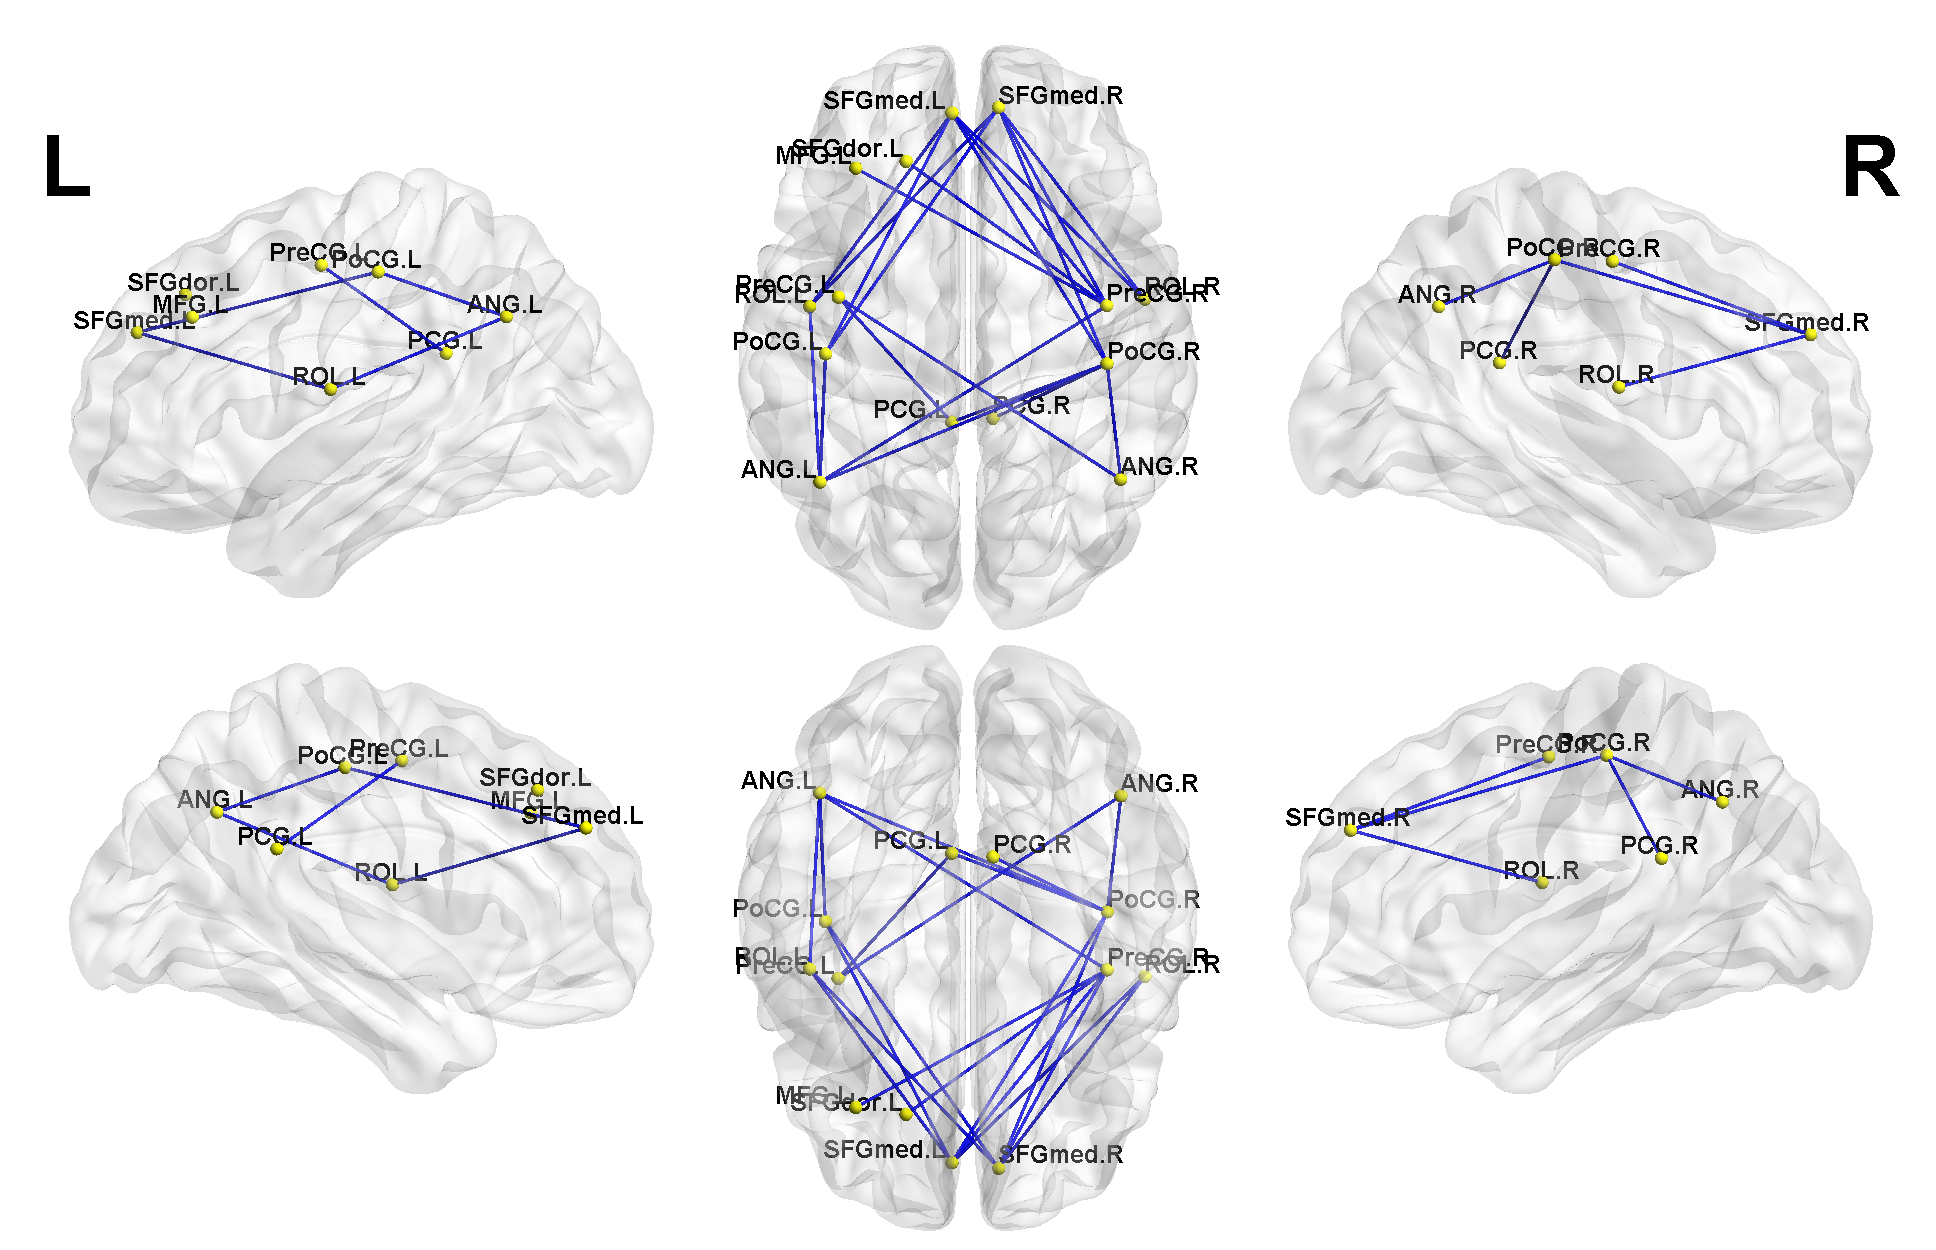
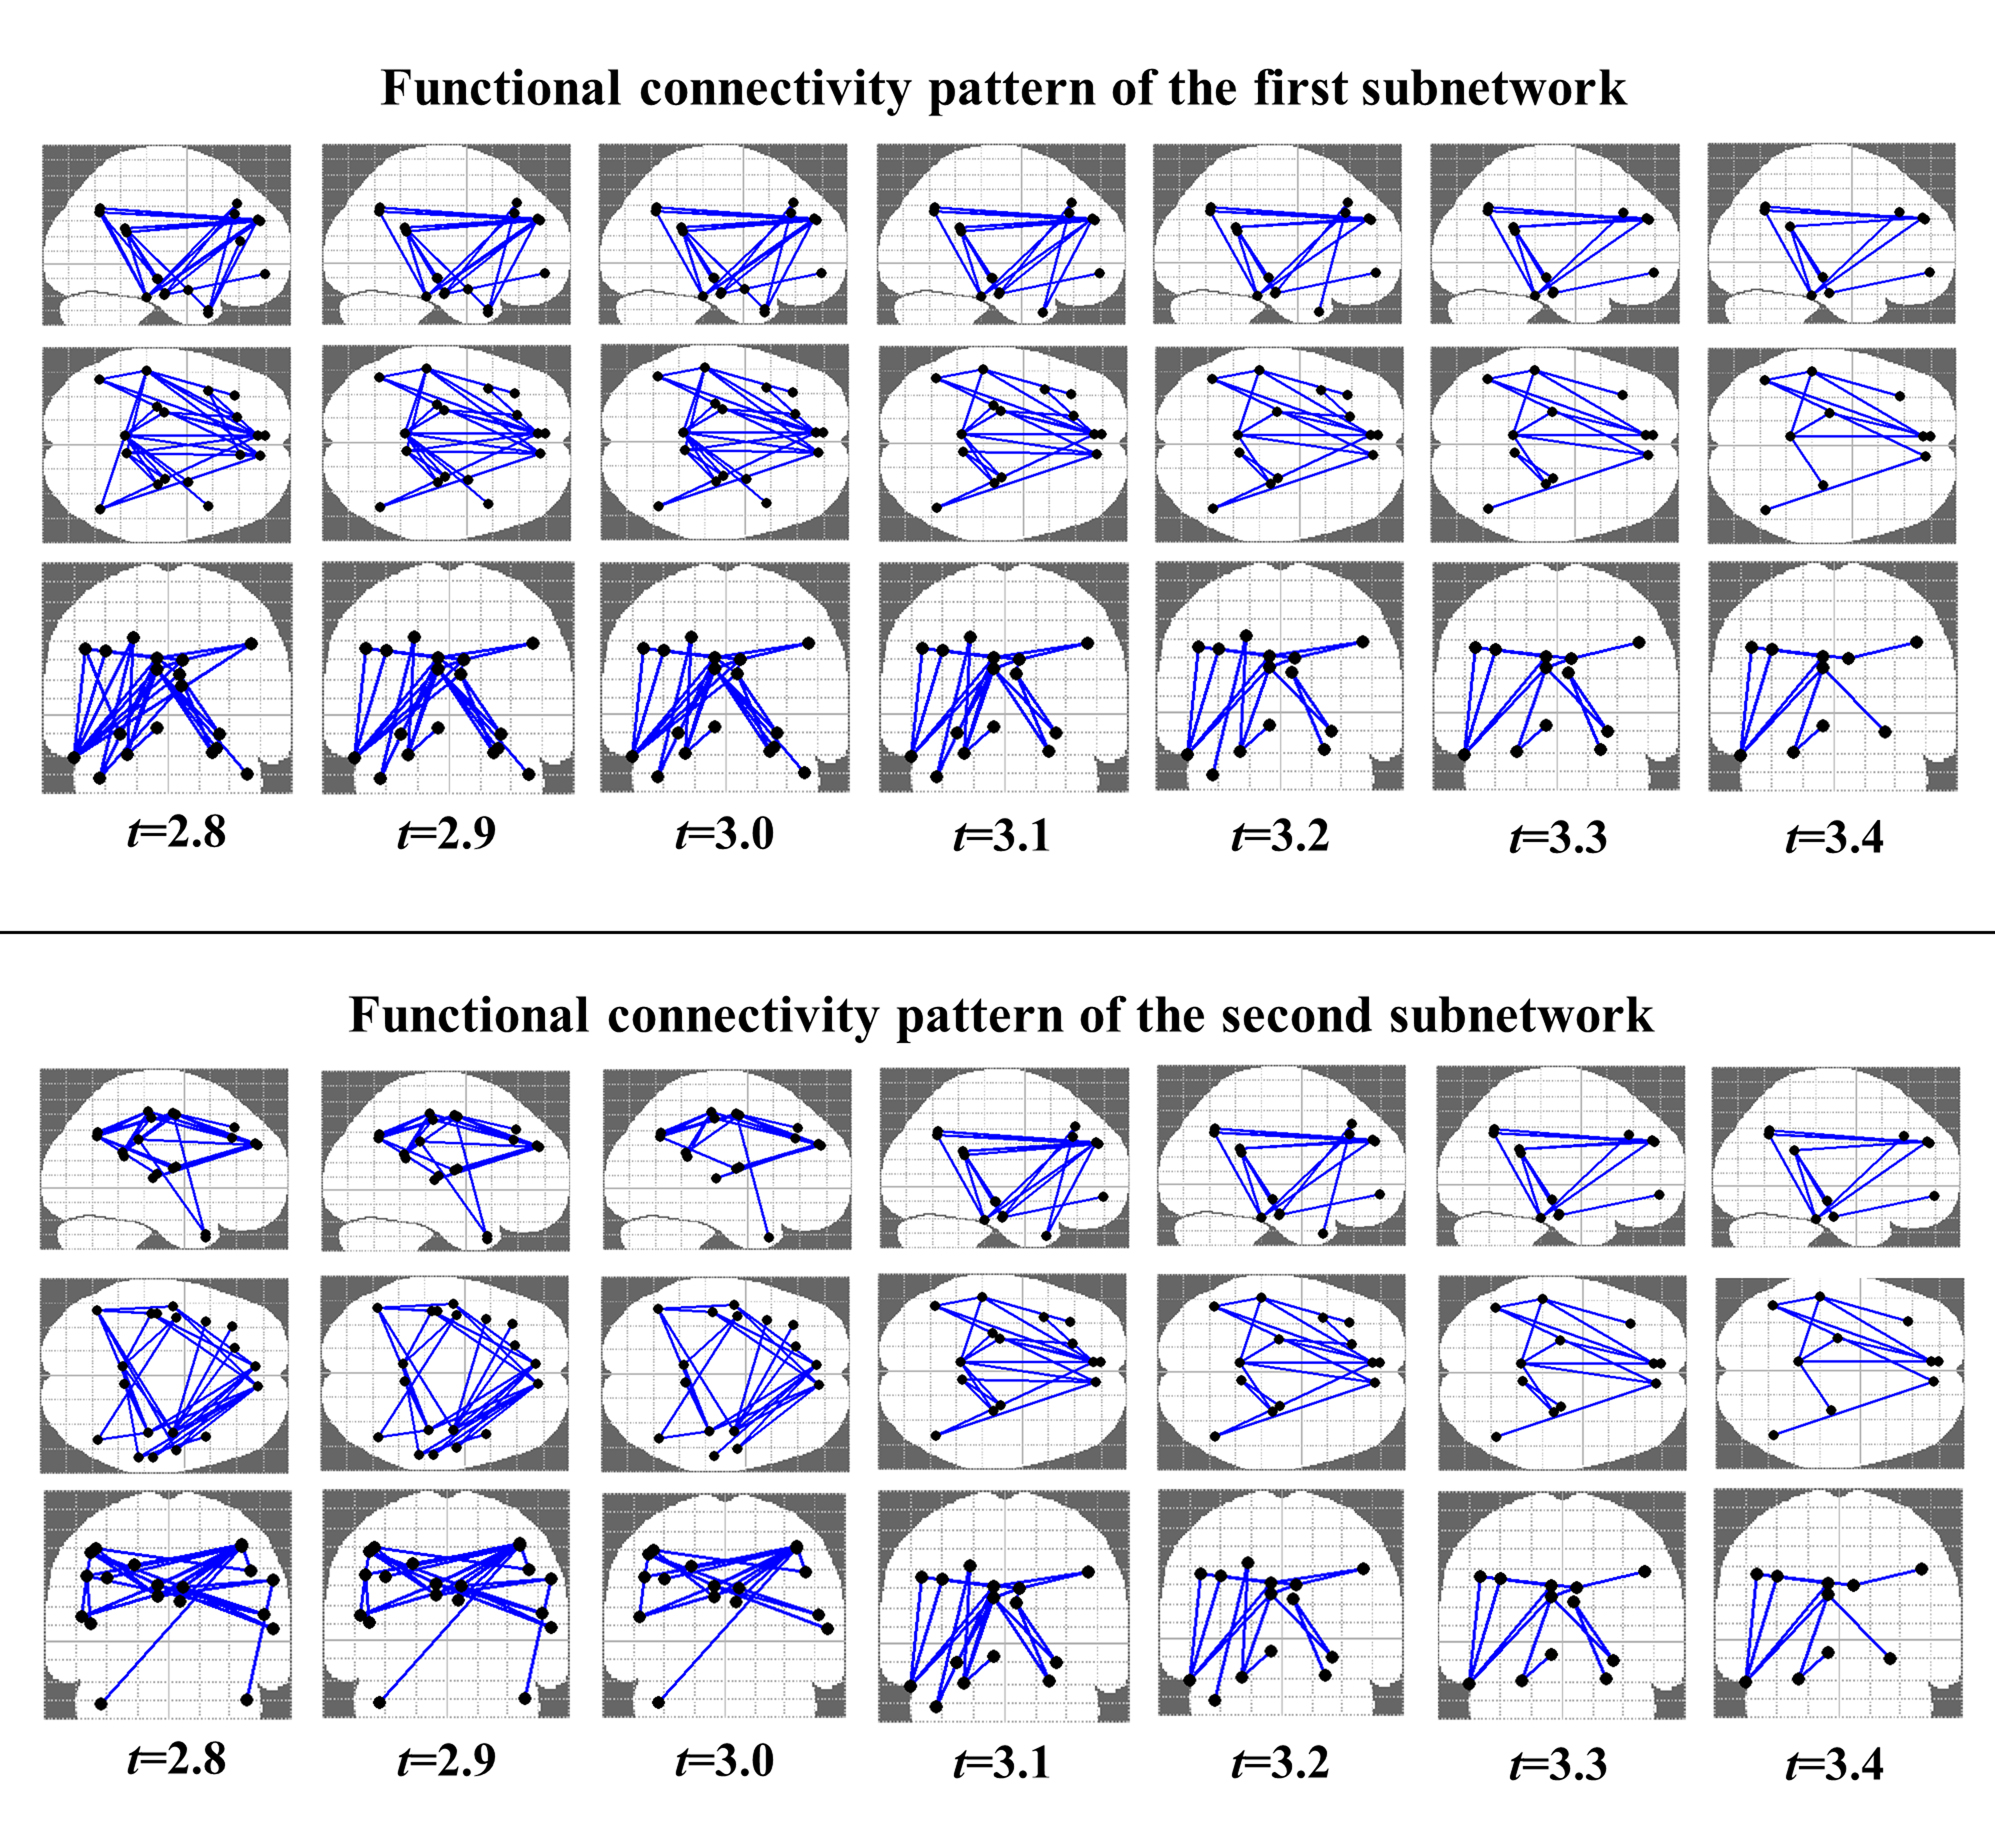
MHE patients showed significant reduction of positive FC within a subnetwork that predominantly involved the regions of the default-mode network,such as the bilateral posterior cingulate gyrus, bilateral medial prefrontal cortex,bilateral hippocampus and parahippocampal gyrus, bilateral angular gyrus, and left lateral temporal cortex. Meanwhile, MHE patients showed significant reduction of negative FC between default-mode network regions (such as the bilateral posterior cingulate gyrus, medial prefrontal cortex, and angular gyrus) and the regions involved in the somatosensory network (i.e., bilateral precentral and postcentral gyri) and the language network (i.e., the bilateral Rolandic operculum). The correlations of FC within the default-mode subnetwork and PHES results were noted.Conclusion
Default-mode network dysfunction may be one of the core issues in the pathophysiology of MHE. Our findings support the notion that HE is a neurological disease related to intrinsic brain network disruption.Acknowledgements
This study was funded by the grants from the National Natural Science Foundation of China (No.81501450), Fujian Provincial Science Fund for Distinguished Young Scholars (No. 2018J06023), Fujian Provincial Program for Distinguished Young Scholars (No.2017B023), and Fujian Provincial Health Commission Project for Scientific Research Talents (2018-ZQN-28).References
1.Bajaj, J.S., Wade, J.B., Sanyal, A.J., 2009b. Spectrum of neurocognitive impairmentin cirrhosis: Implications for the assessment of hepatic encephalopathy. Hepatology50, 2014-2021.
2.Chen, H.J., Jiang, L.F., Sun, T., Liu, J., Chen, Q.F., Shi, H.B., 2015. Resting-statefunctional connectivity abnormalities correlate with psychometric hepaticencephalopathy score in cirrhosis. European Journal Of Radiology 84, 2287-2295.
3.Chen, H.J., Wang, Y., Yang, M., Zhu, X.Q., Teng, G.J., 2014. Aberrantinterhemispheric functional coordination in patients with HBV-related cirrhosis andminimal hepatic encephalopathy. Metabolic Brain Disease 29, 617-623.
4.Lai, C.H., Wu, Y.T., Hou, Y.M., 2017. Functional network-based statistics indepression: Theory of mind subnetwork and importance of parietal region. J AffectDisord 217, 132-137.
5.Lv, X.F., Wu, H.W., Tian, L., Han, L.J., Li, J., Qiu, Y.W., Jiang, G.H., Zhang, X.L.,Zhang, R., Xie, C.M., 2016. Aberrant Resting-State Functional Connectivity Densityin Patients with Hepatitis B Virus-Related Cirrhosis. Biomed Res Int 2016, 4168512.
6.Menon, V., 2011. Large-scale brain networks and psychopathology: a unifying triplenetwork model. Trends Cogn Sci 15, 483-506.
7.Zajac, L., Koo, B.B., Bauer, C.M., Killiany, R., Behalf Of The Alzheimer's DiseaseNeuroimaging, I., 2017. Seed Location Impacts Whole-Brain Structural NetworkComparisons between Healthy Elderly and Individuals with Alzheimer's Disease.Brain Sci 7.
8.Zalesky, A., Fornito, A., Bullmore, E.T., 2010. Network-based statistic: identifyingdifferences in brain networks. Neuroimage 53, 1197-1207.
9.Zhang, G., Cheng, Y., Liu, B., 2017. Abnormalities of voxel-based whole-brainfunctional connectivity patterns predict the progression of hepatic encephalopathy.Brain Imaging Behav 11, 784-796.
Figures