3280
Alterations of the brain microstructure and corresponding functional connectivity in early blind adolescents with and without residual light perception1Department of Radiology, Shenzhen Mental Health Center, Shenzhen Kangning Hospital, Shenzhen, China, 2Institute of Biomedical and Health Engineering, Shenzhen Institutes of Advanced Technology, Chinese Academy of Sciences, Shenzhen, China, 3Department of Mechanical Engineering, Sungkyunkwan University, Suwon, Korea, Republic of, 4Shenzhen Mental Health Center, Shenzhen Kangning Hospital, Shenzhen, China, 5Medical Imaging Center, the First Affiliated Hospital of Jinan University, Guangzhou, China
Synopsis
Previous neuroimaging studies of adult blind have revealed structural and functional neuroplasticity. It is still unclear if the brains of young blind will have the same alterations, and the effects of residual light perception (RLP) on the structure and function of the blind brain cannot be ignored. This study explored the structural and functional brain changes in early blind adolescents (EBAs) with and without RLP using voxel-based analysis method of diffusion tensor imaging data and resting-state functional connectivity analysis. The results provide new insights into the mechanisms underlying the reorganization of brain in EBAs with or without RLP.
Introduction
Although evidence from research on blind adults supports that visual deprivation early in life leads to structural and functional disruption or even reorganization of the brain, whether early blind adolescents (EBAs) show similar patterns remains unknown. Moreover, the effect of residual light perception on the brain structure and function is a variable that cannot be ignored. Thus, the first purpose of this study was to explore the structural and functional alterations of the brain in EBAs compared to normal-sighted controls (NSCs). The second purpose was to explore the effects of residual light perception in EBAs on brain microstructure and function.Method
Diffusion tensor imaging (DTI) and resting-state functional magnetic resonance imaging (rs-fMRI) data of 23 EBAs (8 with residual light perception, LP group, age range 11-15, 13.2 ± 1.5 years; 15 without light perception, NLP group, age range 11-18, 14.7 ± 2.3 years) and 21 age- and gender-matched NSCs (age range 11-19, 14.9 ± 2.3 years) were acquired. DTI and rs-fMRI preprocessing were performed with the FMRIB Software Library (FSL5.0; http://www.fmrib.ox.ac.uk/fsl) and the toolbox for Data Processing & Analysis for Brain Imaging (DPABI, http://rfmri.org/dpabi)1, respectively. Then whole-brain voxel-based analyses (VBA) of DTI metrics were used to detect the alterations of brain microstructure. Two-sample t-tests were conducted to assess intergroup differences in DTI metrics between LPs, NLPs and NSCs. Afterwards, the clusters showing significant group difference in VBA were selected as the region-of-interest seeds for resting-state functional connectivity (RSFC) analyses. Finally, two-sample t-tests were performed to investigate the alterations of corresponding functional connectivity between groups.Results
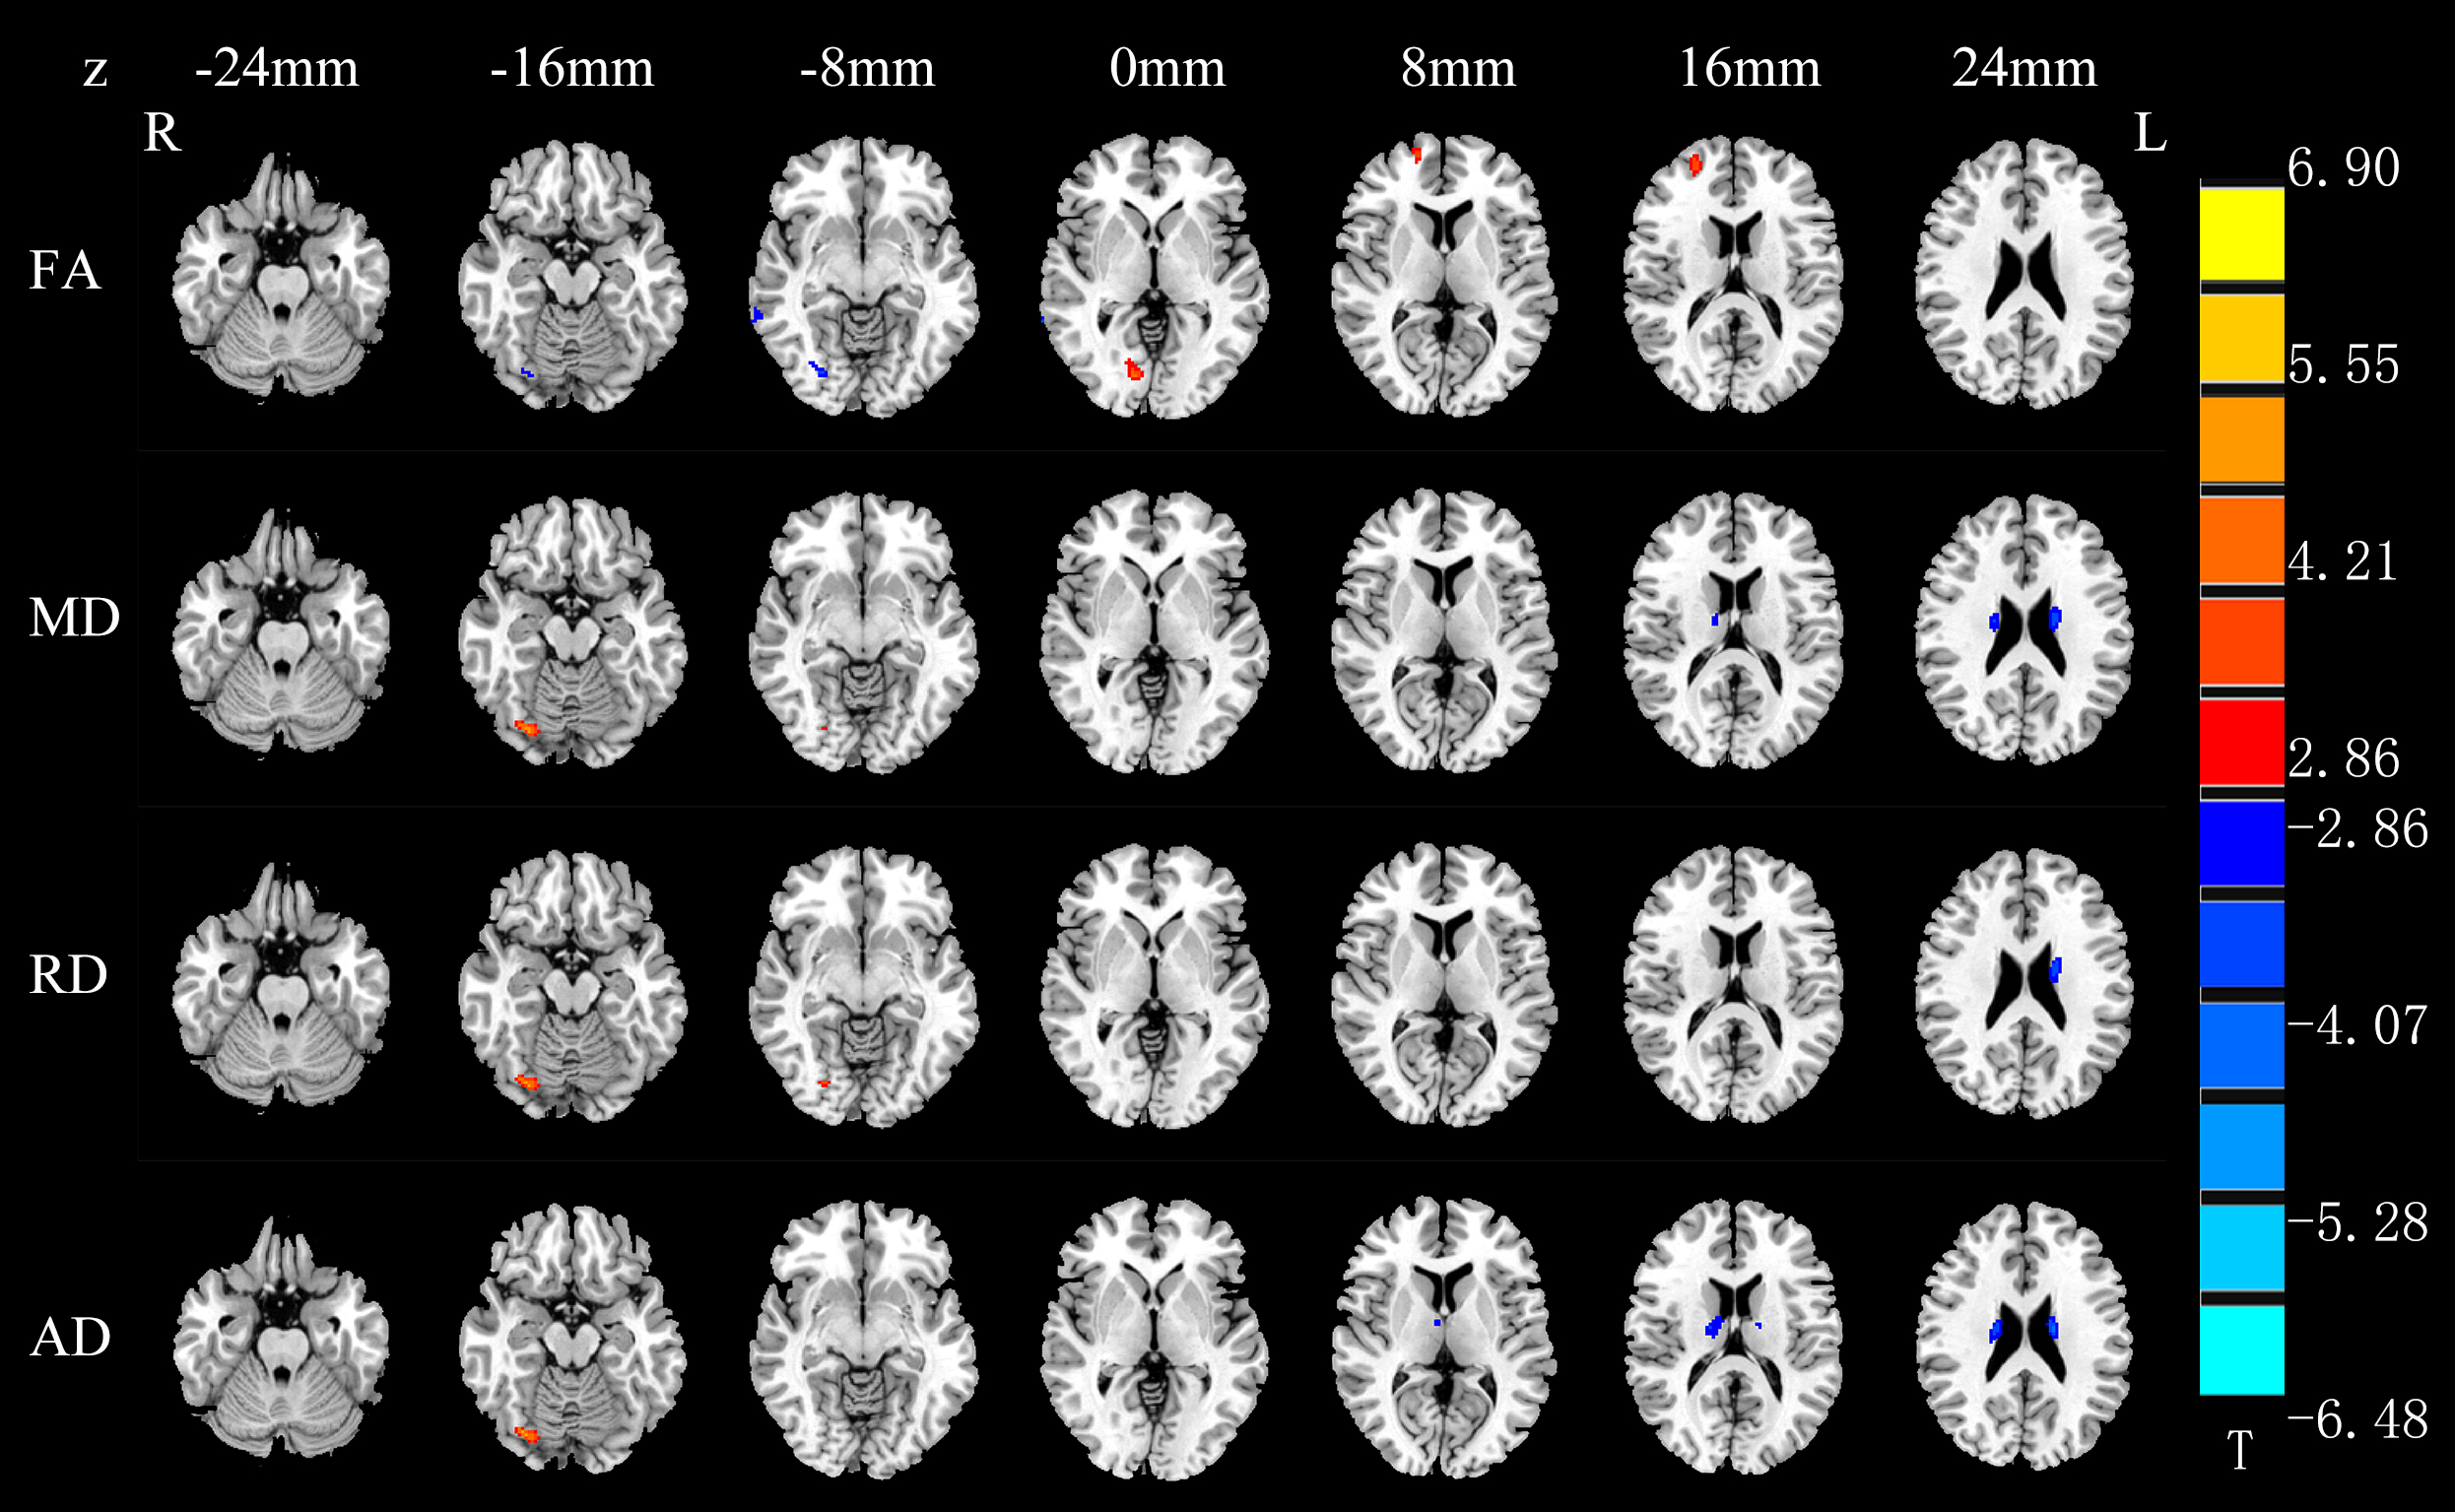
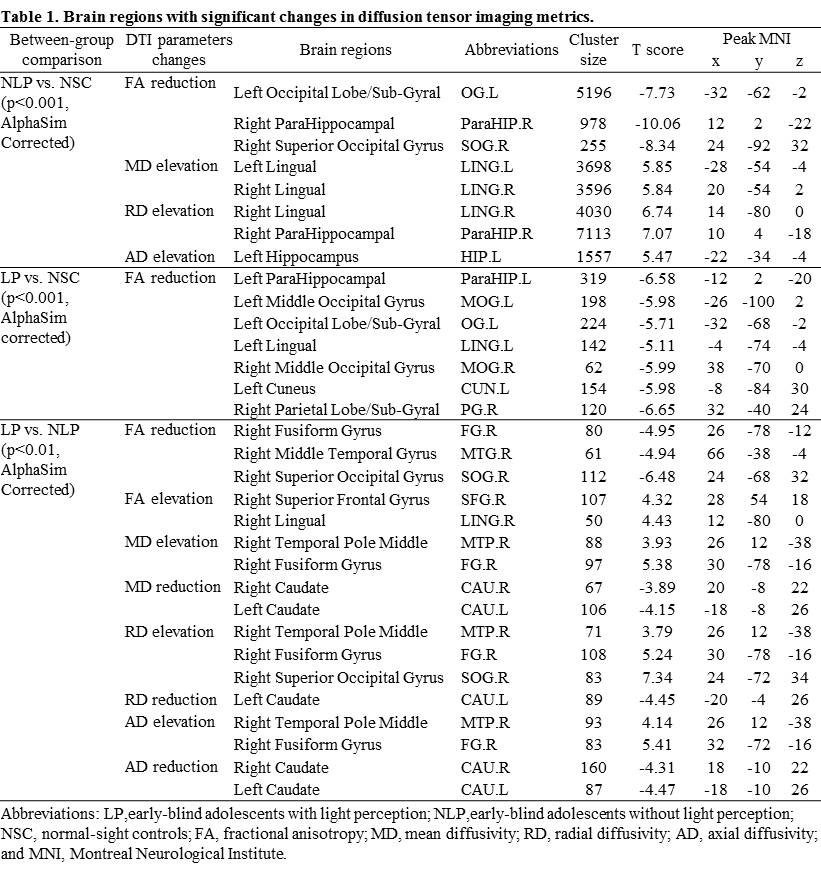
VBA analyses revealed lower fractional anisotropy (FA) in the left occipital lobe, right parahippocampal gyrus and right superior occipital gyrus, higher mean diffusivity (MD) in bilateral lingual gyrus, as well as higher radial diffusivity (RD) in the right lingual gyrus and parahippocampal gyrus in NLPs than in NSCs (p<0.001, AlphaSim corrected; Table 1). Compared with NSCs, LPs showed significant FA reduction in bilateral middle occipital gyrus, left lingual gyrus, left cuneus, left parahipocampal, and right parietal lobe/sub-gyral (p<0.001, AlphaSim corrected; Table 1). In addition, lower FA values were observed in right fusiform gyrus, right middle temporal gyrus and superior occipital gyrus, and higher FA values in right superior frontal gyrus in LPs than NLPs (p<0.01, AlphaSim corrected; Table 1). Increased MD, RD, and axial diffusivity (AD) in right fusiform gyrus and middle temporal gyrus, and reduced MD, RD, AD in bilateral caudate were also observed in LPs compared to NLPs (p<0.01, AlphaSim corrected; Table 1 and Figure 1).
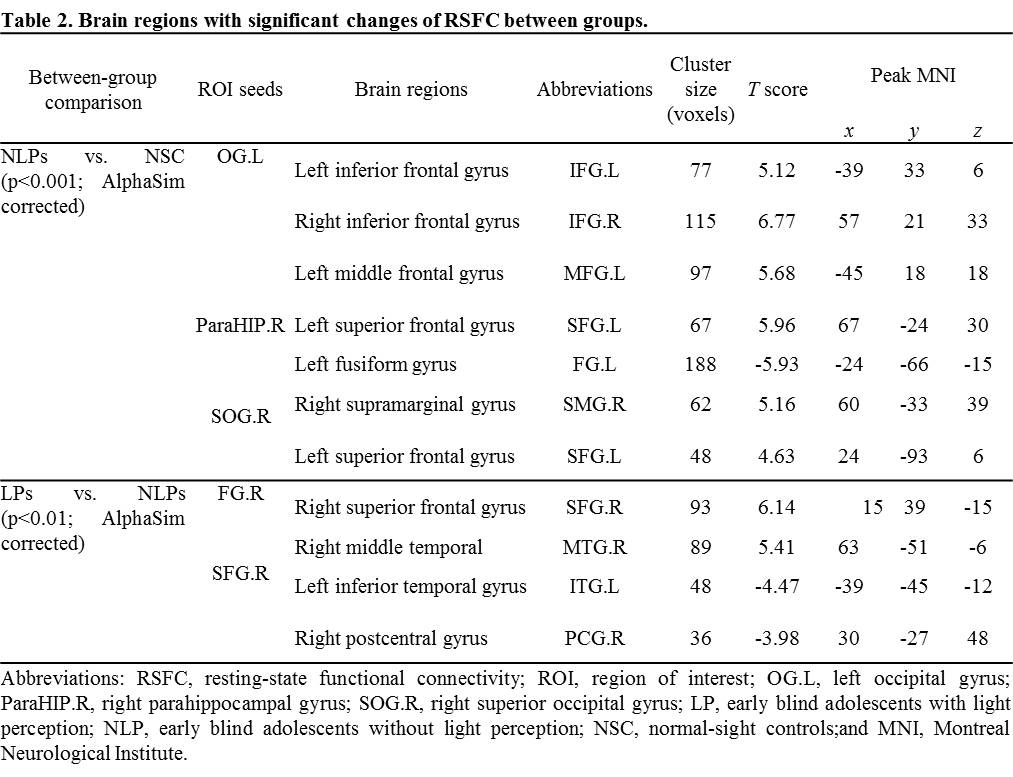
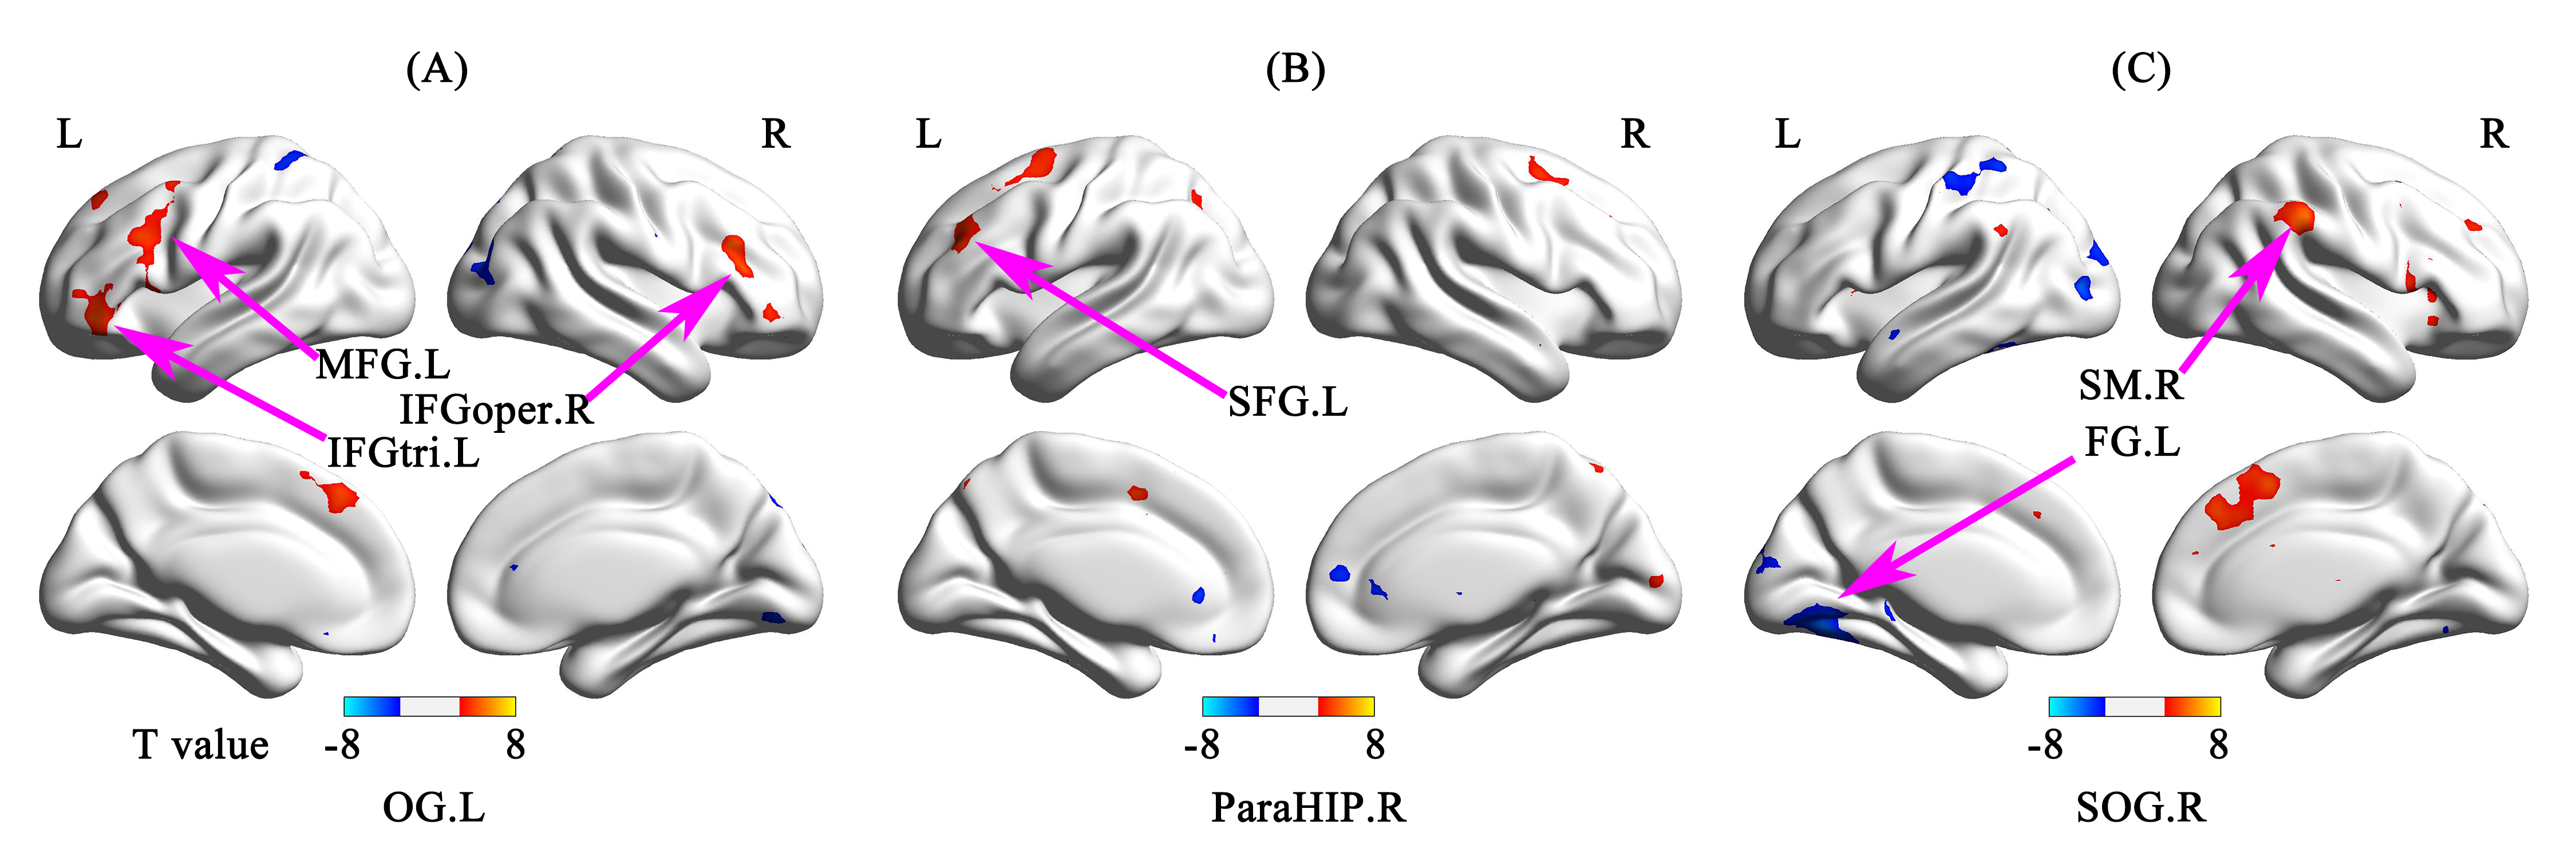
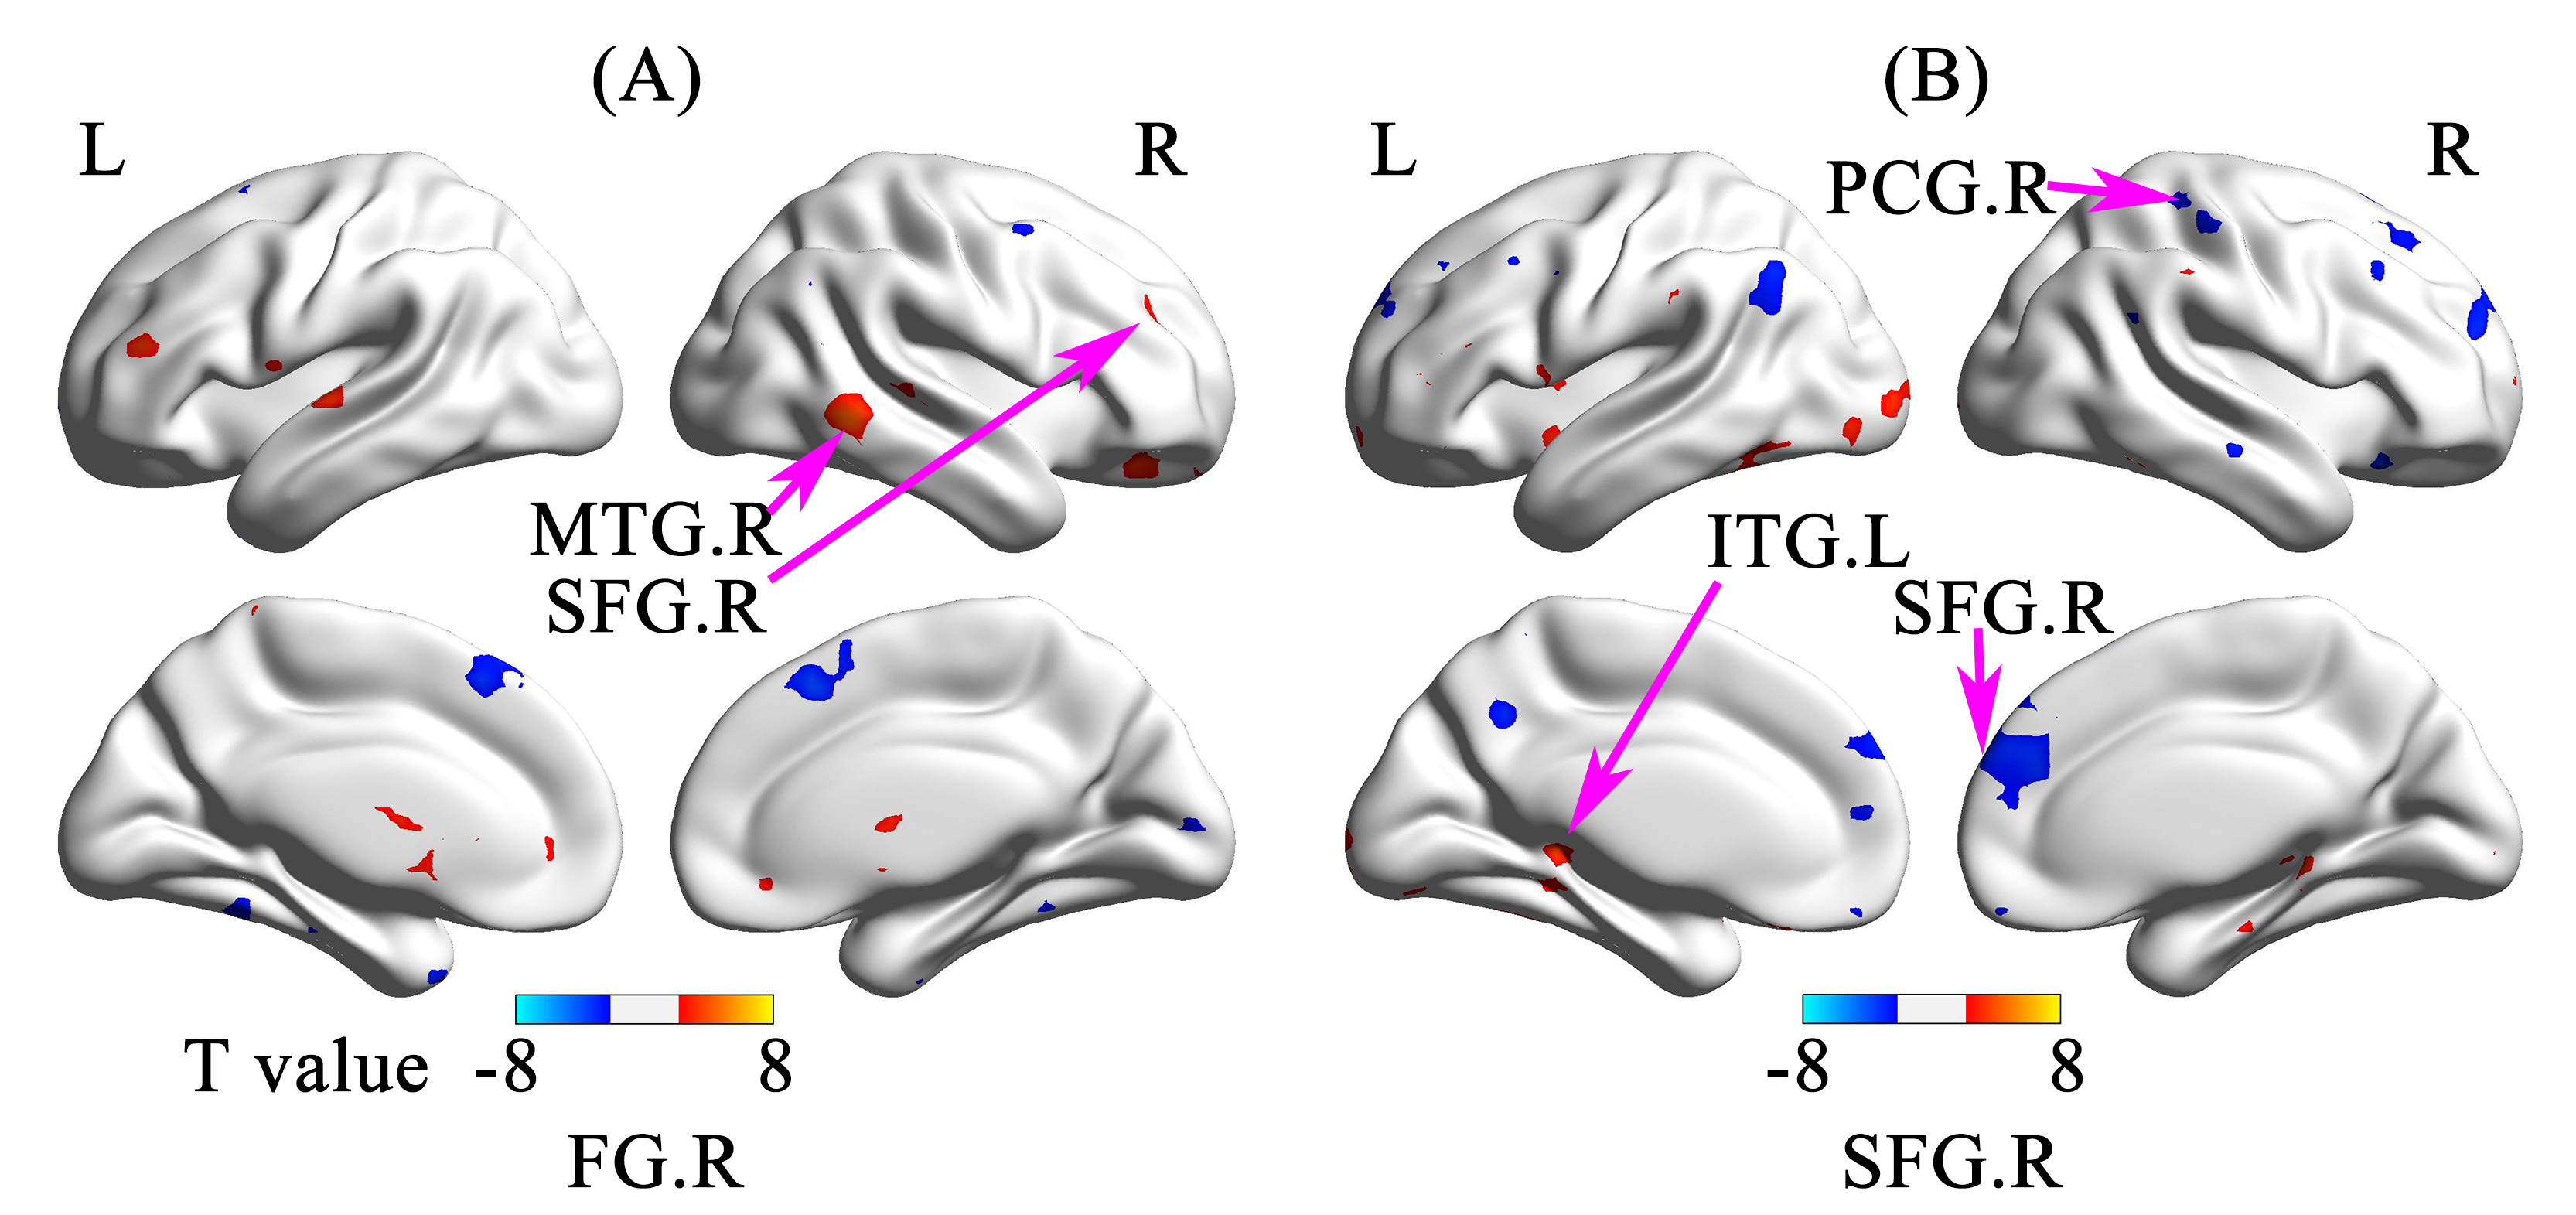
As the results of RSFC analyses, compared to NSCs, left occipital lobe of NLPs showed enhanced RSFC with left inferior frontal triangular areas, left middle frontal gyrus, and right inferior frontal opercular areas; right parahippocampal gyrus of NLPs showed enhanced RSFC with left superior frontal gyrus; right superior occipital gyrus of NLPs showed enhanced RSFC with right supramarginal gyrus/left superior frontal gyrus and decreased RSFC with left fusiform gyrus (p<0.001; AlphaSim corrected; Table 2 and Figure 2). Additionally, compared to NLPs, the RSFC results of LPs showed enhanced RSFC between right fusiform gyrus and right superior frontal orbital areas/right middle temporal gyrus, and between right superior frontal gyrus and left inferior temporal gyrus, while the RSFC between right superior frontal gyrus and right postcentral gyrus/superior frontal gyrus were decreased (p<0.01; AlphaSim corrected; Table 2 and Figure 3).
Discussion and Conclusion
The VBA results showed that structural disruptions of both EBA groups were mainly located in the occipital visual pathway. Compared with NLPs, LPs showed significant FA elevation in superior frontal gyrus and diffusivity reduction in caudate nucleus. Since the superior frontal gyrus was anatomically connected with cognitive control network, and functionally involved in complex cognitive processing2,3, the increased FA of right superior frontal gyrus in LPs vs. NLPs may suggest that residual light perception can play a role in complex cognitive function or reduce damage to cognitive function in EBAs due to lack of visual information. As the caudate nucleus is known to integrate spatial information with motor behavior formulation and associate with some learning processing4,5, the decreased diffusivity parameters of this area in LPs relative to NLPs demonstrate that the function of guiding motor performance and learning in caudate nucleus may partly be mediated by the light perception. Moreover, we found functional, but not structural, reorganization in NLPs compared with NSCs, and the alterations of functional connectivity suggest more functional neuroplasticity than dysfunction in EBAs. Taken together, these findings provide new insights into the mechanisms underlying the reorganization of the brain in EBA with and without residual light perception.Acknowledgements
No acknowledgement found.References
1. Yan, C.G., Wang, X.D., Zuo, X.N., et al. (2016). DPABI: Data Processing & Analysis for (Resting-State) Brain Imaging. Neuroinformatics 14, 339-351.
2. Li, W., Qin, W., Liu, H., et al. (2013). Subregions of the human superior frontal gyrus and their connections. Neuroimage 78, 46-58.
3. Campbell, D.W., Wallace, M.G., Modirrousta, M., et al. (2015). The neural basis of humour comprehension and humour appreciation: The roles of the temporoparietal junction and superior frontal gyrus. Neuropsychologia 79, 10-20.
4. Gombkoto, P., Rokszin, A., Berenyi, A., et al. (2011). Neuronal code of spatial visual information in the caudate nucleus. Neuroscience 182, 225-231.
5. Anderson, B.A., Kuwabara, H., Wong, D.F., et al. (2017). Linking dopaminergic reward signals to the development of attentional bias: A positron emission tomographic study. Neuroimage 157, 27-33.
Figures