3277
Resting State Olfactory Network Functional Connectivity in Tremor- and Rigidity-predominant Patients with Parkinson’s disease1Radiology, Penn State University, Hershey, PA, United States, 2Neurology, Penn State University, Hershey, PA, United States
Synopsis
Parkinson's disease (PD) is a neurodegenerative disease, consisting of a broad spectrum of motor and non-motor symptoms. We used resting-state fMRI to investigate differences in functional connectivity (FC) of the olfactory network (ON) in two major PD subtypes: akinetic-rigid (PDAR) and tremor predominant (PDT). Significant differences in ON FC were found between normal controls, PDAR, and PDT groups in six brain regions. Lower FC was observed in the orbitofrontal cortex, insula, and posterior cingulate cortex in the PDAR group compared to the PDT group. Our findings suggest that the ON FC is deferentially affected in the two PD subtypes.
INTRODUCTION: Parkinson's disease (PD) is traditionally characterized by tremor, rigidity, and bradykinesia [1-5]. Analysis of prominent motor symptoms has identified, two major PD subtypes, akinetic-rigid (PDAR) and tremor predominant (PDT), which may have different underlying pathophysiology [1]. However, PD is a multisystem disorder involving a combination of classical motor deficits and a wide range of non-motor symptoms including autonomic dysregulation, hyposmia, sleep disturbances, depression, cognitive dysfunction, and neuropsychiatric symptoms [6]. Perhaps the most intriguing non-motor feature of PD is olfactory impairment which was first reported in 1975 [7]. Differences in olfactory function have been observed between PDT and PDAR samples [8]. Despite these findings, little is known about the neural basis of olfactory impairment in PD. Here we used resting-state fMRI (rs-fMRI) to investigate differences in olfactory network (ON) functional connectivity (FC) in PDAR and PDT patients with closely matched demographic and cognitive variables. Since most task-related brain networks are recapitulated during resting state, we hypothesized that differential resting state FC in the ON would be observed between the PDAR and PDT groups [9].
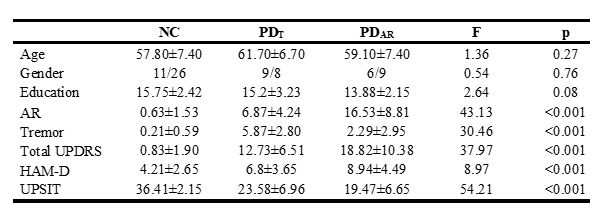
METHODS: We recruited 17 PDAR,15 PDT, and 24 normal controls (NC) who were matched in age, gender, PD disease severity, and cognitive performance (based on comprehensive neuropsychological tests [Table 1]). The rs-fMRI data was acquired on a Siemens 3T MRI system (Magnetom Trio, Siemens Medical, USA) using an 8-channel head coil with the following parameters: TR / TE / FA = 2000 ms / 30 ms / 90°; FOV = 240 ´ 240 mm2; acquisition matrix = 80 x 80; # of slices = 34; slice thickness = 4 mm, and the number of repetitions = 240. A 3D MPRAGE image was also acquired for volumetric analysis and anatomical overlay. We used a seed based functional connectivity (FC) analysis, described in Tobia et al., (2016), to identify differences in ON FC between PDAR and PDT [10]. Briefly, seed time courses were extracted from the preprocessed rs-fMRI data. Seeds comprising the core ON were obtained from a meta-analysis that identified the piriform cortex (POC) [(−22 0 −14) and (22 2 −12)] and the orbitofrontal cortex (OFC) [(− 24 30 − 10) and (28 34 − 12)] as most likely to be activated by olfactory stimulation [11].
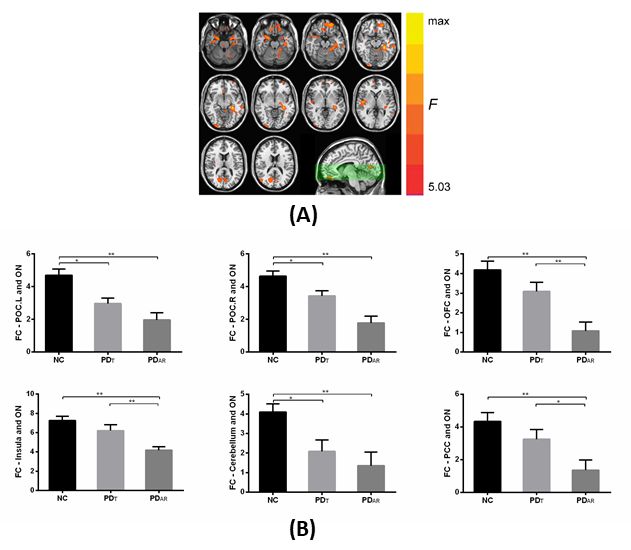
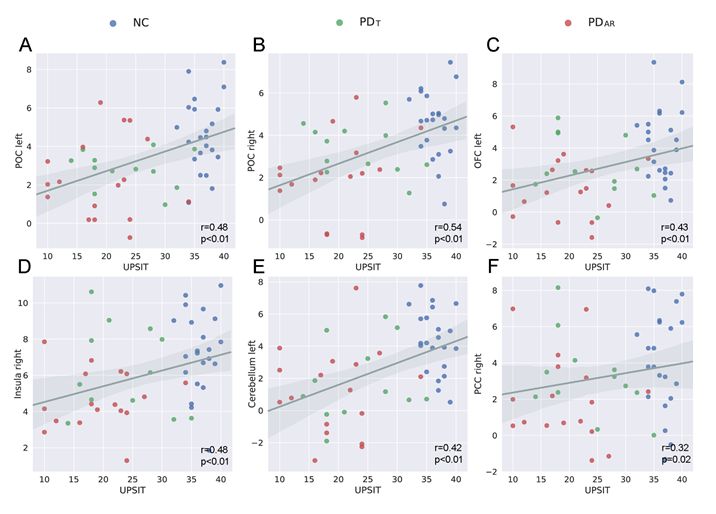
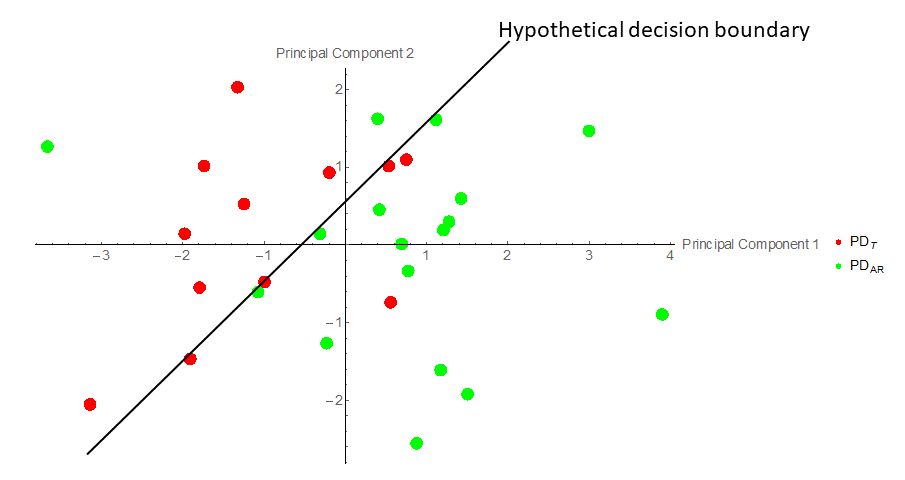
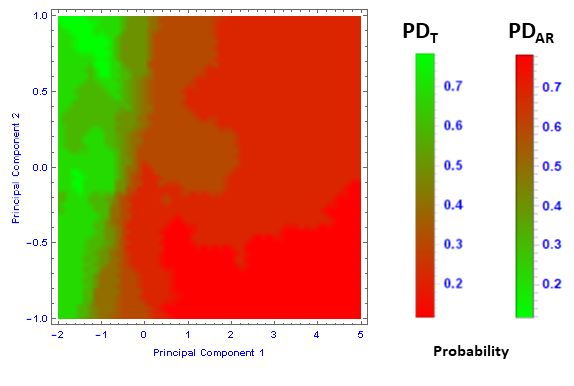
RESULTS: Differences among the NC, PDAR and PDT groups in the ON FC are shown in Figure 1. Significant differences were identified in six brain regions and lower FC was detected in the OFC, insula and posterior cingulate cortex (PCC) in the PDAR compared to PDT (Figure 1B). FC values in these six brain regions were not correlated with UPSIT in respective groups, but it was positively correlated with UPSIT scores in the combined group, likely reflecting the effects of PD pathology (Figure 2). Further, we conducted a principal component analysis (Figure 3) of the multivariate data shown in Figure 1B. We used the nearest neighbor method in Mathematica (Wolfram, Champaign, IL, USA) to develop a classifier function shown in Figure 4. The classification accuracy for PDT was 67% and for PDAR was 83%.
CONCLUSION: Results support a type dependent FC disruption in the ON in PD patients with comparable behavioral performance, despite the absence of behavioral olfactory function differences. Our findings shed new insight in to the critical roles played by the ON and cerebello-thalamo-cortical (CTC) pathways in PDT and PDAR groups, and suggest that the two subtypes may have differential underlying pathophysiology [1, 2]. It is known that the PDAR subtype is at a higher risk of developing dementia [2]. Thus, rs-fMRI should be further investigated to evaluate its usefulness as a possible diagnostic tool (or biomarker) capable of identifying PD patients who are at risk of developing akinetic-rigidity symptoms. Future studies aimed at validating the current findings and longitudinal investigation of the functional integrity of the ON will provide further insights into the relationship between olfactory and motor deficits in PD.
Acknowledgements
This work was supported by the NINDS grant NS060722, theHMC GCRC (NIH M01RR10732), GCRC Construction Grants(C06RR016499), and the Department of Radiology, Pennsylvania State University College of Medicine. The authors report no conflict of interest.References
[1]. Caligiore, D., et al., (2016), ‘Parkinson’s disease as a system-level disorder’, npj Parkinson's Disease, vol 2, 16025; doi:10.1038/npjparkd.2016.25
[2]. Karunanayaka, P., et al., (2016), ’Default mode network differences between rigidity- and tremor-predominant Parkinson's disease’, Cortex, vol 81, pp 239-250.
[3]. Aarsland, D., et al., (2010), ‘The epidemiology of dementia associated with Parkinson disease’, J Neurol Sci, vol 289, no 1-2, pp 18-22.
[4]. Lewis, M.M., et al., (2011), ’Differential involvement of striato- and cerebello-thalamo-cortical pathways in tremor- and akinetic/rigid-predominant Parkinson's disease’. Neuroscience, vol 177, pp 230-239.
[5]. Helmich, R.C., et al., (2012). ‘Cerebral causes and consequences of parkinsonian resting tremor: a tale of two circuits?’, Brain, vol 135, no 11, pp 3206-3226.
[6]. Chaudhuri, K.R., et al., (2006). Non-motor symptoms of Parkinson's disease: diagnosis and management. Lancet Neurol 2006;5:235–45.
[7]. Ansari, K.A., et al. (1975). Olfactory function in patients with Parkinson's disease. J Chronic Dis;28:493–7.
[8]. Stern, M.B., (1994). Olfactory function in Parkinson’s disease subtypes. Neurology;44:266-268.
[9]. Deco, G., et al., (2011). The dynamical balance of the brain at rest. Neuroscientist, vol 1, pp 107-23, doi: 10.1177/1073858409354384.
[10]. Tobia, M.J., et al., (2016). Intrinsic intranasal chemosensory brain networks shown by resting-state functional MRI. NeuroReport, 27(7), 527-531.
[11]. Seubert, J., et al., (2013). Statistical localization of human olfactory cortex. Neuroimage; 66:333–342.
Figures