3270
Change in fMRI activation between deep brain stimulation on and off states in patients with Parkinson’s disease during a stop-signal task1Imaging Institute, Cleveland Clinic, Cleveland, OH, United States, 2Radiology, Cleveland Clinic Lerner College of Medicine, Cleveland, OH, United States, 3Psychology, University of San Diego, San Diego, CA, United States, 4Neurological Institute, Cleveland Clinic, Cleveland, OH, United States, 5Neurosurgery, University of California Los Angeles, Los Angeles, CA, United States
Synopsis
Motor regulation pertaining to stopping when necessary is impaired in Parkinson disease (PD) and is modulated by deep brain stimulation (DBS) therapy. We performed fMRI study at 3T using a stop-signal task with PD patients having implanted DBS, and investigated differences in activation in networks responsible for stopping between on and off states of DBS. Overall, larger and stronger activation was observed in this preliminary study when the DBS was turned on for go (when the subject is supposed to press button) minus baseline and successful stop (when the subject successfully stopped) minus go contrasts.
Introduction
The regulation of motor activity, particularly under condition of when stopping is necessary, is fundamental to healthy human interactions with the environment. This aspect of motor regulation is not only impaired by Parkinson disease (PD),1-3 but may also be modulated by therapeutic deep brain stimulation (DBS).4, 5 The literature suggests that managing stopping is supported by distinct fronto-basal ganglia circuits.6, 7 Mapping activation of distinct networks with stopping task and modulation thereof caused by DBS, is a pathway in understanding the basic science of action regulation, the role of separate but parallel long-range human brain networks for action regulation, differential modulation of DBS of action suppression functions, and ultimately for circuit-specific implants that modulate human action in various disorders. To this end, we report preliminary findings of differences in activation patterns between DBS on and off states during a stop-signal task in patients with PD.Methods
Three PD patients (67±4 y, 2 male) having bilateral Medtronic Activa PC implant with 3389 leads were scanned with a 3T whole body Siemens Prisma scanner under an IRB-approved protocol. The MRI scans consisted of (i) T1W anatomical MPRAGE scan (TR/TE/TI/Flip angle=1900ms/1.71ms/900ms/8o, 120 slices, FOV=256×256 mm2, voxel size=1×1x1.2mm3) and (ii) gradient echo echo planar fMRI scan (GRE-EPI) scan (TR/TE=2800ms/29ms, 31 slices, FOV=256×256mm2, voxel size=2×2x4mm3). Safety of performing MRI with implanted DBS at 3T Prisma with the scan protocol was ensured by phantom scans prior to in vivo scans. Subjects were scanned with (i) DBS parameters set by healthcare provider and (ii) the DBS turned off – the order of the off and on scans was randomized. The stop-signal task used in the study was designed as described by Aron et al8 and consisted of subjects looking at a projection screen and pressing the left/right button of a Cedrus Lumina button box (Cedrus, San Pedro, CA) with the right hand during the appearance of a left/right facing arrow on the screen. 25% of the total number of 128 trials (performed twice) were associated with a beeping tone, during which the subjects were instructed to try not to press any button. Stop signal delay (SSD), the delay between the stimulus arrow and the beep during the stop trial, was made to move up and down by 50ms based upon success or failure respectively in stopping. A cross-hair fixation point was used in the absence of any arrow. Subjects were instructed to respond as fast and accurately as possible. Data analyses were performed as by Aron et al.8 For behavioral data, the 2 SSD staircases were used to generate mean GoRT (reaction time for Go trial), number of go omissions, go errors and stop signal reaction time (SSRT), following which the onset files for fMRI analyses were generated. fMRI data were analyzed using FSL software (www.fmrib.ox.ac.uk/fsl) and consisted of (i) motion correction with MCFLIRT,9 (ii) spatial smoothing using a 5mm full-width-half-maximum Gaussian kernel, (iii) temporal filtering using a nonlinear high-pass filter with 66s cutoff, and (vi) registering the EPI images to the MPRAGE images and then to Montreal Neurological Institute space. Go-baseline, success stop (SuccStop), failed stop and SuccStop-go contrast maps were calculated with cluster-detection threshold>2.3 and cluster probability (corrected for whole-brain multiple comparison using Gaussian random field theory) as displayed in Figures.Results and Discussion
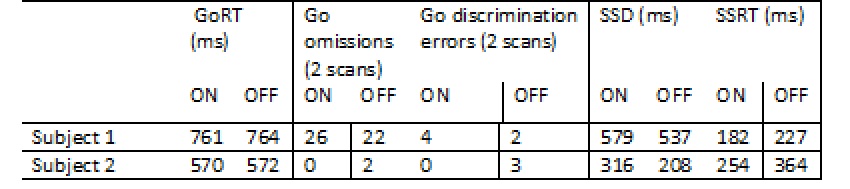
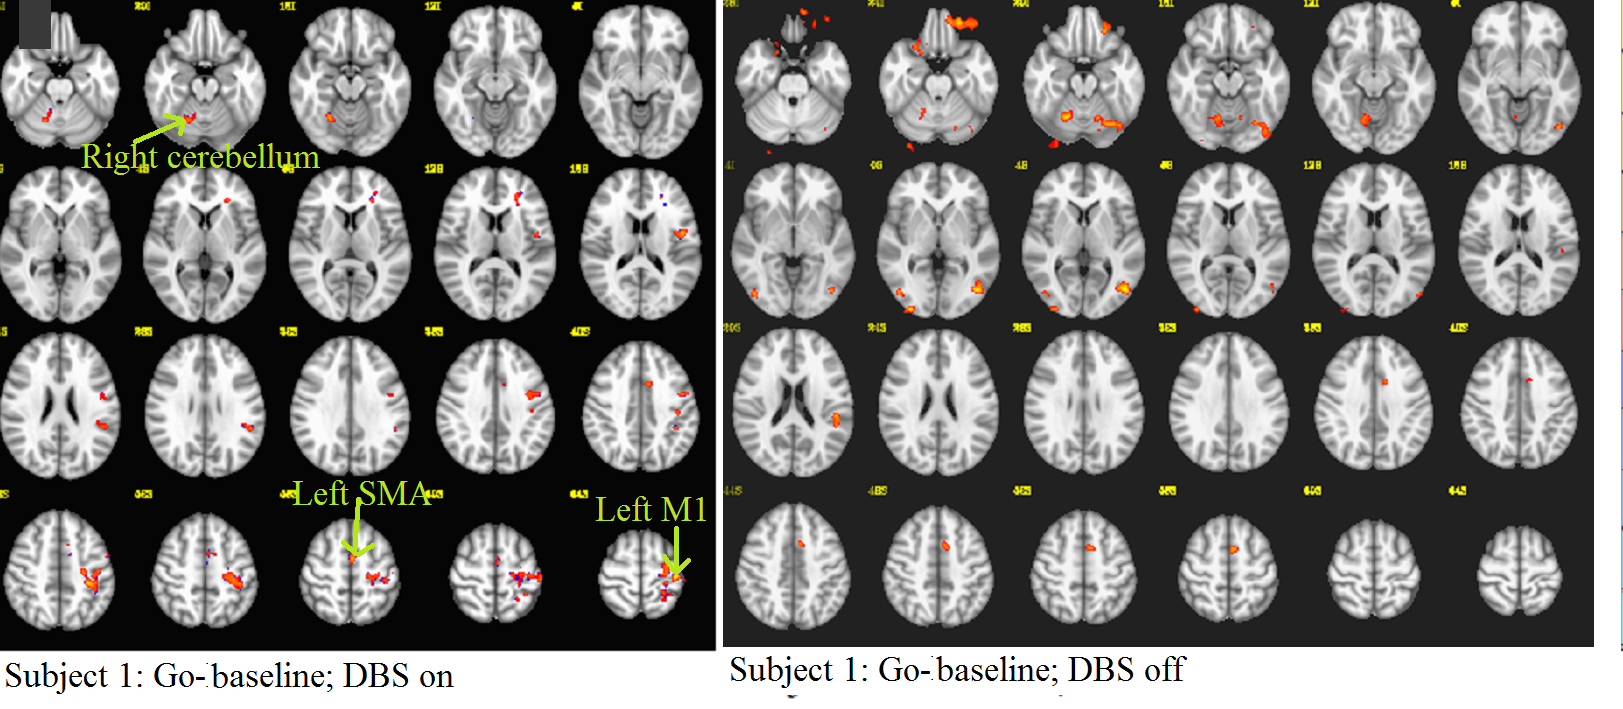
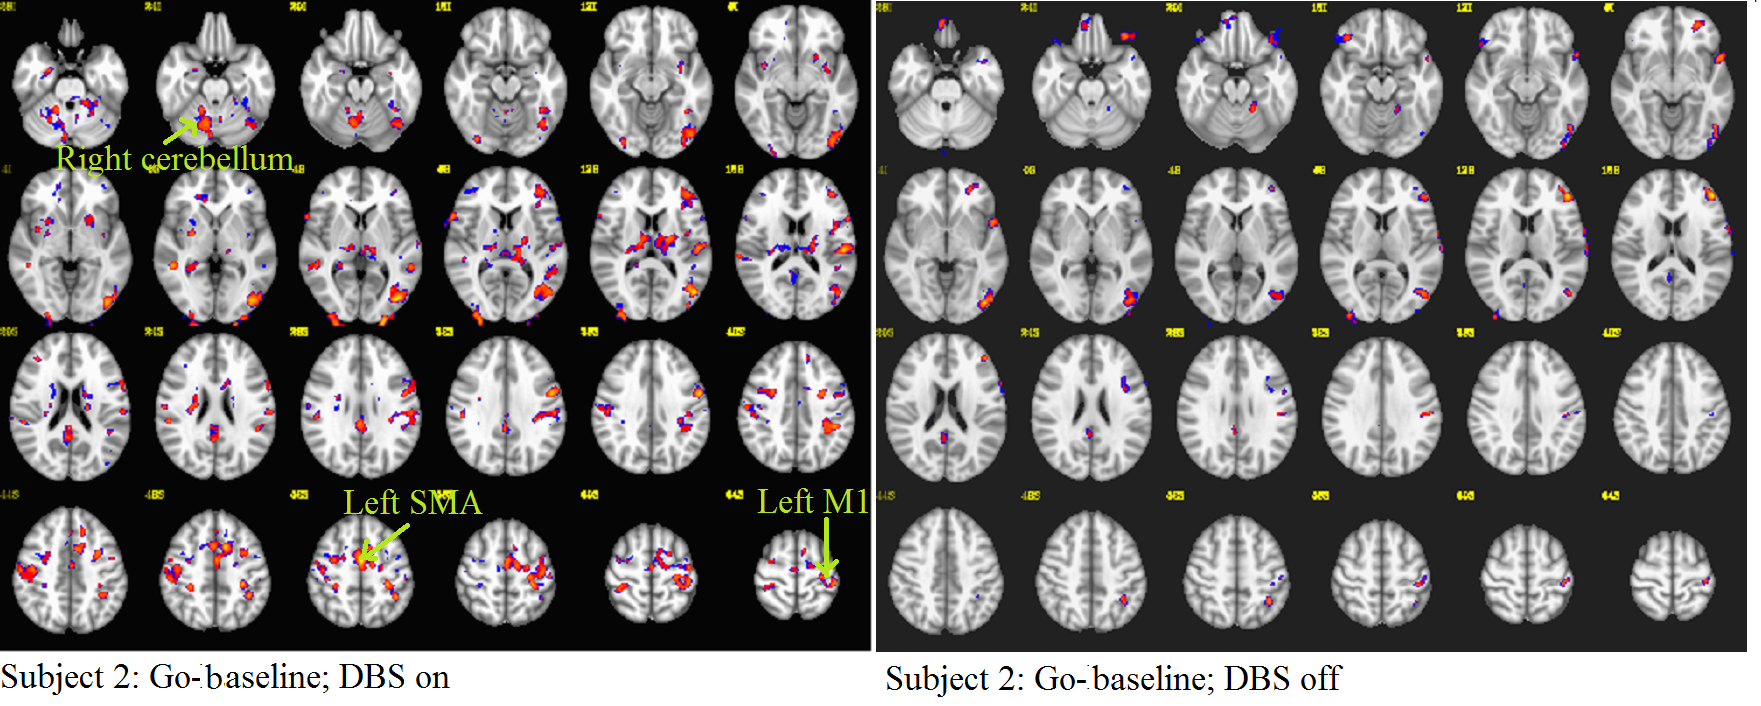
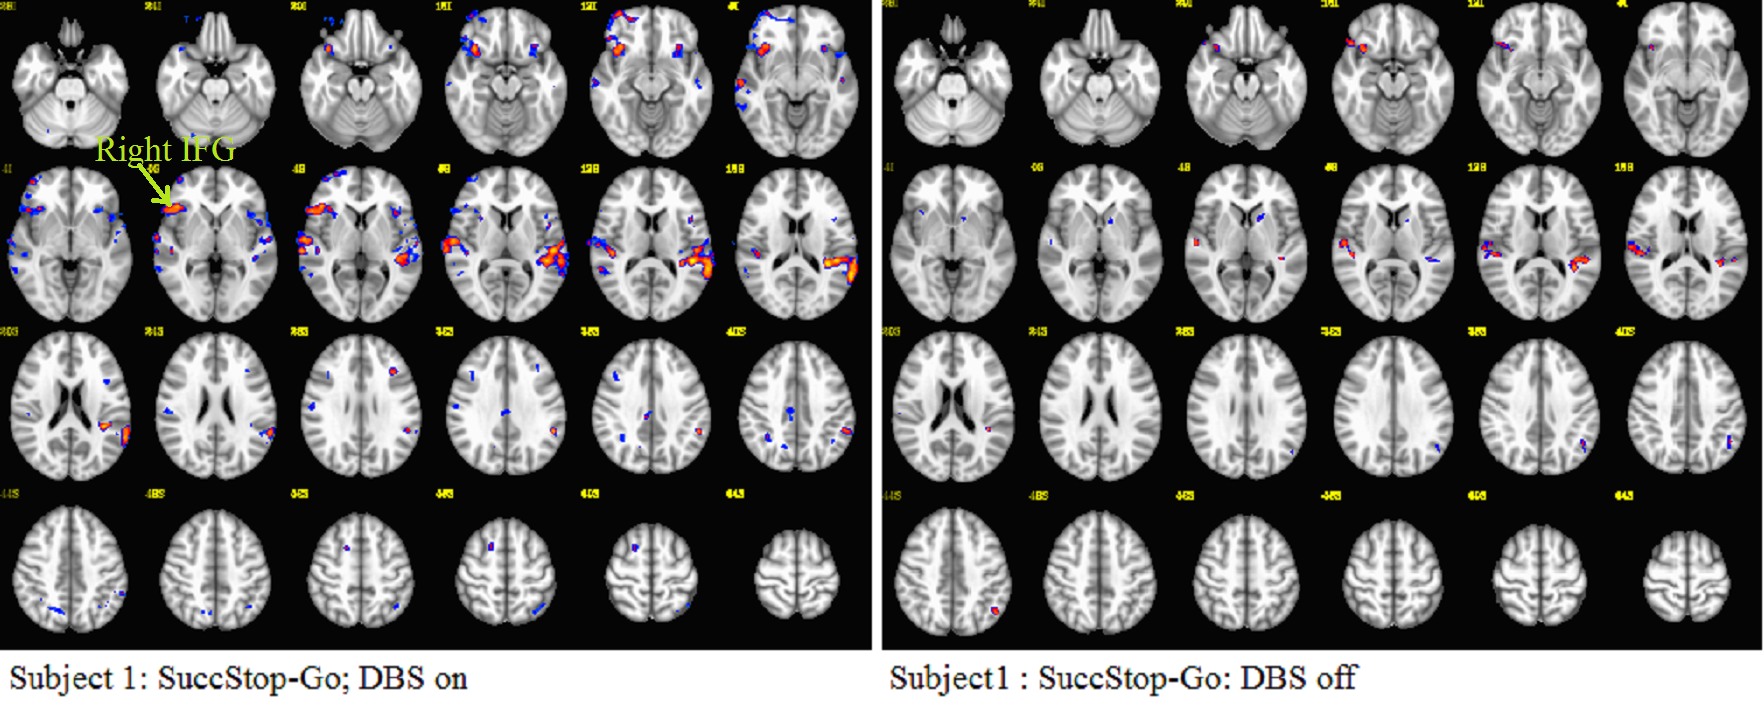
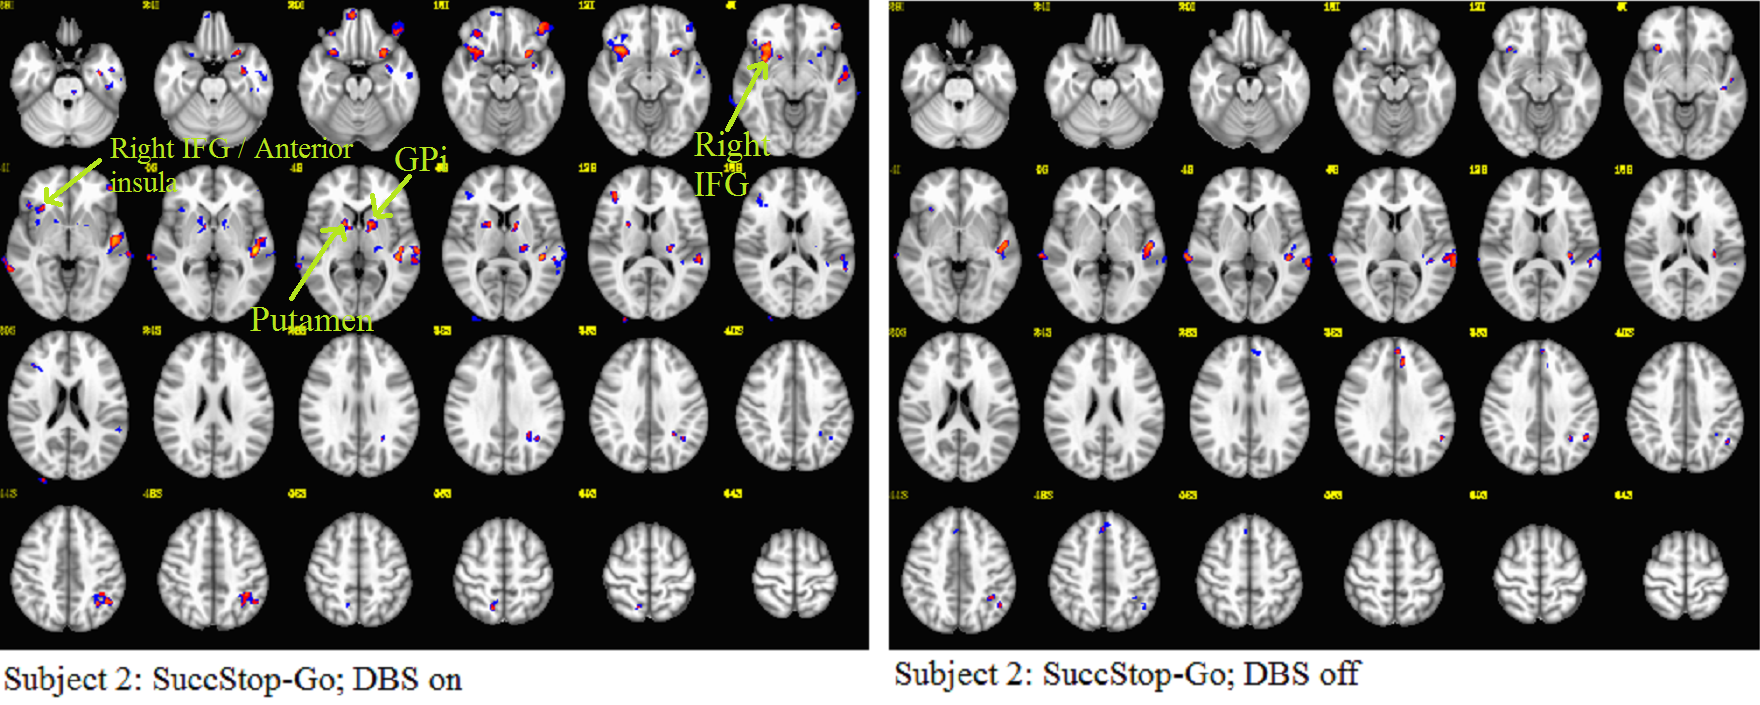
Task performance is shown in Table 1 (one subject data had to be discarded due to poor performance). Activation maps of Go-baseline and SuccStop-go contrasts for the 2 subjects are shown in Figs. 1, 2, 3 and 4. The overwhelming feature in all the maps is higher activation when the DBS is on compared to that in its off state. Contralateral primary motor cortex (M1), supplementary motor area (SMA) and ipsilateral cerebellum activation are seen in the on condition for Go-baseline contrast, while such activations are not significant in the off condition. For SuccStop-Go with DBS on, right inferior gyrus (IFG), putamen and globus pallidus (GPi) activation in the DBS on state are absent in DBS off state.; no subthalamic nucleus or pre-SMA activation reported in healthy controls8 was significant for this contrast. Despite the small subject size the effect of switching the state of DBS (higher activation with DBS on) is very evident from this study. This is indicative of disruption in functional networks controlling stopping action to be disrupted with DBS in its off state.Conclusion
The brain activation in response to the stop-signal task is modulated by the state of DBS and is higher when the DBS is turned on while performing stop-signal task.Acknowledgements
No acknowledgement found.References
1. Gauggel S, Rieger M, Feghoff TA. Inhibition of ongoing responses in patients with Parkinson's disease. J Neurol Neurosurg Psychiatry. 2004;75(4):539-544.
2. Manza P, Amandola M, Tatineni V, Li CR, Leung HC. Response inhibition in Parkinson's disease: a meta-analysis of dopaminergic medication and disease duration effects. NPJ Parkinsons Dis. 2017;3:23.
3. Ye Z, Altena E, Nombela C, Housden CR, Maxwell H, Rittman T, Huddleston C, Rae CL, Regenthal R, Sahakian BJ, Barker RA, Robbins TW, Rowe JB. Improving response inhibition in Parkinson's disease with atomoxetine. Biol Psychiatry. 2015;77(8):740-748.
4. Mirabella G, Iaconelli S, Romanelli P, Modugno N, Lena F, Manfredi M, Cantore G. Deep brain stimulation of subthalamic nuclei affects arm response inhibition in Parkinson's patients. Cereb Cortex. 2012;22(5):1124-1132.
5. Swann N, Poizner H, Houser M, Gould S, Greenhouse I, Cai W, Strunk J, George J, Aron AR. Deep brain stimulation of the subthalamic nucleus alters the cortical profile of response inhibition in the beta frequency band: a scalp EEG study in Parkinson's disease. J Neurosci. 2011;31(15):5721-5729.
6. Aron AR, Herz DM, Brown P, Forstmann BU, Zaghloul K. Frontosubthalamic Circuits for Control of Action and Cognition. J Neurosci. 2016;36(45):11489-11495.
7. Leisman G, Braun-Benjamin O, Melillo R. Cognitive-motor interactions of the basal ganglia in development. Front Syst Neurosci. 2014;8:16.
8. Aron AR, Poldrack RA. Cortical and subcortical contributions to Stop signal response inhibition: role of the subthalamic nucleus. J Neurosci. 2006;26(9):2424-2433.
9. Jenkinson M, Bannister P, Brady M, Smith S. Improved optimization for the robust and accurate linear registration and motion correction of brain images. Neuroimage. 2002;17(2):825-841.
Figures