3266
Frequency specific functional connectivity density in Parkinson’s disease: A resting-state fMRI study1Department of Radiology, Wuhan Children’s Hospital, Tongji Medical College, Huazhong University of Science & Technology, wuhan, China, 2GE Healthcare, MR Research China, Beijing, China
Synopsis
The functional connectivity of the brain in Parkinson’s disease (PD) has been largely investigated focusing on a low frequency oscillation from 0.01 to 0.1 Hz. Nevertheless, the frequency specificities relating to the functional connectivity have not yet been fully understood. In this study, we utilized analysis of the functional connectivity density (FCD) to determine changes in patients with PD and in healthy controls in wo different frequency bands were analyzed. Our results demonstrated differential FCD maps from both spatial and frequency domain, thus providing a novel insight for investigation of the neuroimaging biomarkers in PD.
Introduction
Parkinson’s disease (PD) is a neurodegenerative disorder mainly caused by a progressive loss of dopaminergic neurons in the substantia nigra pars compacta projecting to the striatum. Although the exact mechanism underlying the pathophysiology of PD remains unknown. Increasing evidence has suggested that PD could be associated with abnormal cortical connectivity and morphology involving a number of brain regions 1,2. Recently, a novel voxel-wise method, functional connectivity density (FCD) mapping provide us a means to investigate the whole brain functional connectivity in a data driven approach. Moreover, the mechanism of PD-related alterations in frequency-specific FCD remains unclear. The following study investigates how global FCD maps are reorganized in PD patients in relation to different frequency bands. To achieve these goals, the whole spectral BOLD signals in patients with PD (n = 102) and in healthy controls (HC, n = 108) were first decomposed into two distinct frequency bands (slow-5, 0.01-0.027 Hz; slow-4, 0.027-0.073 Hz), which were mainly related to physiological meanings 3,4. Then, the global FCD maps were calculated in both slow-5 and slow-4 frequency bands. Finally, statistical analysis was performed to investigate the group effects.Method
MR images were acquired on a 3.0-Tesla MR system (Discovery MR750, General Electric, Milwaukee, WI, USA). All subjects were instructed to rest with their eyes closed, not to think about anything in particular, or to fall asleep. The gradient-recalled echo-planar imaging (GRE-EPI) pulse sequence and T1-FLAIR sequence were used for acquiring resting state functional images and the anatomical images, respectively. Images were analyzed using both FMRIB Software Library and Analysis of Functional NeuroImaging. After the preprocessing procedures, we calculated the individual voxel-wise global FCD maps using the Neuroscience Information Toolbox in two different frequency bins (slow-5: 0.01-0.027 Hz; and slow-4: 0.027-0.073 Hz). To determine the group effect, voxel-by-voxel comparisons of the global FCD maps were performed between groups using two sample t-test in SPM12 with the age, gender, and education as covariates. A correction for multiple comparisons was performed using two-tailed Gaussian random field (GRF) theory, with a voxel level of P < 0.01 and a corrected cluster-level threshold of P < 0.05.Results and Discussion
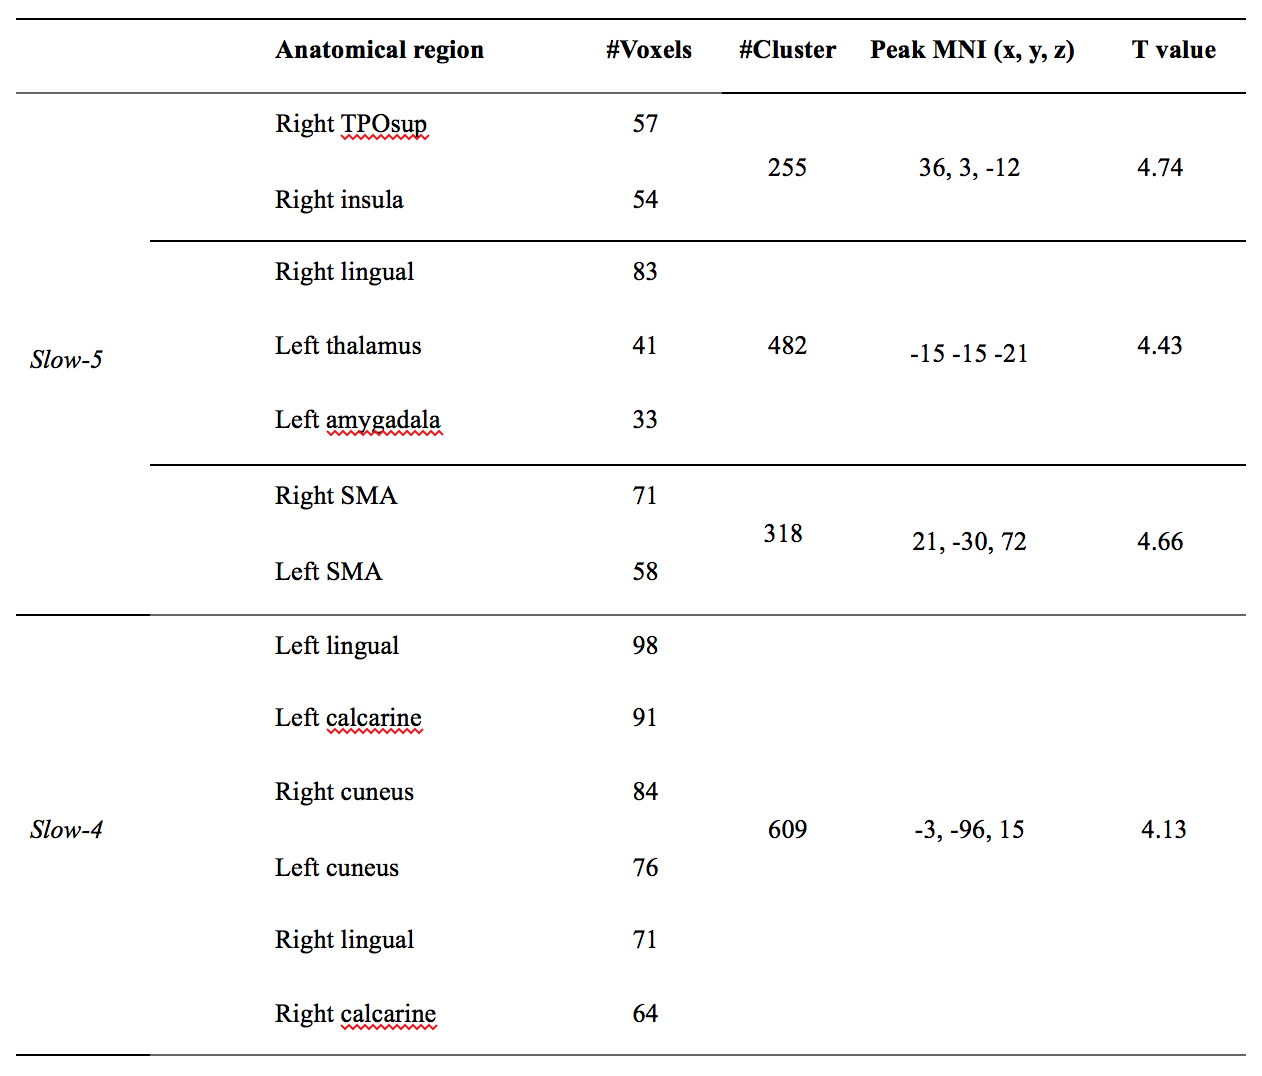
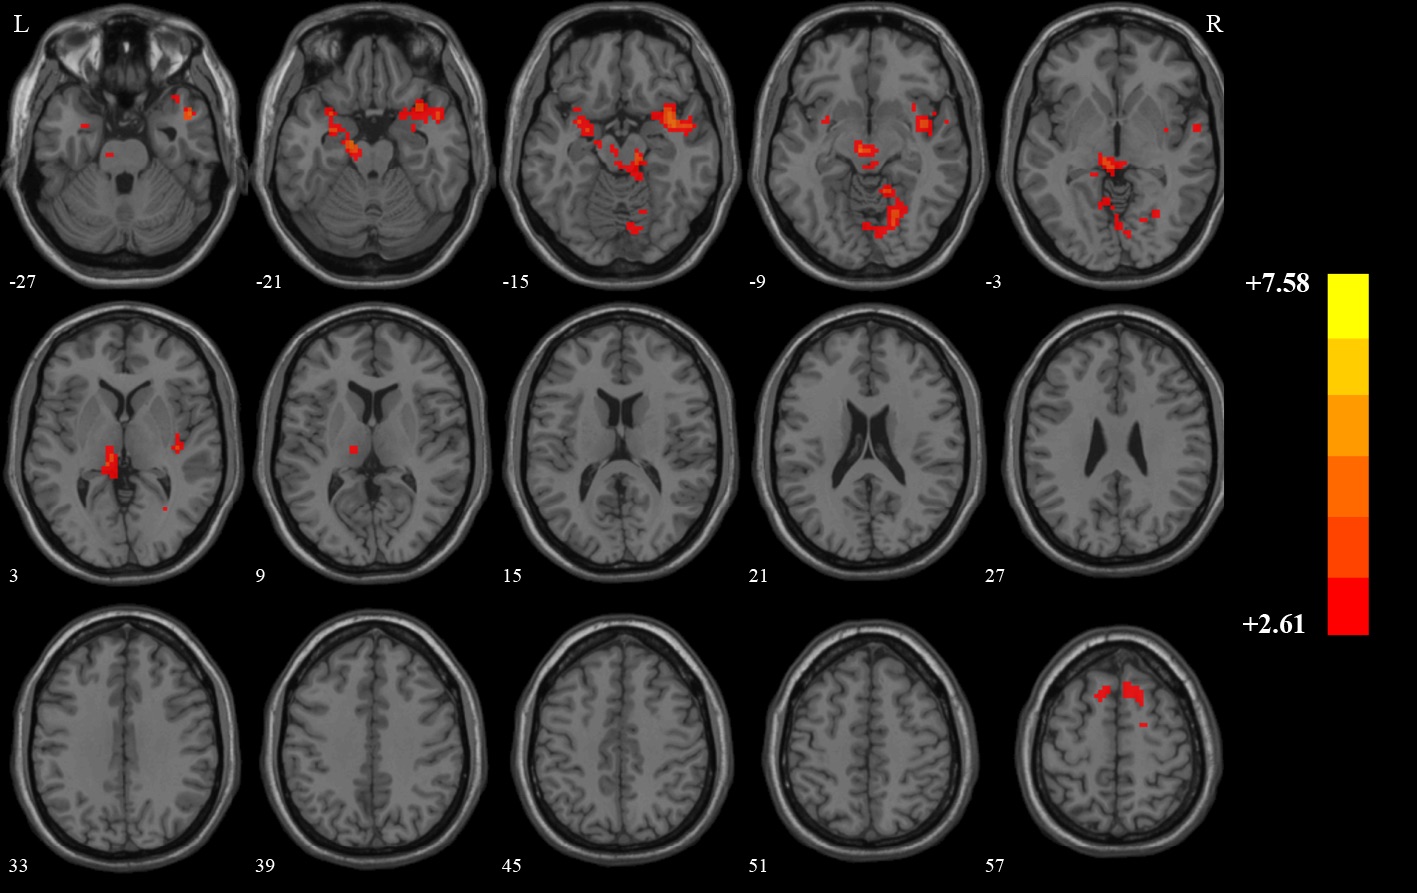
The results of differential global FCD maps at both slow-5 and slow-4 fluctuations indicated various abnormal brain regions in PD patients. Relative to HC, the decreased global FCD maps in PD patients were mainly distributed in occipital lobe and subcortical regions (Table 1, Figure 1 and Figure 2). The observed dysfunction of occipital regions might associate with the visual damages in PD 5,6. The decreased global FCDs in subcortical regions might account for the motor deficits in PD 7. Meanwhile, in slow-5 band, the associated differential brain regions are mainly distributed in paralimbic-limbic regions, while in slow-4 bin the observed abnormal regions are predominant in occipital lobe. The frequency specifies of global FCD maps in PD might suggest the existence of associations between the distinct functional circuits oscillatory activities across multiple frequency bands and distinct motor, non-motor components of clinical impairment in PD 8.Conclusions
In the present study, we found that the PD patients had abnormal global FCD maps in both frequency bands. Our results suggested that the widespread long-range FCDs might have an important role in explaining the pathophysiology of PD patients. Additionally, the frequency specificities of FCDs in PD group provide evidence in support of hypothesis that the brain oscillations within distinct frequency bands in PD patients may account for different neural circuits. Overall, our results demonstrated the differential FCD maps from both spatial and frequency domain, thus providing a novel insight for investigation of the neuroimaging biomarkers in Parkinson’s disease.Acknowledgements
No acknowledgement found.References
1. Braak, H. and E. Braak, Pathoanatomy of Parkinson's disease. J Neurol, 2000. 247 Suppl 2: p. Ii3-10.
2. Xu, Y., et al., Voxel-based meta-analysis of gray matter volume reductions associated with cognitive impairment in Parkinson's disease. J Neurol, 2016. 263(6): p. 1178-87.
3. Zuo, X.-N., et al., The oscillating brain: complex and reliable. Neuroimage, 2010. 49(2): p. 1432-1445.
4. Zhang, J., et al., Specific frequency band of amplitude low-frequency fluctuation predicts Parkinson's disease. Behav Brain Res, 2013. 252: p. 18-23.
5. Laatu, S., et al., Visual object recognition deficits in early Parkinson's disease. Parkinsonism Relat Disord, 2004. 10(4): p. 227-33.
6. Cardoso, E.F., et al., Abnormal visual activation in Parkinson's disease patients. Mov Disord, 2010. 25(11): p. 1590-6.
7. Pan, P., et al., Abnormalities of regional brain function in Parkinson's disease: a meta-analysis of resting state functional magnetic resonance imaging studies. Sci Rep, 2017. 7: p. 40469.
8. Oswal, A., P. Brown, and V. Litvak, Synchronized neural oscillations and the pathophysiology of Parkinson's disease. Curr Opin Neurol, 2013. 26(6): p. 662-70.
Figures