3265
White matter MS lesions effect on resting state fMRI analysis: should we lesion fill functional data?1NMR Research Unit, Queen Square MS Centre, Department of Neuroinflammation, UCL Institute of Neurology, London, United Kingdom, 2Department of Electrical, Computer and Biomedical Engineering, University of Pavia, Pavia, Italy, 3Diagnostic Radiography Technology Department, Faculty of Applied Medical Sciences, King Abdulaziz University (KAU), Jeddah, Saudi Arabia, 4MRI Research Unit, Queen Square MS Centre, Department of Neuroinflammation, UCL Institute of Neurology, London, United Kingdom, 5Centre for Medical Image Computing (CMIC), Department of Medical Physics and Bioengineering, UCL, London, United Kingdom, 6Universitat Oberta de Catalunya, Barcelona, Spain, 7Department of Brain and behavioral sciences, University of Pavia, Pavia, Italy, 8Brain 3T MRI Centre, Neuroradiology, IRCCS Mondino Foundation, Pavia, Italy
Synopsis
Multiple sclerosis (MS) lesions are well known to alter tissue segmentation, shifting tissue boundaries between grey and white matter regions (GM and WM). Despite evidence of these errors occurring when working with anatomical images, little is known about the possible effects of MS lesions on the functional MRI results. Here, we addressed this question by simulating the presence of MS lesions on resting state functional MRI data from healthy controls. Subsequently, we tested whether lesion filling functional MRI data is useful to prevent artefactual results of functional connectivity alterations that are actually due to MS lesions.
Target
Researchers who work with multiple sclerosis functional MRI data processing.Introduction
Despite the large interest in resting state functional MRI (rs-fMRI) as a tool to characterise Multiple Sclerosis (MS) functional alterations1, little is still known about the effect of white matter (WM) MS lesions on rs-fMRI signals or whether they may alter functional connectivity (FC) values, possibly leading to confounding results. Here, by simulating severe WM MS lesions on the rs-fMRI images over a healthy control (HC) dataset, we first tested the impact of the lesions on the results of the rs-fMRI analysis. Then, by applying a modality-agnostic and multi-time-point lesion filling algorithm2, we investigated whether the lesion filling of functional data might be a suitable approach to reduce the chance of artefactual rs-fMRI findings due to the WM lesion presence.Methods
19 healthy controls (HC) and 19 secondary progressive MS (SPMS) subjects underwent MRI examination using a 3T Philips Achieva scanner (Philips Healthcare, Best, The Netherlands) with a 32-channel head-coil.
MRI acquisition: For each subject, rs-fMRI scans were acquired using a fast field echo-echo planar imaging (FFE-EPI, TR/TE = 2600/35ms, flip angle=90°, voxel size=3 mm isotropic, FOV=192x192 mm2, 46 slices, 120 volumes). A 3DT1 volume was also collected (TR/TE=6.9/3.1ms; flip angle 5°;180 sagittal slices; voxel size=1x1x1mm3, FOV=256mm).
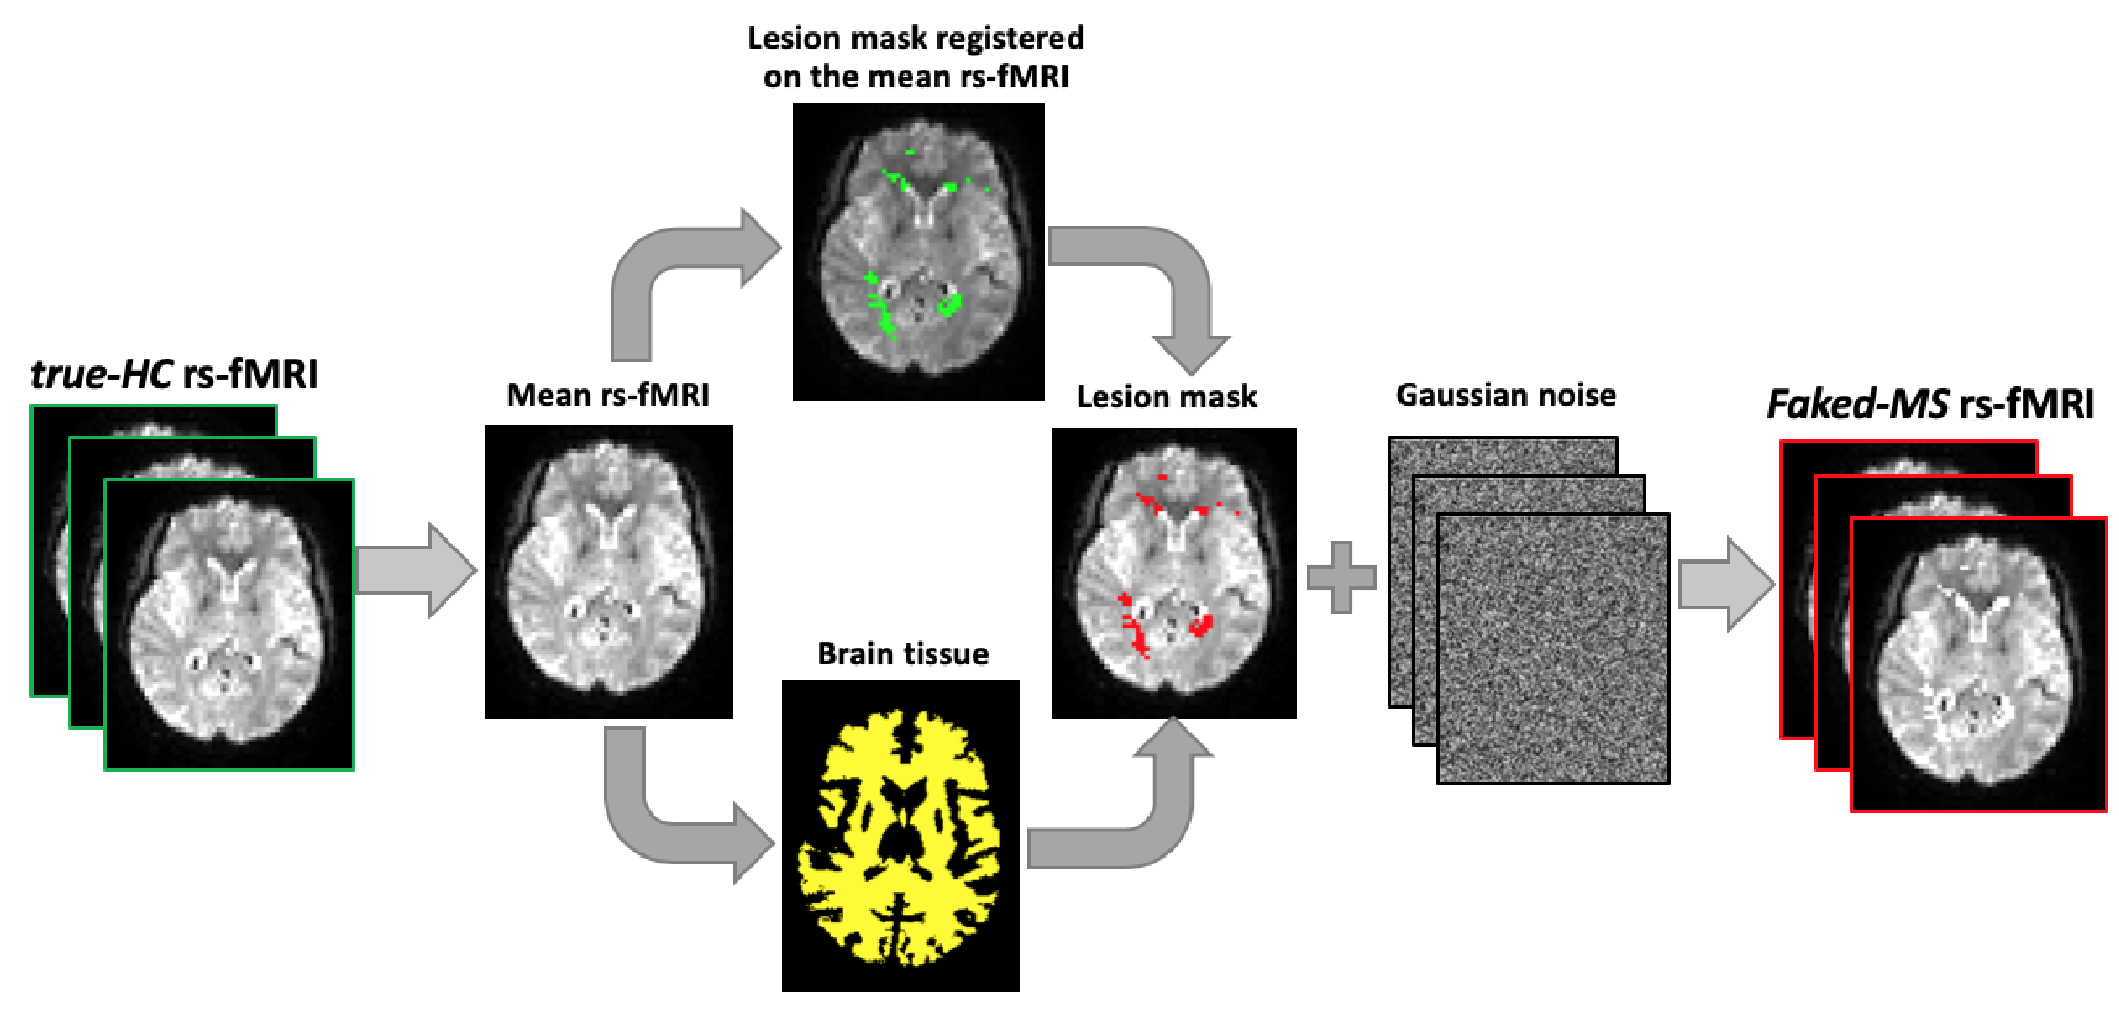
Fake lesions generation: For each HC subject, each volume of the rs-fMRI images was masked with the lesion mask obtained from one (distinct) SPMS subject. A synthetic lesion generation process on rs-fMRI was performed using the NiftySeg and NiftyReg software packages3 as described in Prados (2016)2 in order to obtain 19 faked-MS rs-fMRI series with a realistic distribution of WM lesions (Fig.1). The 3DT1 images of HCs were not modified in order to simulate lesion-filled 3DT1 volumes according to standard recommendations for MRI studies in MS4.
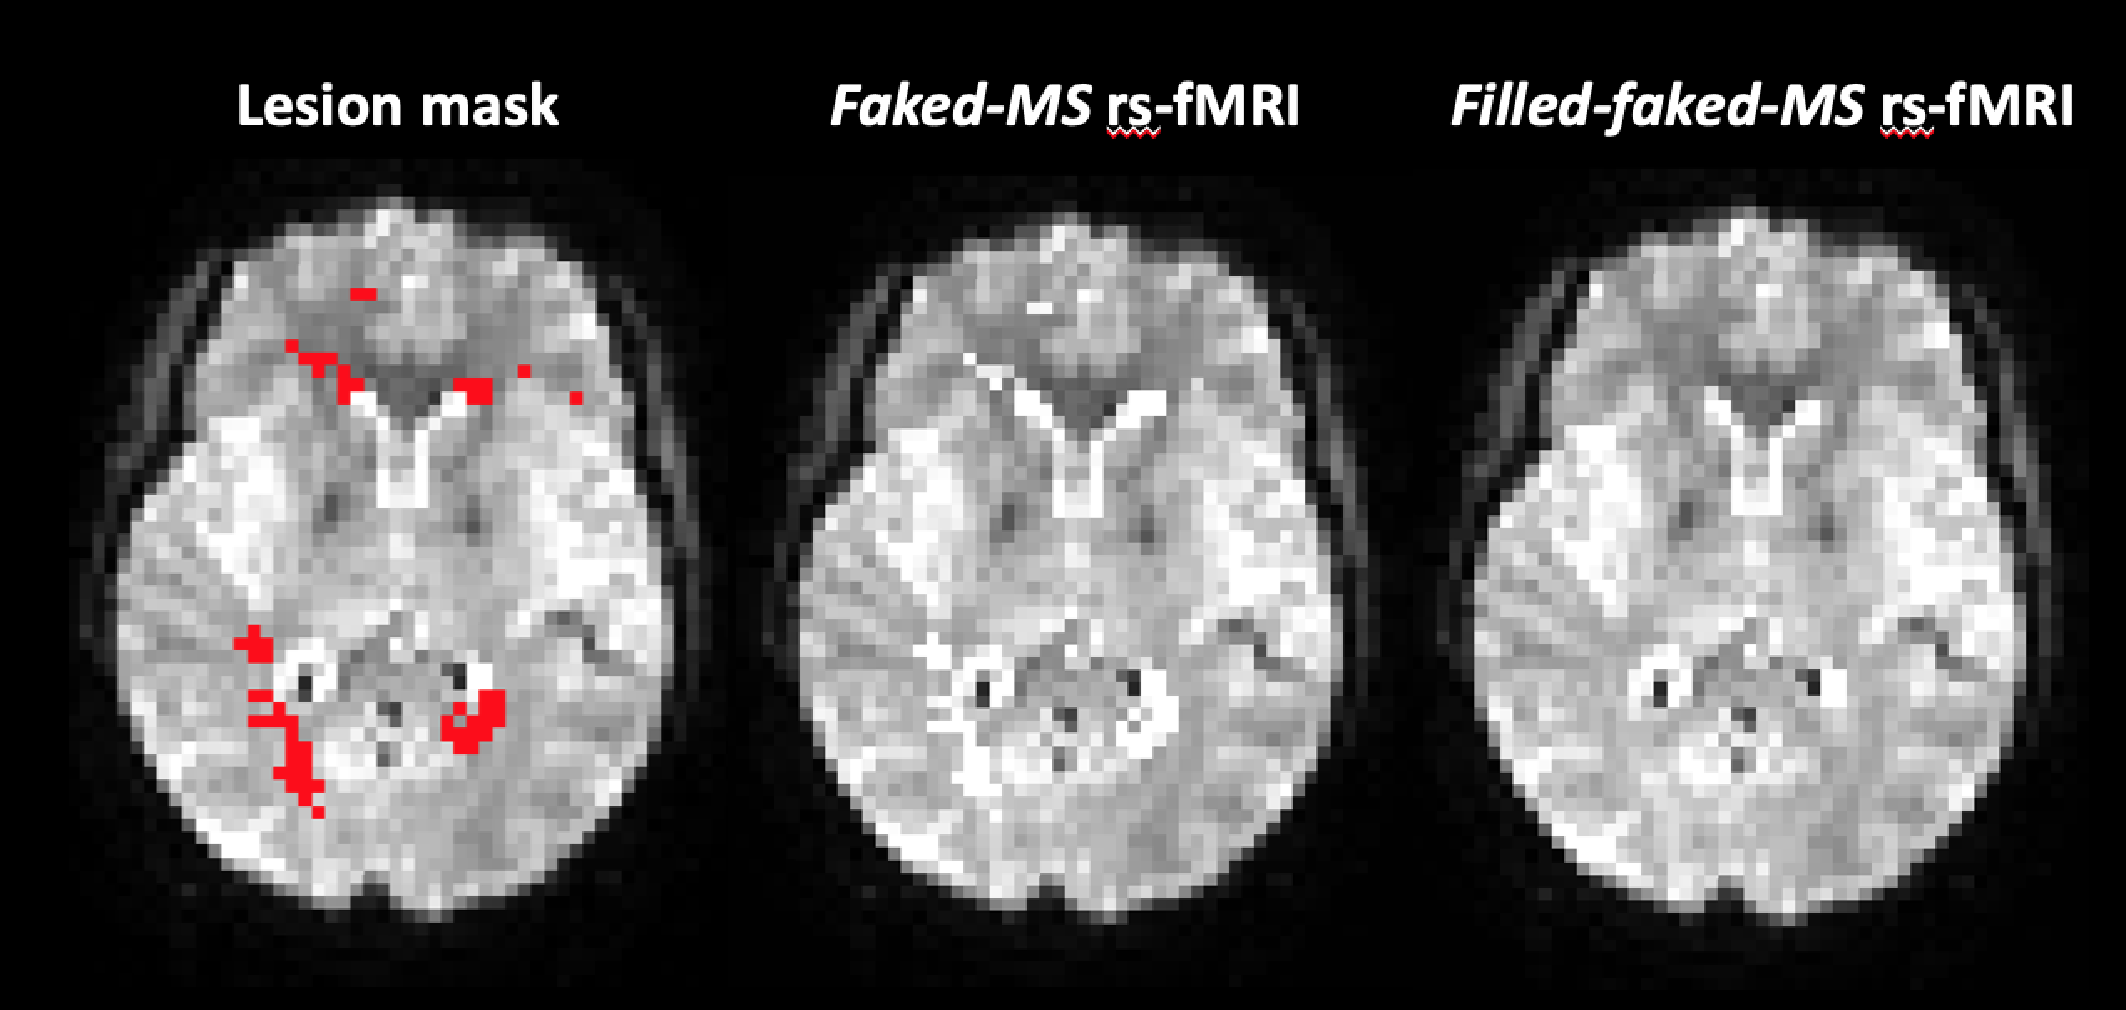
rs-fMRI lesion filling: The multi-time-point filling (mtpF) approach proposed by Prados (2016)2 was applied to fill the simulated lesions on the faked-MS rs-fMRI images, therefore obtaining filled-faked-MS rs-fMRI images (Fig.2).
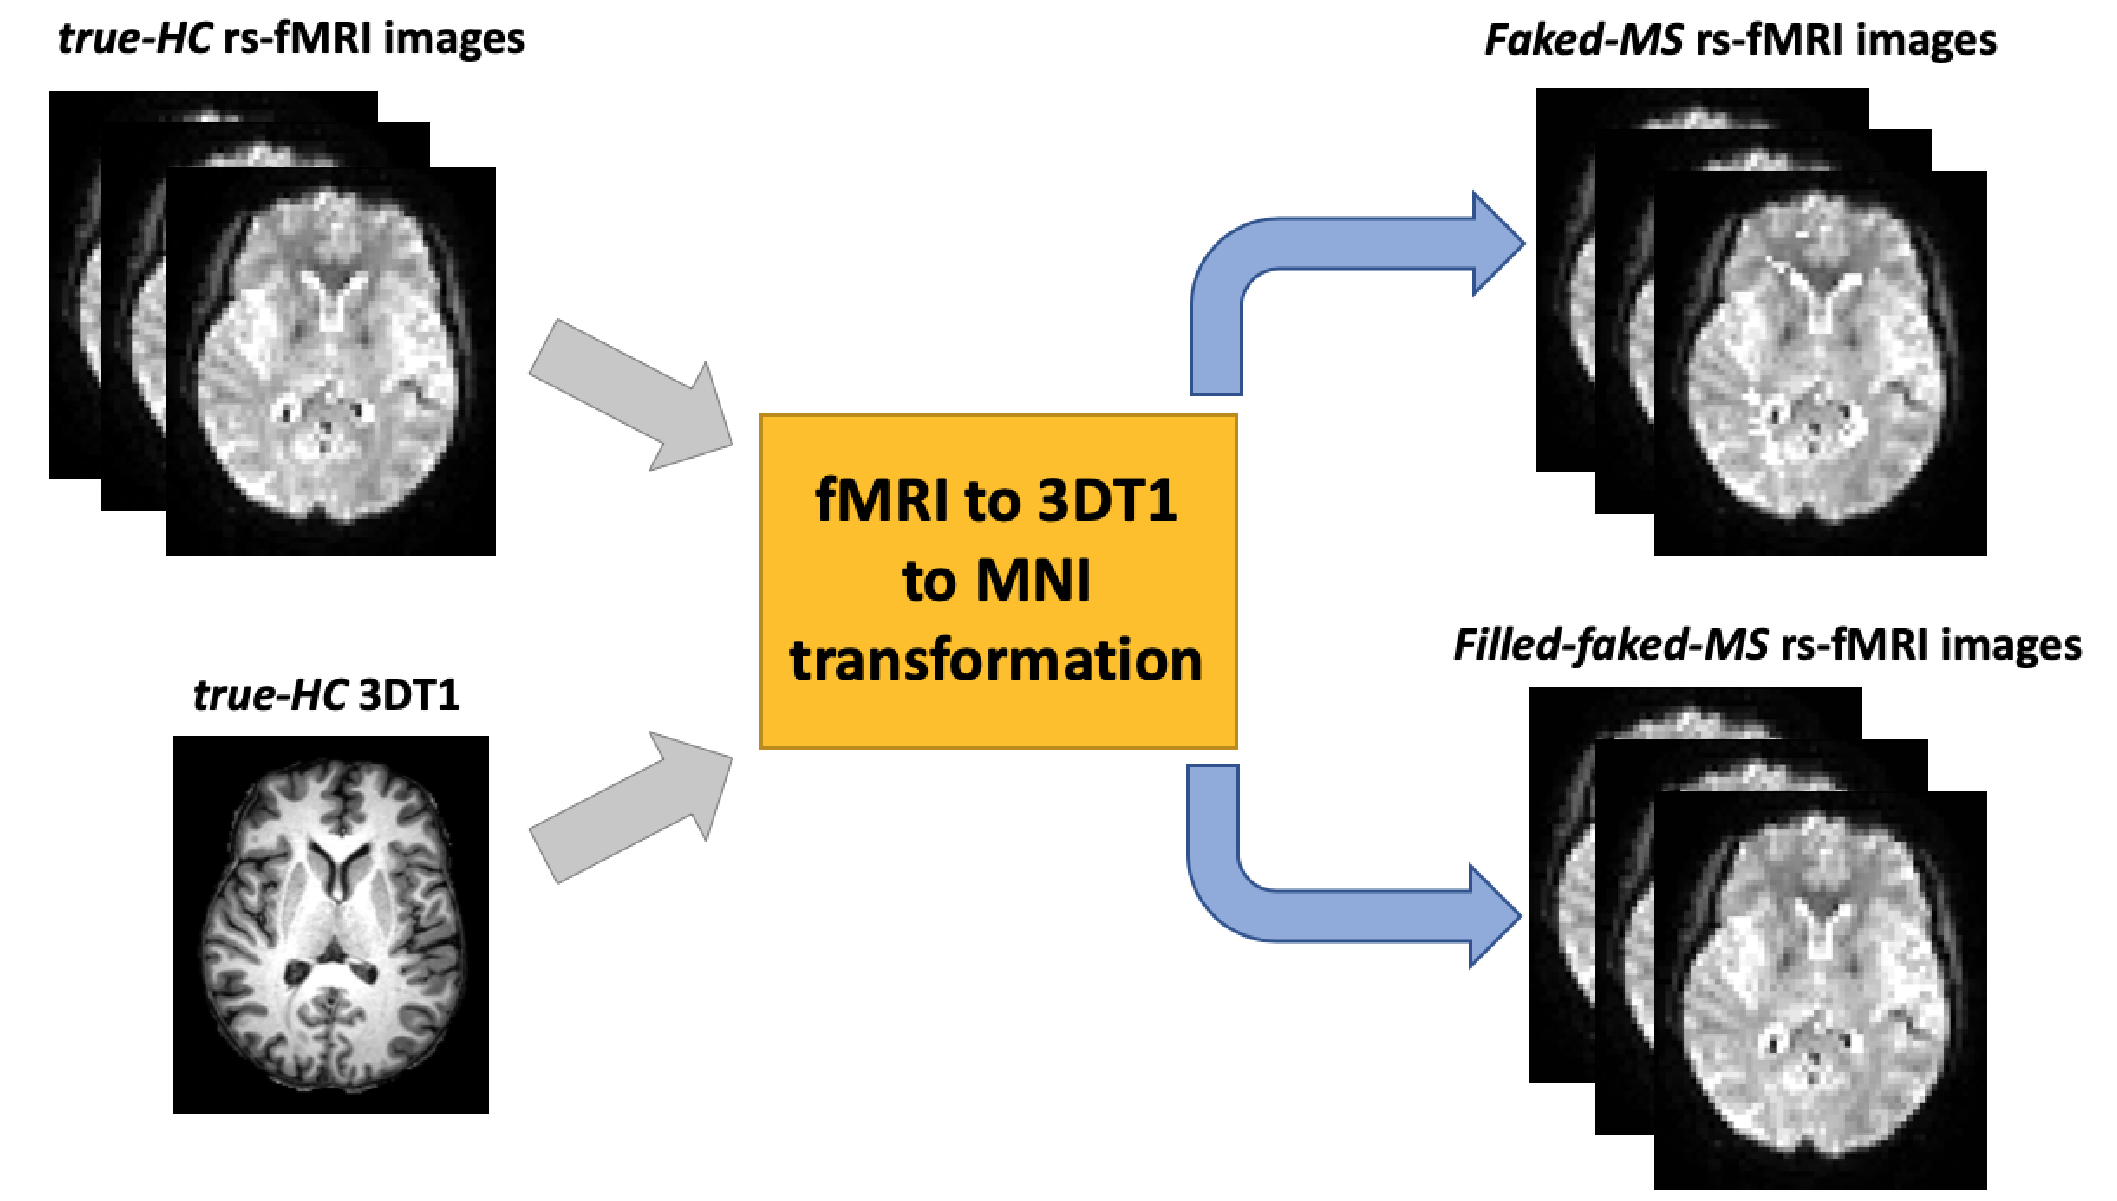
rs-fMRI analysis: We hypothesised that WM lesions neighbouring GM boundaries may affect GM areas through the fMRI processing pipeline, which includes image smoothing and a normalisation step to move fMRI images into standard space. To test this hypothesis, for each subject we calculated the transformation matrix from fMRI to 3DT1 and then to MNI standard space using the real HC data (rs-fMRI and 3DT1). The resulting transformations were then applied to the subject’s faked-MS rs-fMRI and filled-faked-MS rs-fMRI images (Fig.3). This operation ensured that any difference in the subsequent analysis was therefore due to the WM lesions spill over. The pre-processing of the normalised rs-fMRI datasets was then completed using the FSL FEAT pipeline5.
Finally, the Independent Component Analysis (ICA) and dual regression steps were used to compare voxel-wise the FC between the real original (true-HC) and the faked-MS rs-fMRI as well as between the true-HC and the filled-faked-MS rs-fMRI to validate the performance of the lesion filling procedure.
Results
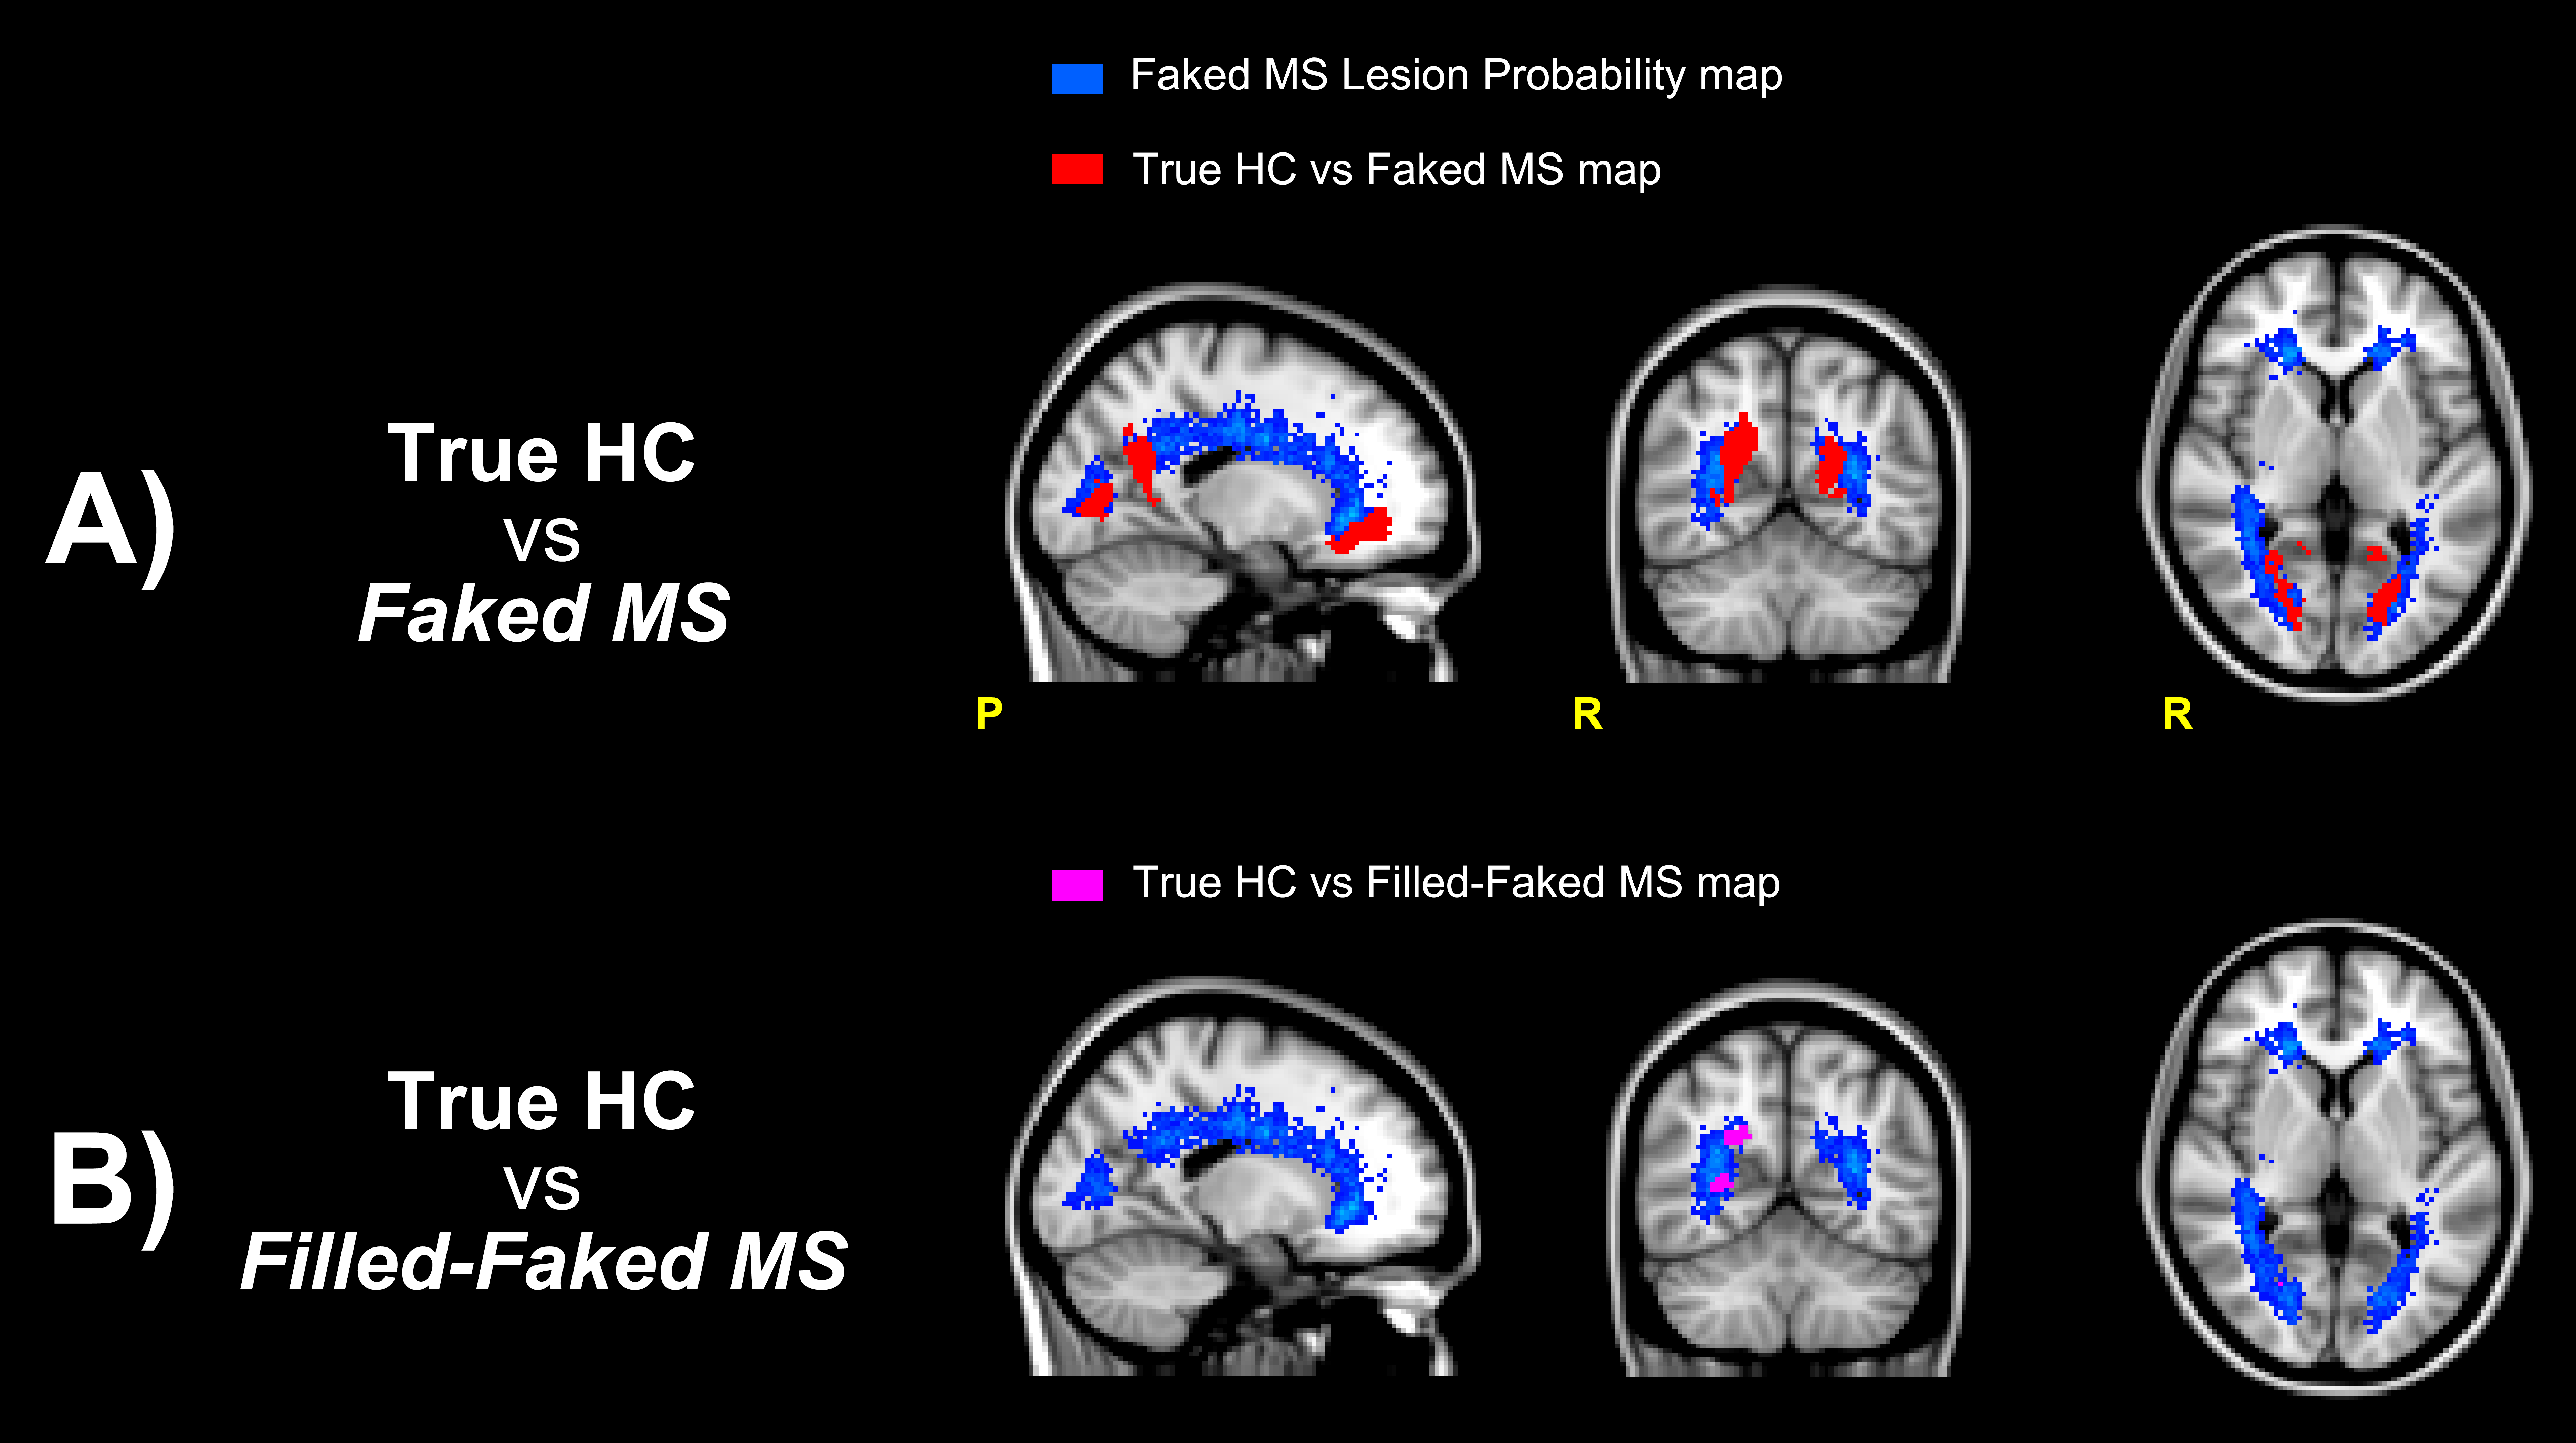
13 Resting State Networks (RSNs) were identified. When comparing the true-HC rs-fMRI to the faked-MS rs-fMRI, differences were found in correspondence of the lesion probability mask of the faked-MS lesions, mainly involving the WM-GM boundaries of the precuneus. When comparing the true-HC rs-fMRI to the faked-filled-MS rs-fMRI these areas of differences resulted significantly reduced (Fig.4).Discussion and Conclusions
Our findings suggest that WM MS lesions have an effect on the rs-fMRI image processing and that this may lead to potential artefactual results. Moreover, results suggest that fMRI data lesion filling may be a suitable approach to reduce the FC changes due to WM MS lesion presence in the subjects’ brain.Acknowledgements
This work is supported by a ECTRIMS Postdoctoral Research grant, the UK MS Society and the MS-SMART project. The MS-SMART trial is a project funded by Efficacy and Mechanism Evaluation (EME) Programme, an MRC and NIHR partnership. It is also supported by the UK Multiple Sclerosis Society; the National Institute for Health Research University College London Hospitals Biomedical Research Centre and University College London; NIHR Leeds CRF (DenTCRU).References
1 – Castellazzi G (2018) Front Neurol 9:690
2 – Prados F (2016) NeuroImage 139:376–384
3 – NIFTYK, cmictig.cs.ucl.ac.uk/research/software/software-nifty
4 – González-Villà S (2017) Neuroimage Clin15:228-238
5 – FSL FEAT, fsl.fmrib.ox.ac.uk/fsl/fslwiki/FEAT
Figures