3256
A Single Reference Variable Flip Angle(SR-VFL) Method using a 3D Pseudo Golden Angle Stack of Stars(PGA- SOS) Sequence for Accurate Dynamic T1 Quantification of Contrast Uptake within Vulnerable Plaque1UCAIR, Department of Radiology and Imaging Sciences, University of Utah, Salt Lake City, UT, United States, 2Department of Neurology, University of Utah, Salt Lake City, UT, United States, 3Department of Surgery, University of Utah, Salt Lake City, UT, United States, 4Department of Veterans Affairs, VASLCHCS, Salt Lake City, UT, United States
Synopsis
The carotid artery atherosclerotic disease is one of the most common causes of ischemic stroke. Post-contrast plaque enhancement (PPE), which may result from endothelial dysfunction or be secondary to intraplaque inflammation, is a vulnerable plaque feature that correlates with increased stroke risk independent of stenosis. Although PPE can be detected with vessel wall MRI, better quantitative methods to measure PPE are needed. This work presents a new 3D high resolution dynamic T1 mapping technique for accurate T1 quantification of contrast uptake within vulnerable carotid atherosclerotic plaque. The proposed method may provide important mechanistic implications for the pathophysiology of PPE.
Purpose
Atherosclerosis is one of the most common causes of ischemic stroke1,2. In histologic studies, plaque enhancement correlates with vasa vasorum neovascularization and macrophages, and contrast leakage may result from endothelial dysfunction or be secondary to intraplaque inflammation and adventitial neovessel rupture3. Currently, T1 weighted signal increase has been used to estimate uptake of paramagnetic contrasts such as Gadolinium (Gd)4 and T1 is directly related to the uptake of contrast agent on the tissue over time5. Variable flip angle (VFA) techniques have been previously investigated to calculate T1 where two FA alternate6. This can lead to possible errors if the transition from each FA steady state is not handled correctly, and must be performed with 3D acquisitions due to small plaque size. This work implements a single reference (SR) VFA method using a 3D pseudo golden angle stack of stars (PGA-SOS) sequence7 that provides a new 3D dynamic T1 measurement for accurate contrast uptake within vulnerable carotid plaques.Methods
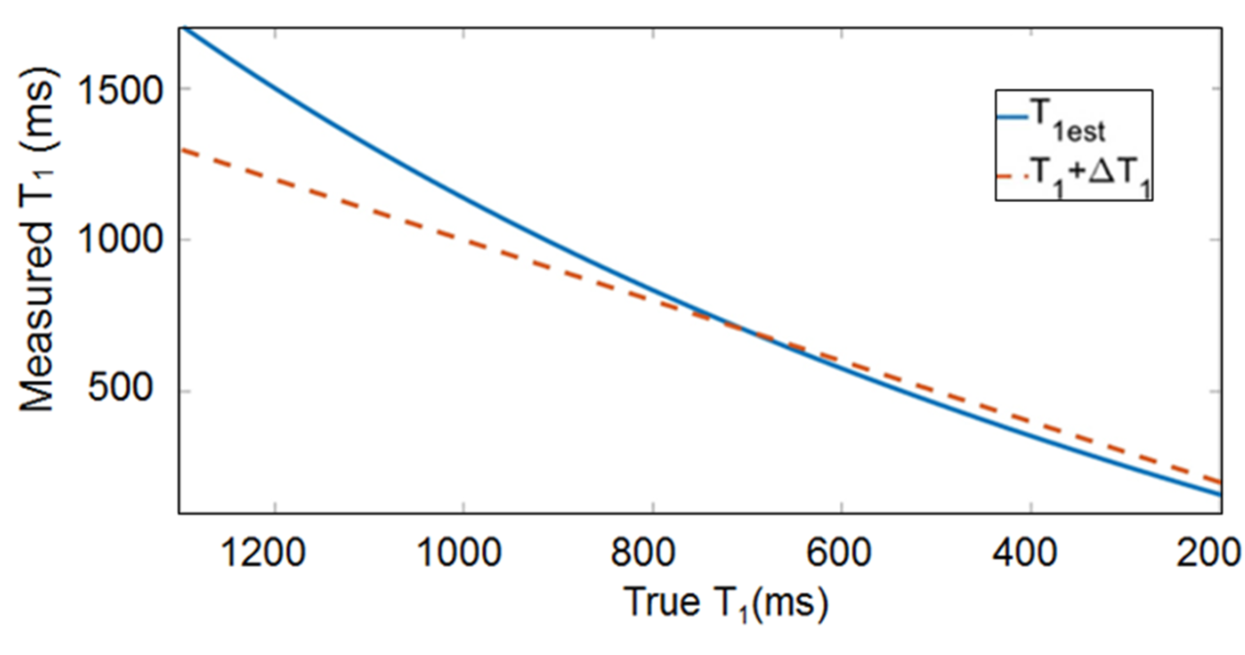
This method acquires a reference image S1 at lower FA (α) and dynamic images S2 at higher FA (β). A T1 estimate (T1est) is calculated using T1est = -TR / ln(m), m = (S2/sinβ – S1/sinα) / (S2/tanβ – S1/tanα). T1 of the dynamic images changes over time, T1+ΔT1, while the reference image is constant, thereby causing a systematic error resulting in a nonlinear overestimation of T1est as ΔT1 increases. The value of T1 + ΔT1 from the dynamic images can be corrected using T1 + ΔT1 = -TR/ln[(1-γ)/(1-γcosβ)], where γ = (1-E1)(1-E1estcosα) / [(1-E1cosα)(1-E1estcosβ)], E1 = exp(-TR/T1) and E1est = exp(-TR/T1est). The original T1 value is calculated from baseline dual FA images before contrast injection. To determine the optimal choice of FA for the single reference VFA, measurements were simulated using a Monte Carlo technique for a range of FA. The SR non-contrast dynamic T1 acquisition was performed on a uniform phantom with known T1 value. With IRB consent, we acquired dynamic T1 acquisitions from four patients with carotid disease. A reference image was acquired before contrast injection. Dynamic T1 acquisition was started at 32 seconds before the contrast administration. Other imaging parameters of 3D a PGA-SOS were: 0.7 mm isotropic dimension, 24 slices, TE/TR = 2.46/5.62 ms, 1518 projections. Images were reconstructed using a symmetric sliding k-space weighted image contrast (KWIC) window with 377 total and 13 innermost projections7 giving an effective temporal resolution of 2.29 s. The SR-VFA T1 measurements were calculated as well as the percent change in T1 from baseline. All scans were performed on a 3T MRI system with composite head and neck coils8. Reconstructions including dynamic T1 maps were calculated and displayed using software written in Matlab.Results
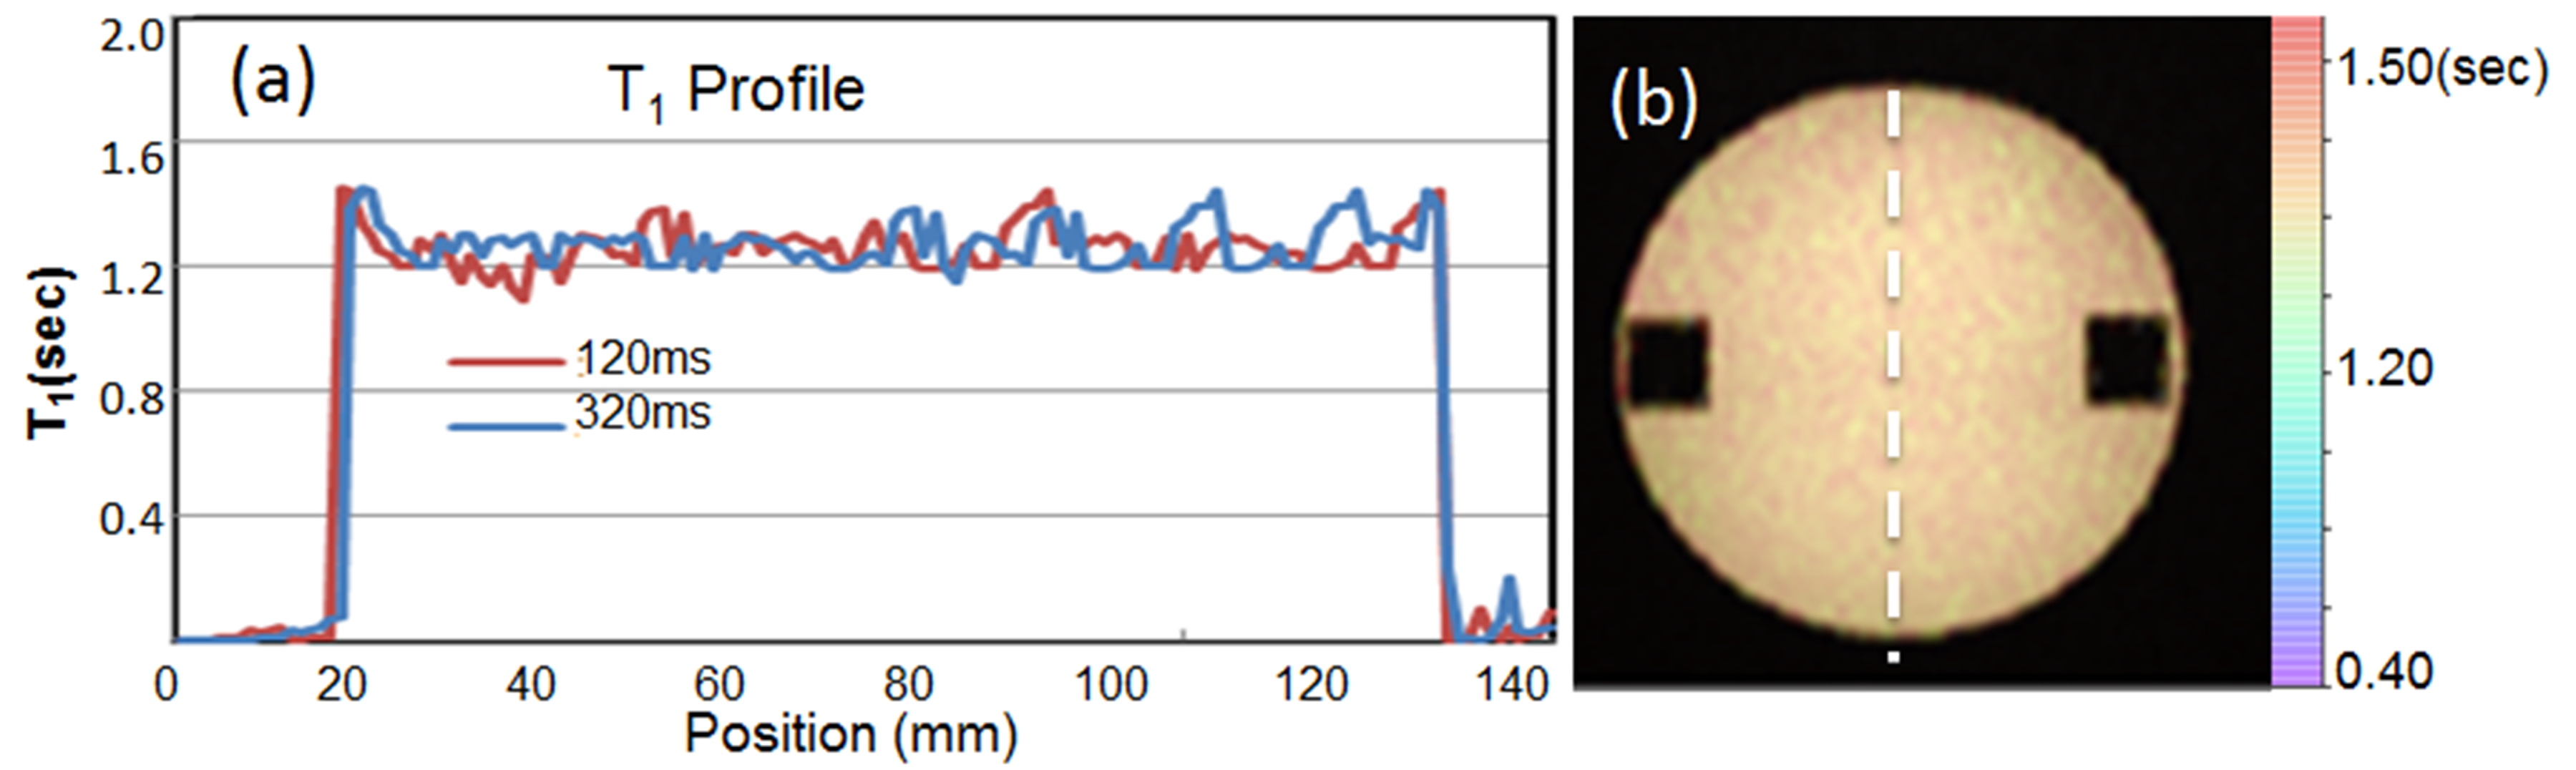
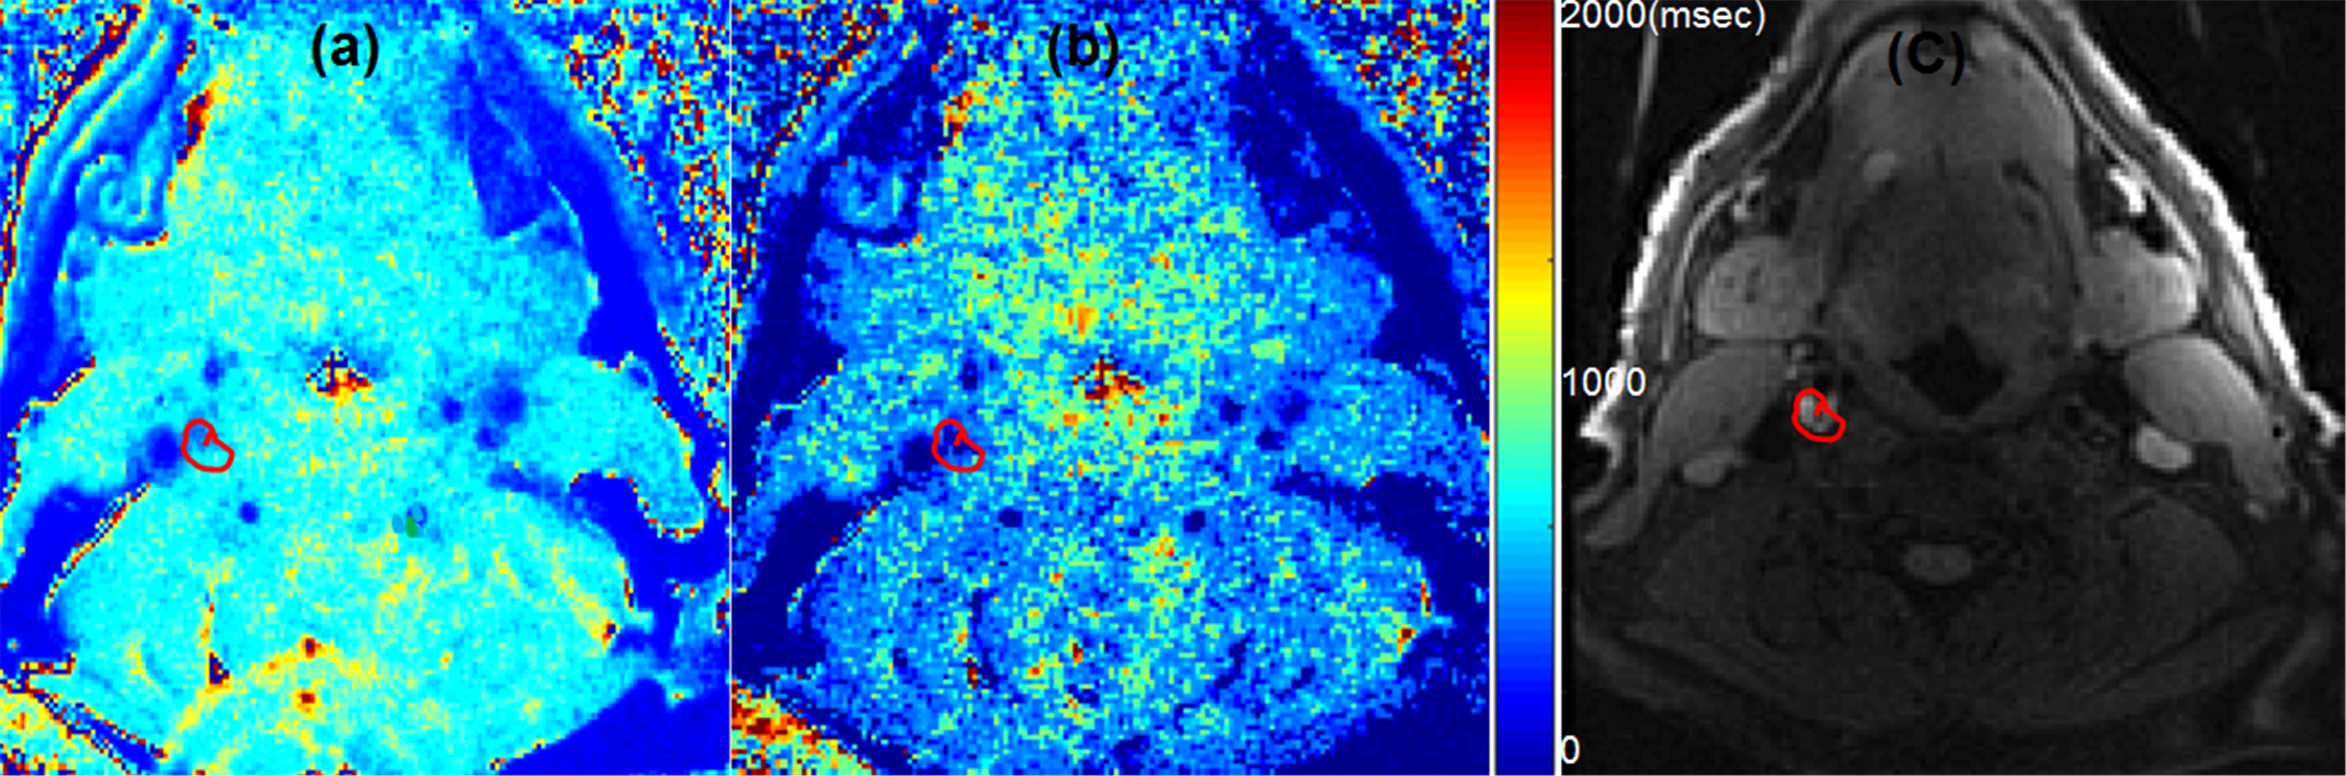
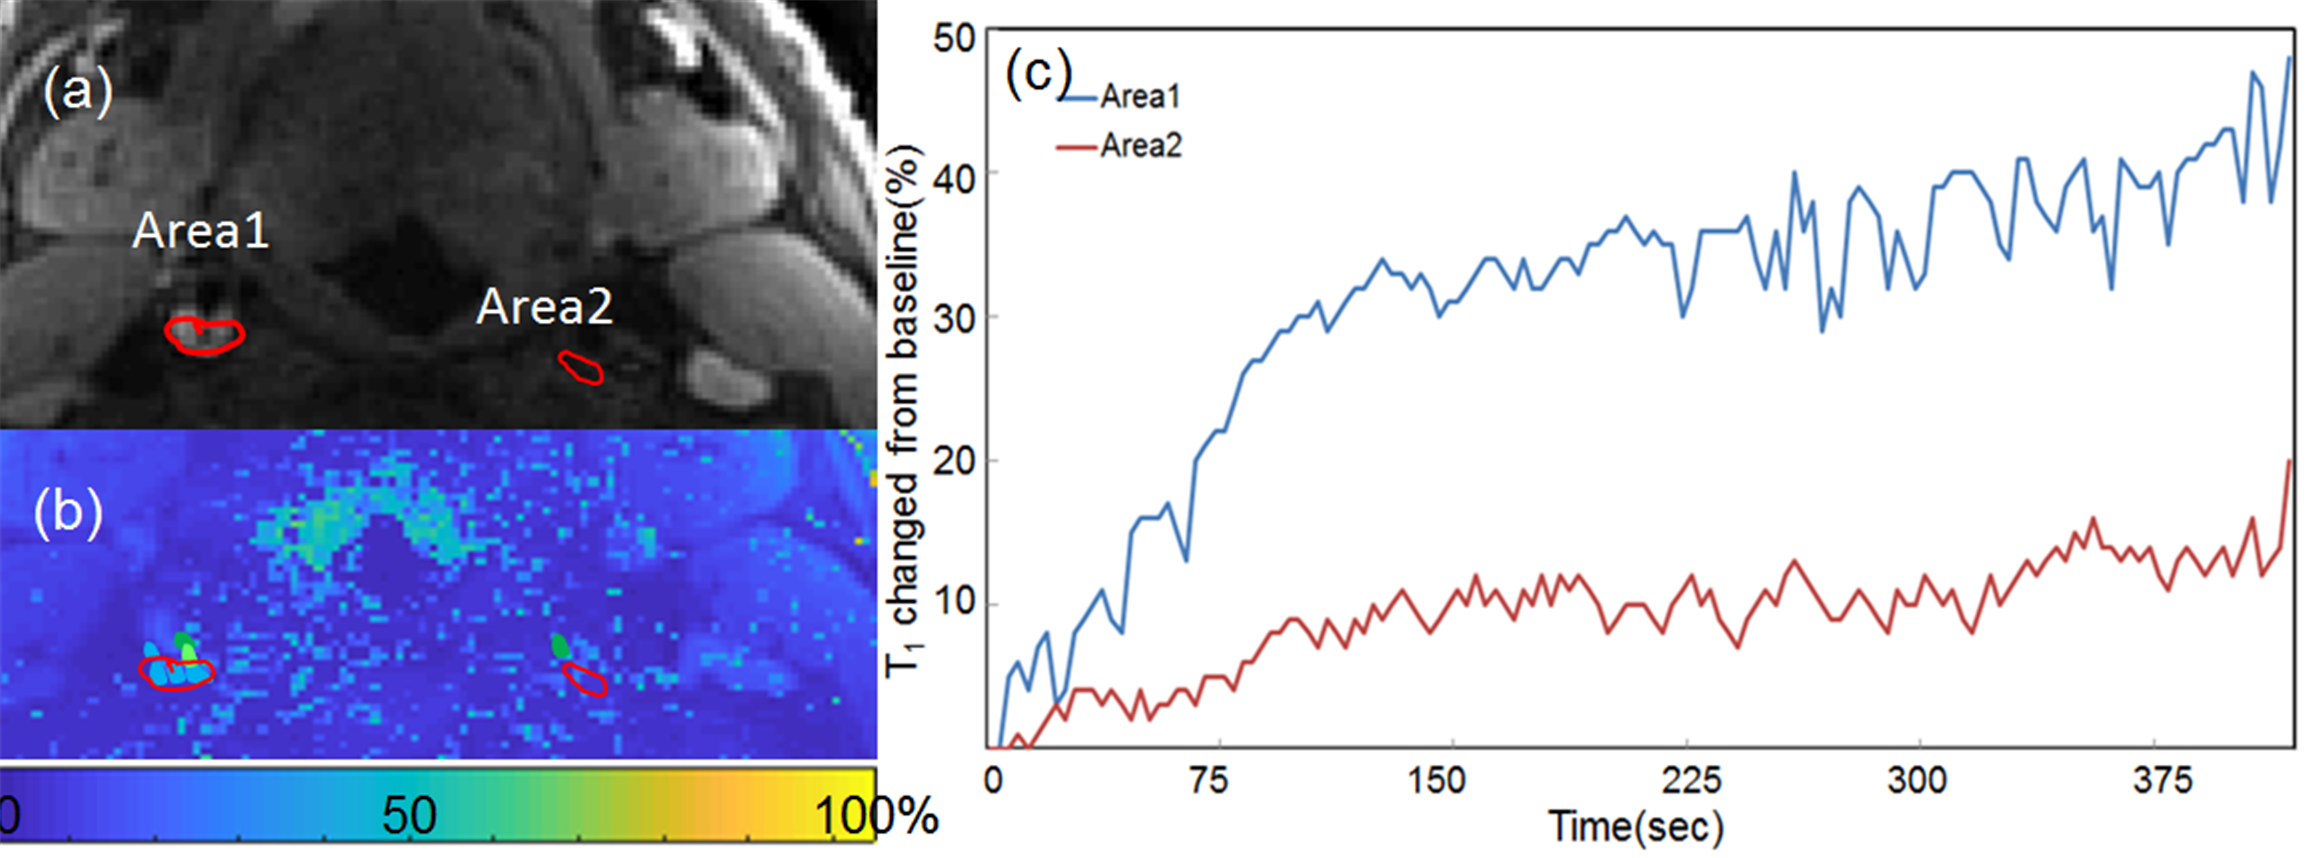
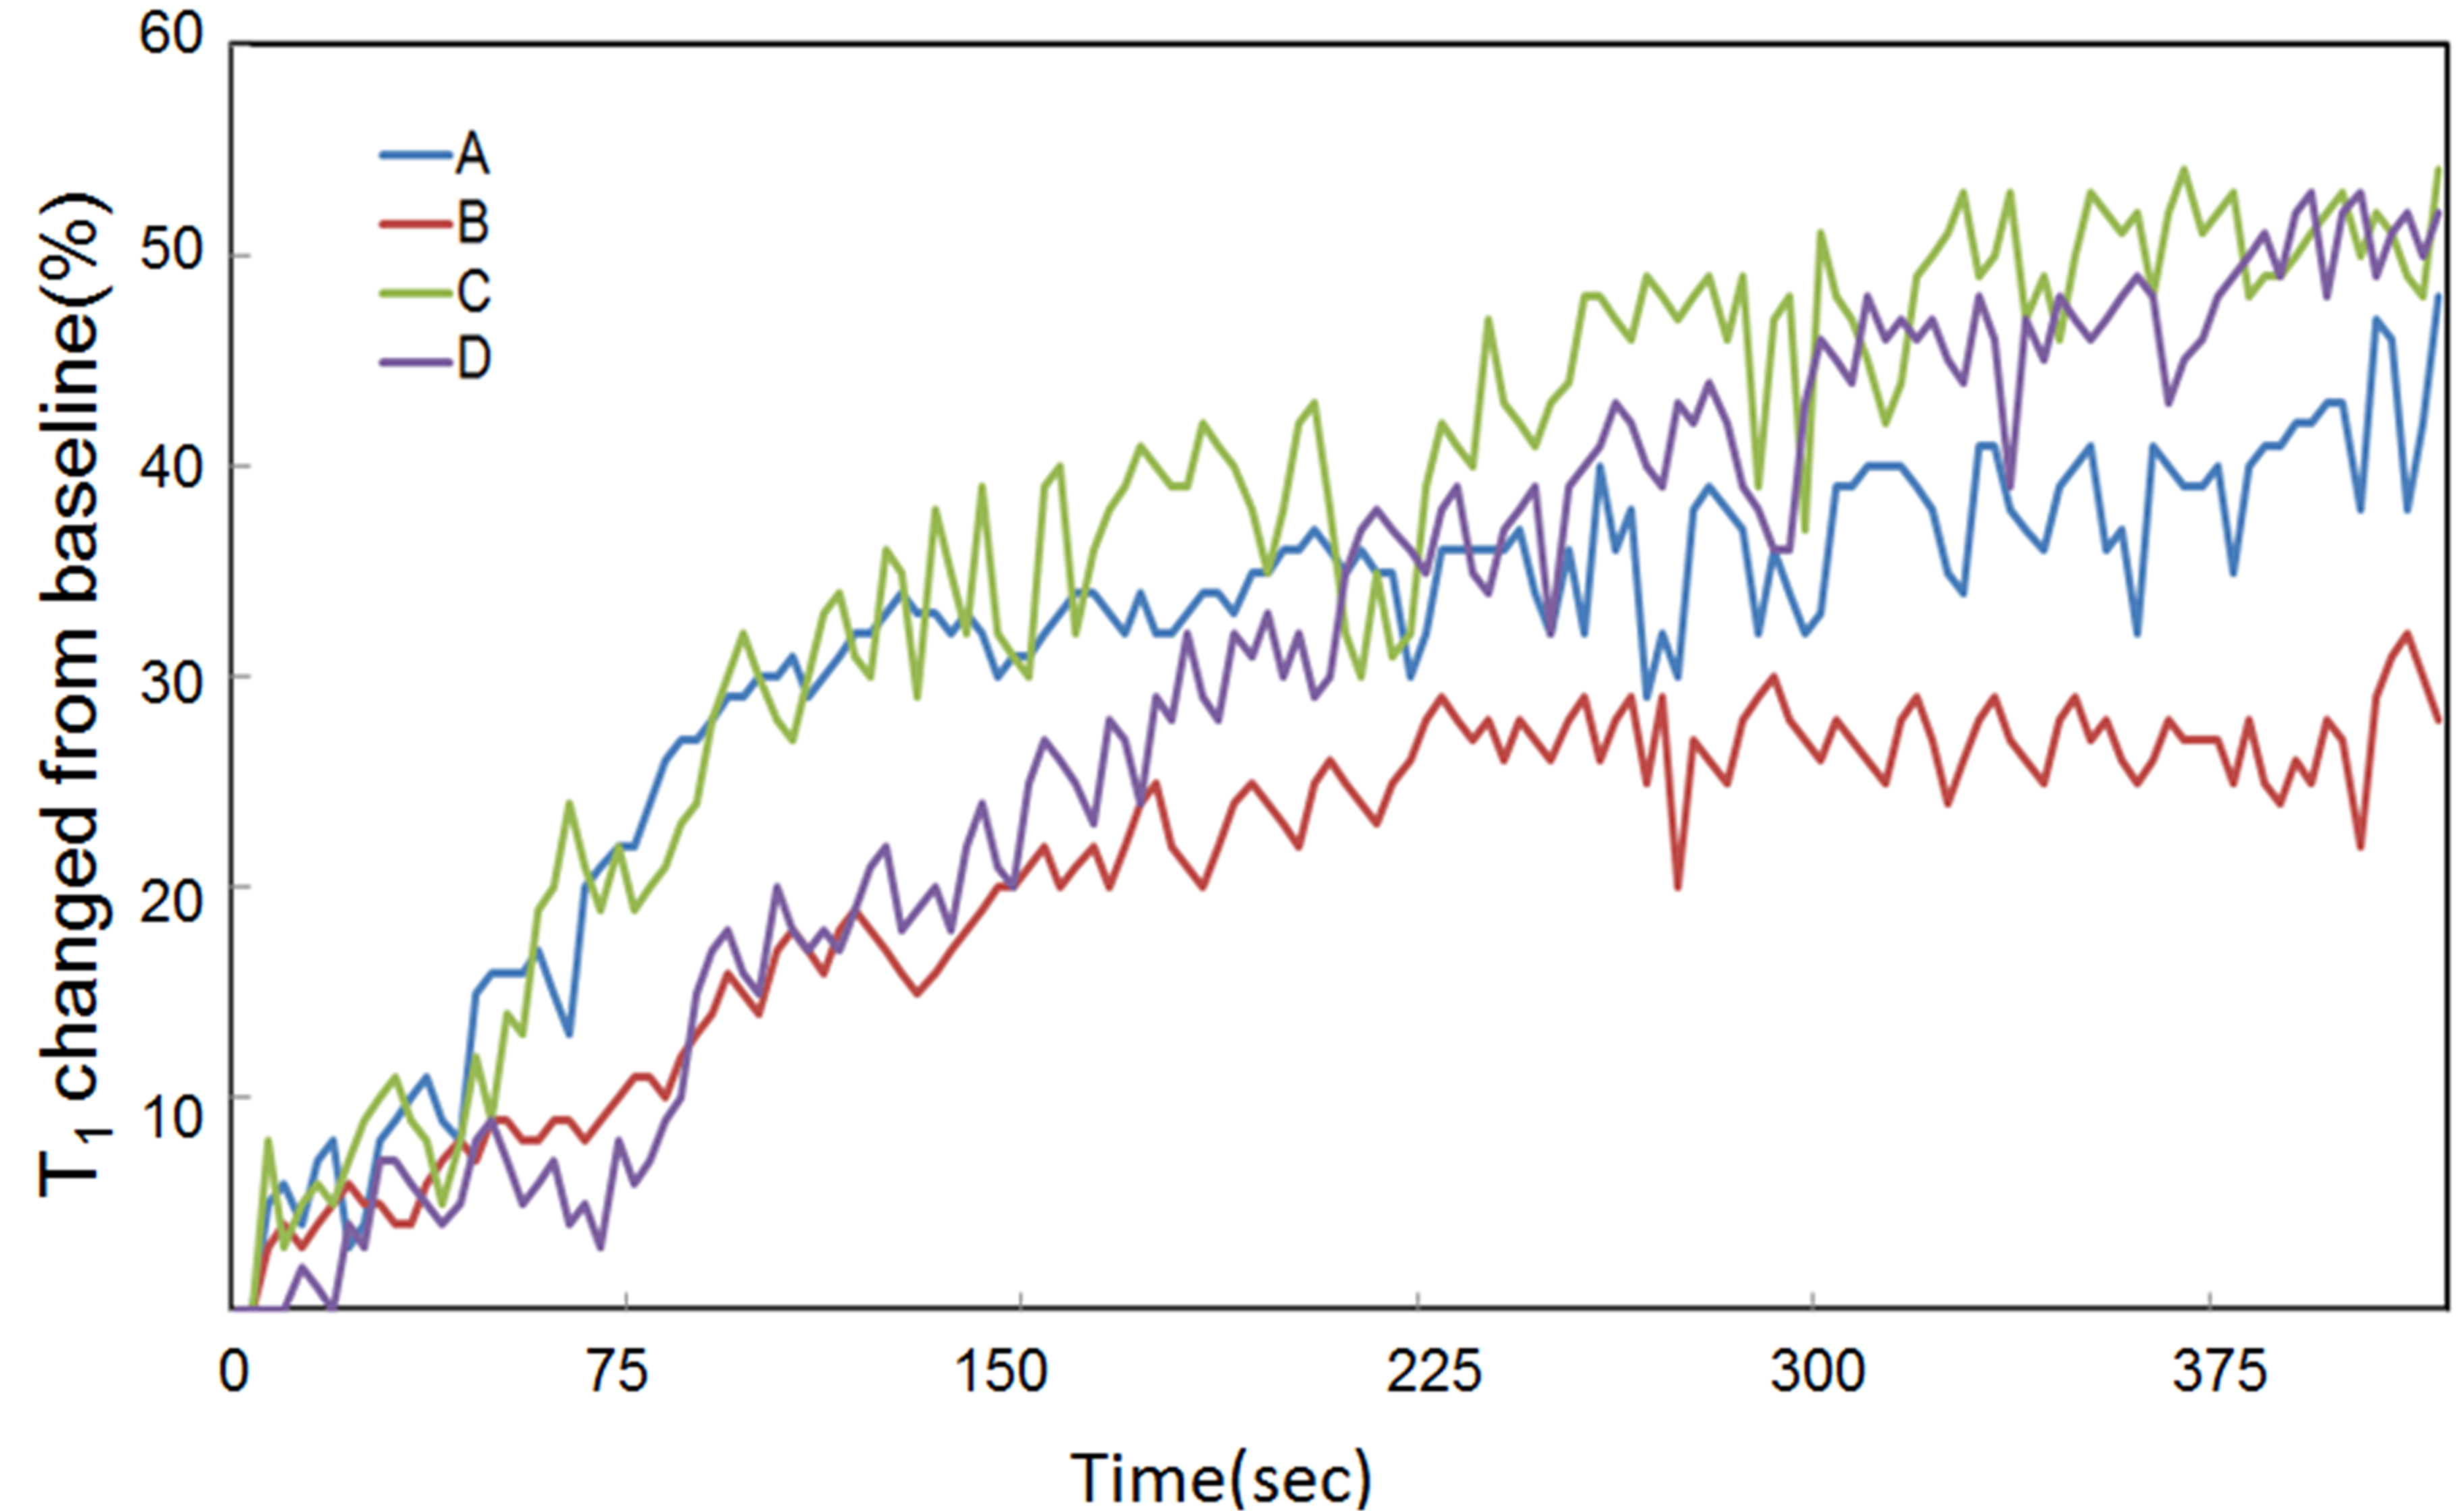
Monte Carlo simulations of SR-VFA precision are shown in Fig 1 for several values of ΔT1. The optimal choice of reference FA was 5°. The phantom study results are shown in the Fig 2. The dynamic T1 profiles(a) and T1 map(b) demonstrate the relatively uniform T1 distribution across the phantom. Fig 3 shows dynamic T1 maps of a patient with carotid atherosclerotic plaque at t = 10ms(a) and t = 350ms(b). The T1 value of the plaque was deceased from 570±84 ms (red contour in (a)) to 275±48ms (b). The dynamic percent T1 changes in the plaque(area1, Fig 4a) and normal wall(area2) indicate the more active contrast uptake within the plaque comparing to the wall. The dynamic percent T1 changes on four different carotid atherosclerotic plaques acquired from patient studies were plotted on the Fig 5.Discussion
The SR-VFA T1 method provides the possibility for dynamic T1 measurement with high temporal and spatial resolution when combined with a PGA-SOS sequence reconstructed with a sliding KWIC window. The dynamic percent T1 changes can provide the direct contrast uptake quantification, which may be more predictive of plaque vulnerability and a better metric to monitor treatment effects compared to visual inspection. The precision of the T1 measurement can be optimized with proper choice of FA. Using a VFA method will amplify noise through its nonlinear nature of calculating T1. For standard VFA, the ideal choice of FA will produce ~71% of Ernst angle signal with the two FA on different sides of the Ernst angle. A more accurate estimate of the percent of the Ernst angle signal could be simulated with much finer FA increments, or possibly an exact estimate could be derived9.Concusion
Dynamic T1 measurement proposed in this work may provide important information for investigators interested in quantifying plaque vulnerability and monitoring treatment effects.Acknowledgements
Supported by R01 HL127582, RSNA Research Scholar Grant RSCH1414, AHA Scientist Development Grant 17SDG33460420, Siemens Medical Solutions, the Clinical Merit Review Grant from the Veterans Administration health Care SystemReferences
1. Suri MFK, Johnston SC. Epidemiology of intracranial stenosis. J Neuroimaging Off J Am Soc Neuroimaging 2009;19 Suppl 1:11S–6S.
2. Bang OY. Intracranial Atherosclerosis: Current Understanding and Perspectives. J Stroke 2014;16:27–35.
3. de Havenon A, Chung L, Park M, et al. Intracranial vessel wall MRI: a review of current indications and future applications. Neurovascular Imaging 2016;2(10).
4. Swartz RH, Bhuta SS, Farb RI, et al Intracranial arterial wall imaging using high-resolution 3-tesla. Neurology 2009 72:627.
5. Nicolle GM, Toth E. Schimitt-Willich H, et al. The impact of rigidity and water exchange on the relaxivity of dendritic MRI contrast agent. Chem Eur J 2002:8-9.
6. Cheng HL and Wright GA. Rapid High-Resolution T1 Mapping by Variable Flip Angles: Accurate and Precise Measurements in the Presence of Radiofrequency Field Inhomogeneity. Magn Reson in Med 2006 55:566 –574
7. Svedin BT, Payne A, Bloster BD Jr, Parker DL, Multiecho pseudo-golden angle stack of stars thermometry with high spatial and temporal resolution using k-space weighted image contrast. Magn Reson Med. 2018 Mar;79(3):1407-1419.
8. Beck MJ, Parker DL, Bolster Jr BD, et al. Interchangeable Neck Shape–Specific Coils for a Clinically Realizable Anterior Neck Phased Array System. Magn Reson Med 2017 78:2460–2468.
9. Schabel MC, Morrell GR. Uncertainty in T(1) mapping using the variable flip angle method with two flip angles. Phys Med Biol 2009 54(1):N1-8.
Figures