3252
Interactive Correlation between Iron Deposition and Cerebral Blood Flow in the Deep Cerebral Gray Matter Structures of Hemodialysis Patients1Department of Radiology, Tianjin First Central Hospital, Tianjin, China, 2Deparment of Hemodialysis, Tianjin First Central Hospital, Tianjin, China, 3MR Collaboration, Siemens Healthcare Ltd., Beijing, China, 4Department of Radiology, Wayne State University, Detroit, MI, United States
Synopsis
The aim of this study was to explore the correlation between iron deposition (ID) and cerebral blood flow (CBF) in the deep gray matter structures of hemodialysis patients using susceptibility-weighted image mapping and arterial spin labeling. Both ID and CBF of the patients were increased compared with the healthy controls. ID in patients was positively correlated with CBF in the right putamen, while negatively correlated with CBF in the right thalamus. Abnormal calcium-phosphorus metabolism and triglyceride were shared independent factors for increased ID and CBF. Increased ID, rather than CBF, was a risk factor for neurocognitive impairment.
Purpose
Excessive iron causes lipid peroxidation and neurotoxicity, weakens neuronal function, and damages neural connectivity1. Abnormal iron deposition is implicated in some neurodegenerative diseases2 and neurocognitive impairment3. Hemodialysis patients experience increased iron deposition, correlating with cerebral atrophy4. It has been reported that reduced cerebral blood flow (CBF) is associated with cerebral atrophy5. This study explored the correlation between iron deposition and CBF in deep gray matter structures of hemodialysis patients using susceptibility-weighted image mapping (SWIM) and arterial spin labeling (ASL), the common risk factors for abnormal iron deposition and CBF, and correlations between iron deposition, CBF and neurocognitive testing.Methods
Forty-three patients and thirty-five age-, gender-, and education-matched healthy controls (HCs) participated. MRI data were collected on a 3T MAGNETOM Trio a Tim System (Siemens Healthcare, Erlangen, Germany) with a 32-channel head coil. Imaging protocols included SWI, ASL, and 3D T1-MPRAGE. The parameters were as follows: SWI: TR/TE = 27/20 ms, field of view = 230×200 mm2, voxel size = 0.5×0.5×2 mm3, slices = 56, flip angle = 15°, and acquisition time = 179 s; ASL: TR/TE = 2838.1/12 ms, TI1/TI2 = 700/1800 ms, field of view = 230×230 mm2, voxel size = 2.9×2.9×4.0 mm3, slices = 25, flip angle = 90°, and acquisition time = 268 s; MPRAGE: TR/TE = 1900/2.52 ms, TI = 900 ms, field of view = 250×250 mm2, voxel size = 1.0×1.0×1.0 mm3, slices = 176, flip angle = 9°, and acquisition time = 258 s. SWIM was reconstructed from phase and magnitude data using SMART (Detroit, Michigan, USA) software. Susceptibility of bilateral gray matter nuclei was measured using SPIN (Detroit, Michigan, USA) software (Fig. 1). ASL data were postprocessed to acquire individual CBF maps. Individual gray matter nuclei masks, which were used to measure the individual gray-matter-corrected CBF, were created by applying the inverse transformation matrix from individual T1 structural images to MNI space into probabilistic templates (Harvard-Oxford atlases and SUIT) using SPM12 (https://www.fil.ion.ucl.ac.uk/spm/software/spm12/) software. We enrolled fifty HCs (25 males, 25 females, 22 - 70 years) to generate the probabilistic atlas of substantia nigra and red nuclei using magnitude data of SWI (processing procedure same with SUIT6), which was used to measure the individual gray-matter-corrected CBF of these two nuclei. The patients’ clinical laboratory data were collected, and participants received Mini Mental State Examination (MMSE) to evaluate neurocognitive function.
Two-sample t-test was used to examine the differences in iron deposition and CBF between the patients and HCs. Pearson correlation analysis was performed for iron deposition and CBF in the patients and HCs. Stepwise multiple regression analysis was used to explore the independent factors for abnormal iron deposition and CBF. Pearson correlation analysis was performed for the association between iron deposition, CBF, and MMSE score. A Bonferroni-corrected P < 0.05 for the comparison and a false discovery rate-corrected P < 0.05 for the correlation analysis were considered to be significant.
Results
Iron deposition in the bilateral caudate, substantia nigra, red nuclei, and dentate nuclei and the CBF of the right globus pallidus, bilateral putamen, and right thalamus in patients was increased compared with HCs (all P < 0.05/14, Bonferroni corrected) (Table. 1). Iron deposition in the right putamen in patients and the right caudate and bilateral putamen in HCs was positively correlated with CBF, whereas iron deposition in the right thalamus in patients and bilateral thalamus in HCs was negatively correlated with CBF (Fig. 2). Calcium, phosphorus, and triglyceride were independent factors for abnormal iron deposition. Hematocrit, hemoglobin, urea nitrogen, triglyceride, phosphorus, and serum iron were independent factors for abnormal CBF (Table. 2). Increased iron deposition, not CBF, was correlated with the MMSE score (Fig. 3).Discussion
Iron deposition was positively correlated with the CBF in the gray matter nuclei (except the thalamus) of patients and HCs, indicating that increased CBF may be one reason for the increased iron deposition. We cannot explain the negative correlation between iron deposition and CBF in the thalamus of the participants; it may be due to special structures and functions of the thalamus. Increased iron deposition, but not CBF, was correlated with the MMSE score, suggesting that increased CBF is a secondary phenomenon due to renal anemia, which can transport more iron into the brain and further damage the neurocognitive function.Conclusion
Iron deposition in gray matter nuclei is correlated with CBF in hemodialysis patients and HCs. Increased iron deposition, not CBF, was a risk factor for neurocognitive impairment. Abnormal calcium-phosphorus metabolism and triglyceride are shared independent risk factors for both abnormal iron deposition and CBF.Acknowledgements
This work was supported by the Natural Scientific Foundation of China (grant number 81501457 to Shuang Xia; grant number 8167070944, 81873888 to Wen Shen), the Tianjin Science and Technology Project (grant number 16ZXMJSY00210 to Shuang Xia) and Natural Science Foundation of Tianjin (grant number 16JCYBJC27300 to Wen Shen).References
1. Bilgic B, Pfefferbaum A, Rohlfing T, Sullivan EV, Adalsteinsson E. MRI estimates of brain iron concentration in normal aging using quantitative susceptibility mapping. Neuroimage 2012;59:2625–2635.
2. Thomas M, Jankovic J. Neurodegenerative disease and iron storage in the brain. Curr Opin Neurol 2004;17:437–442.
3. Ghadery C, Pirpamer L, Hofer E, et al. R2* mapping for brain iron: associations with cognition in normal aging. Neurobiol Aging 2015;36:925–932.
4. Chai C, Zhang M, Long M, Chu Z, Wang T, Wang L, Guo Y, Yan S, Haacke EM, Shen W, Xia S. Increased brain iron deposition is a risk factor for brain atrophy in patients with haemodialysis: a combined study of quantitative susceptibility mapping and whole brain volume analysis. Metab Brain Dis. 2015 Aug;30(4):1009-16.
5. Zonneveld HI, Loehrer EA, Hofman A, Niessen WJ, van der Lugt A, Krestin GP, Ikram MA, Vernooij MW. The bidirectional association between reduced cerebral blood flow and brain atrophy in the general population. J Cereb Blood Flow Metab. 2015 Nov;35(11):1882-7.
6. Diedrichsen J, Maderwald S, Küper M, Thürling M, Rabe K, Gizewski ER, Ladd ME, Timmann D. Imaging the deep cerebellar nuclei: a probabilistic atlas and normalization procedure. Neuroimage. 2011 Feb 1;54(3):1786-94.
Figures
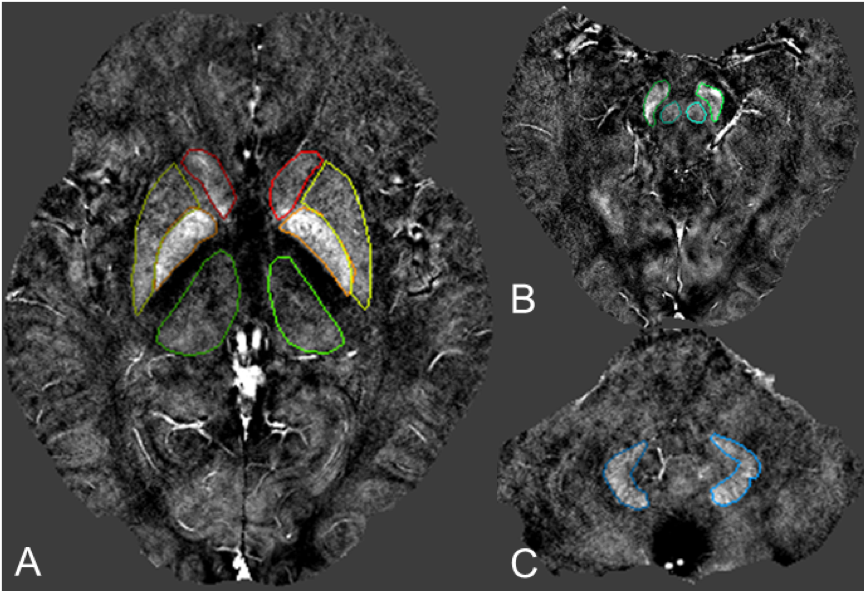
Fig. 1. Volumes of interest of the cerebral gray matter nuclei outlined in susceptibility-weighted image mapping.
A. The level of the basal ganglia in the SWIM image; B. The level of the mid-brain in the SWIM image; C. The level of the cerebellum in the SWIM image. A. bilateral caudate nucleus (front); bilateral putamen (middle, lateral); bilateral globus pallidus (middle, medial); bilateral thalamus (posterior); B. bilateral substantia nigra (lateral); bilateral red nucleus (medial); C. bilateral dentate nucleus.
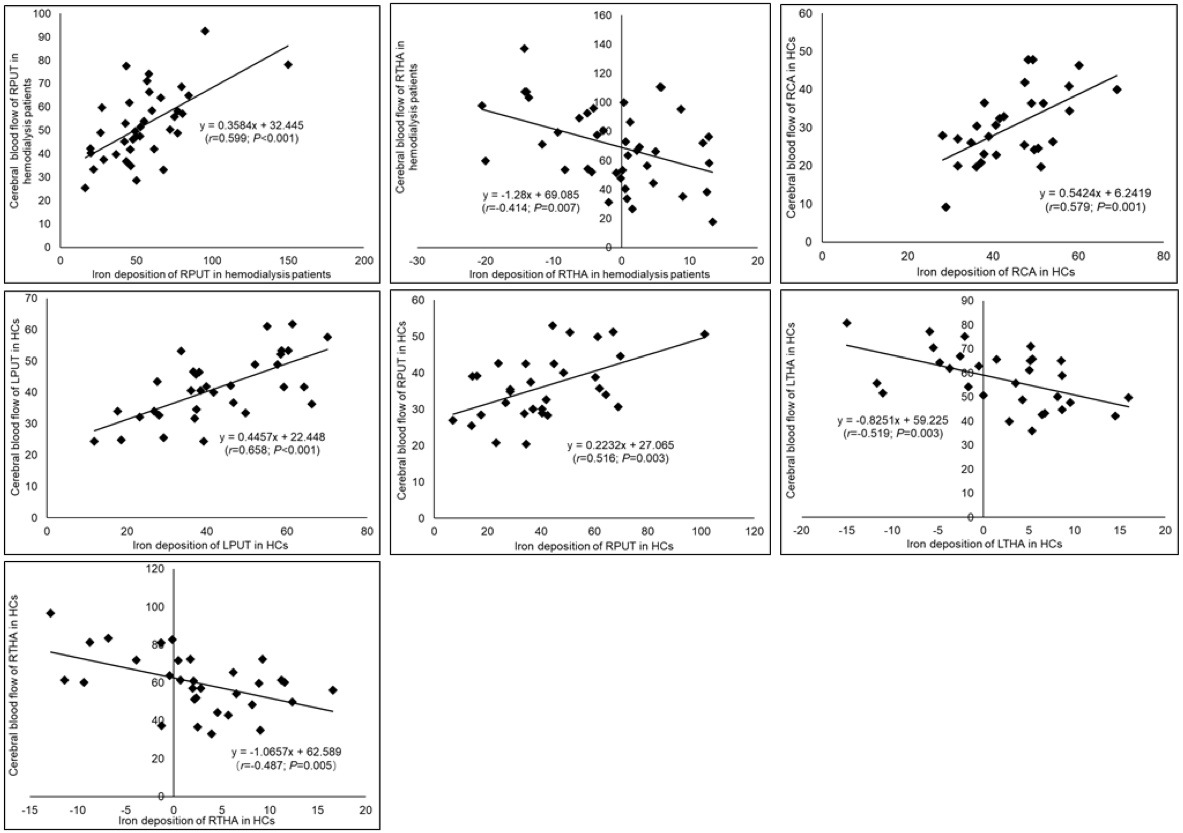
Fig. 2. Correlation between iron deposition (parts per billion) and CBF (ml/100g/min) in cerebral deep gray matter nuclei of the hemodialysis patients and HCs.
RCA = right caudate nucleus; LPUT = left putamen; RPUT = right putamen; LTHA = left thalamus; RTHA = right thalamus.
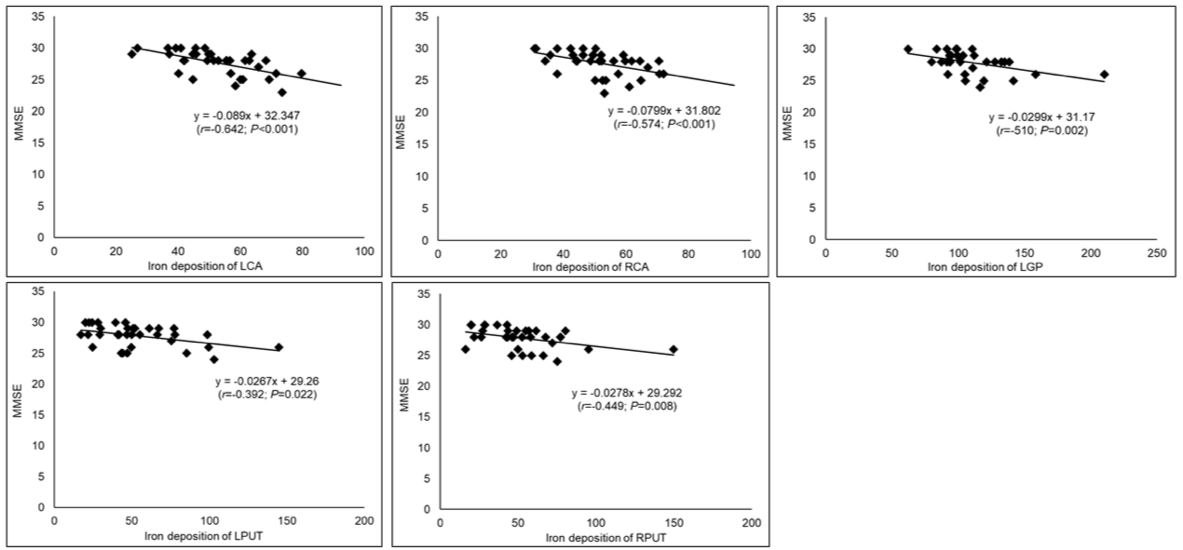
Fig. 3. Correlation between iron deposition (parts per billion) of the cerebral deep gray matter nuclei and MMSE score in hemodialysis patients.
LCA = left caudate nucleus; RCA = right caudate nucleus; LGP = left globus pallidus; LPUT = left putamen; RPUT = right putamen.
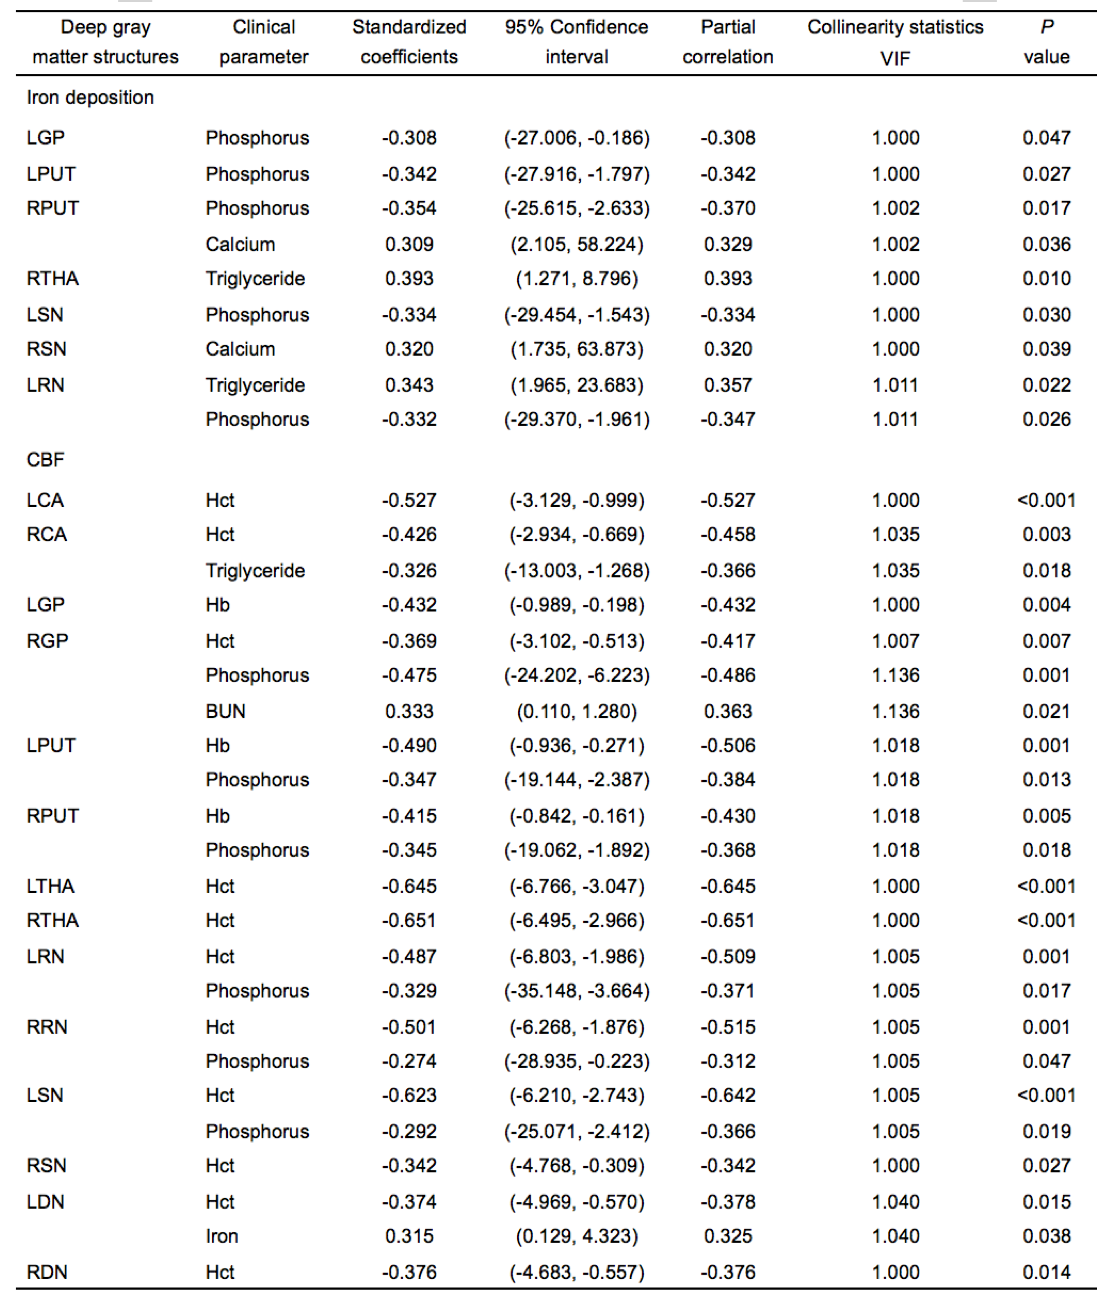
Table 2. Independent risk factors for iron deposition (parts per billion) and CBF (ml/100g/min) in the cerebral deep gray matter nuclei of hemodialysis patients and HCs.
LCA = left caudate nucleus; RCA = right caudate nucleus; LGP = left globus pallidus; RGP = right globus pallidus; LPUT = left putamen; RPUT = right putamen; LTHA = left thalamus; RTHA = right thalamus; LSN = left substantia nigra; RSN = right substantia nigra; LRN = left red nucleus; RRN = right red nucleus; LDN = left dentate nucleus; RDN = right dentate nucleus.