3249
Robust MRI assessment of cerebral microvasculature using stimulated-echo diffusion-imaging method1Bio-medical engineering, Ulsan National Institute of Science and Technology, Ulsan, Korea, Republic of
Synopsis
Stimulated-echo diffusion-imaging method was employed to reduce the effect of macroscopic field inhomogeneity and large vessel overestimation on the quantification of blood volume fraction and mean vessel radius. Stimulated-echo diffusion-imaging method were compared with conventional spin-echo and gradient-echo methods by Monte Carlo (MC) proton diffusion simulations and in vivo rat experiments on a 7 T system. The results of this study showed that stimulated-echo based MR relaxation-rates, ∆RSTE,long TD (ΔR2* like) and ∆RSTE,short TD (ΔR2 like), provide the robust means of assessing cerebral microvasculature where the macroscopic field inhomogeneity is severe and signal contamination from adjacent large vessel is significant without necessity of co-registering gradient- and spin-echo images.
Introduction
Measurements of changes in magnetic resonance (MR) relaxation-rates, ΔR2 and ΔR2*, induced by the injection of an intravascular contrast media enable the quantification of cerebral microvasculature such as blood volume fraction and mean vessel radius.1,2 However, the macroscopic field inhomogeneity from air-tissue interface and large blood vessel results in measurement error of ΔR2* due to gradient echo acquisition.1-3 Also, co-registering maps from separate gradient- and spin-echo acquisitions typically suffer from different point spread functions.
In this study, stimulated-echo diffusion-imaging method was employed to reduce the effect of macroscopic field inhomogeneity and large vessel overestimation on the quantification of blood volume fraction and mean vessel radius. Stimulated-echo diffusion-imaging method were compared with conventional spin-echo and gradient-echo methods by Monte Carlo (MC) proton diffusion simulations and in vivo rat experiment on a 7 T system.
Methods
Finite perturber method was employed to calculate the B0 shift of randomly distributed cylinder models (0.4 × 0.4 × 0.4 mm3) with various radii (2 to 30 μm) and volume fractions (2, 4, 6, and 8 %).4 Δχ for the simulation was 3.6 ppm (SI unit, dose of 200 μmol iron/kg when using USPIO).1 Stimulated-echo, spin-echo, and gradient-echo acquisitions were simulated by MC approach. Echo times (TE) for stimulated-echo, spin-echo, and gradient-echo acquisitions were 10 ms, and diffusion times (TD) for stimulated-echo acquisition were 10 and 1200 ms. Changes of transverse relaxation-rates (ΔR2, ΔR2*, and ΔRSTE for spin-echo, gradient-echo, and stimulated-echo respectively) were calculated by following equation:
ΔR2, ΔR2*, and ΔRSTE = 1/TE ln(Spre/Spost) (1)
where Spre and Spost are the signal intensity before and after administration of contrast agent respectively. Vessel size index based on spin-echo/gradient-echo and stimulated-echo methods were calculated by ΔR2*/ΔR2 and ΔRSTE,TD=1200ms/ΔRSTE,TD=10ms respectively.
For the in vivo experiment, stimulated-echo sequence with phase cycling scheme was implemented on the Bruker 7 T scanner.5 To measure cerebral blood volume fraction and vessel size index of normal Wister rat (208 g), ΔR2*, ΔR2, ΔRSTE,TD=10ms, and ΔRSTE,TD=1000ms was measured by spin-echo, gradient-echo, and stimulated-echo acquisitions with following parameters: pulse repetition time = 2500 ms, TE = 10 ms, number of scans = 4, acquisition resolution = 0.234 × 0.234 × 1 mm3, contrast agent dose of 360 μmol iron/kg using intravascular superparamagnetic iron oxide nanoparticles (SPION).
Results
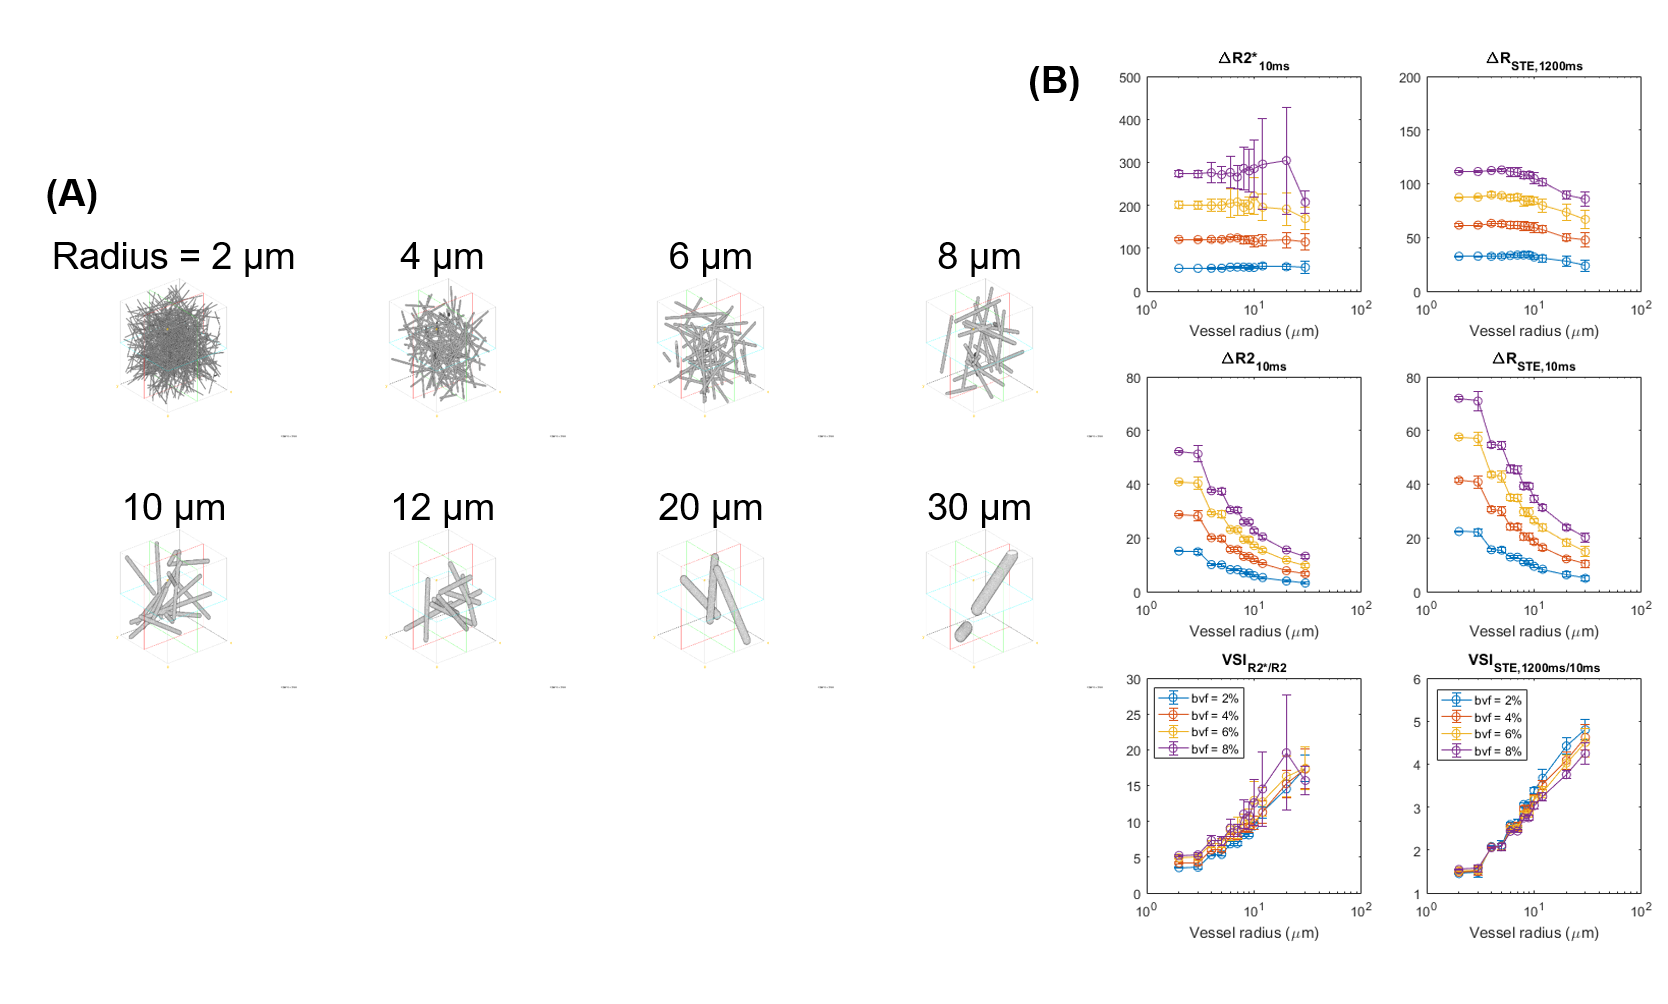
Representative volume rendered images of randomly distributed cylinder models are shown in Figure 1A. Randomness of the cylinder distribution decreases as the cylinder radius increases. Figure 1B illustrates computed changes of relaxation-rates. ΔR2* and ΔRSTE,TD=1200ms are linearly proportional to the blood volume fraction, and ΔR2 and ΔRSTE,TD=10ms decrease as the cylinder radius increases. ΔR2*/ΔR2 and ΔRSTE,TD=1200ms/ΔRSTE,TD=10ms are proportional to the cylinder radius, and blood volume effect was compensated. For the small cylinder radius less than 10 μm, ΔRSTE,TD=1200ms/ΔRSTE,TD=10ms shows smaller standard deviation than ΔR2*/ΔR2.
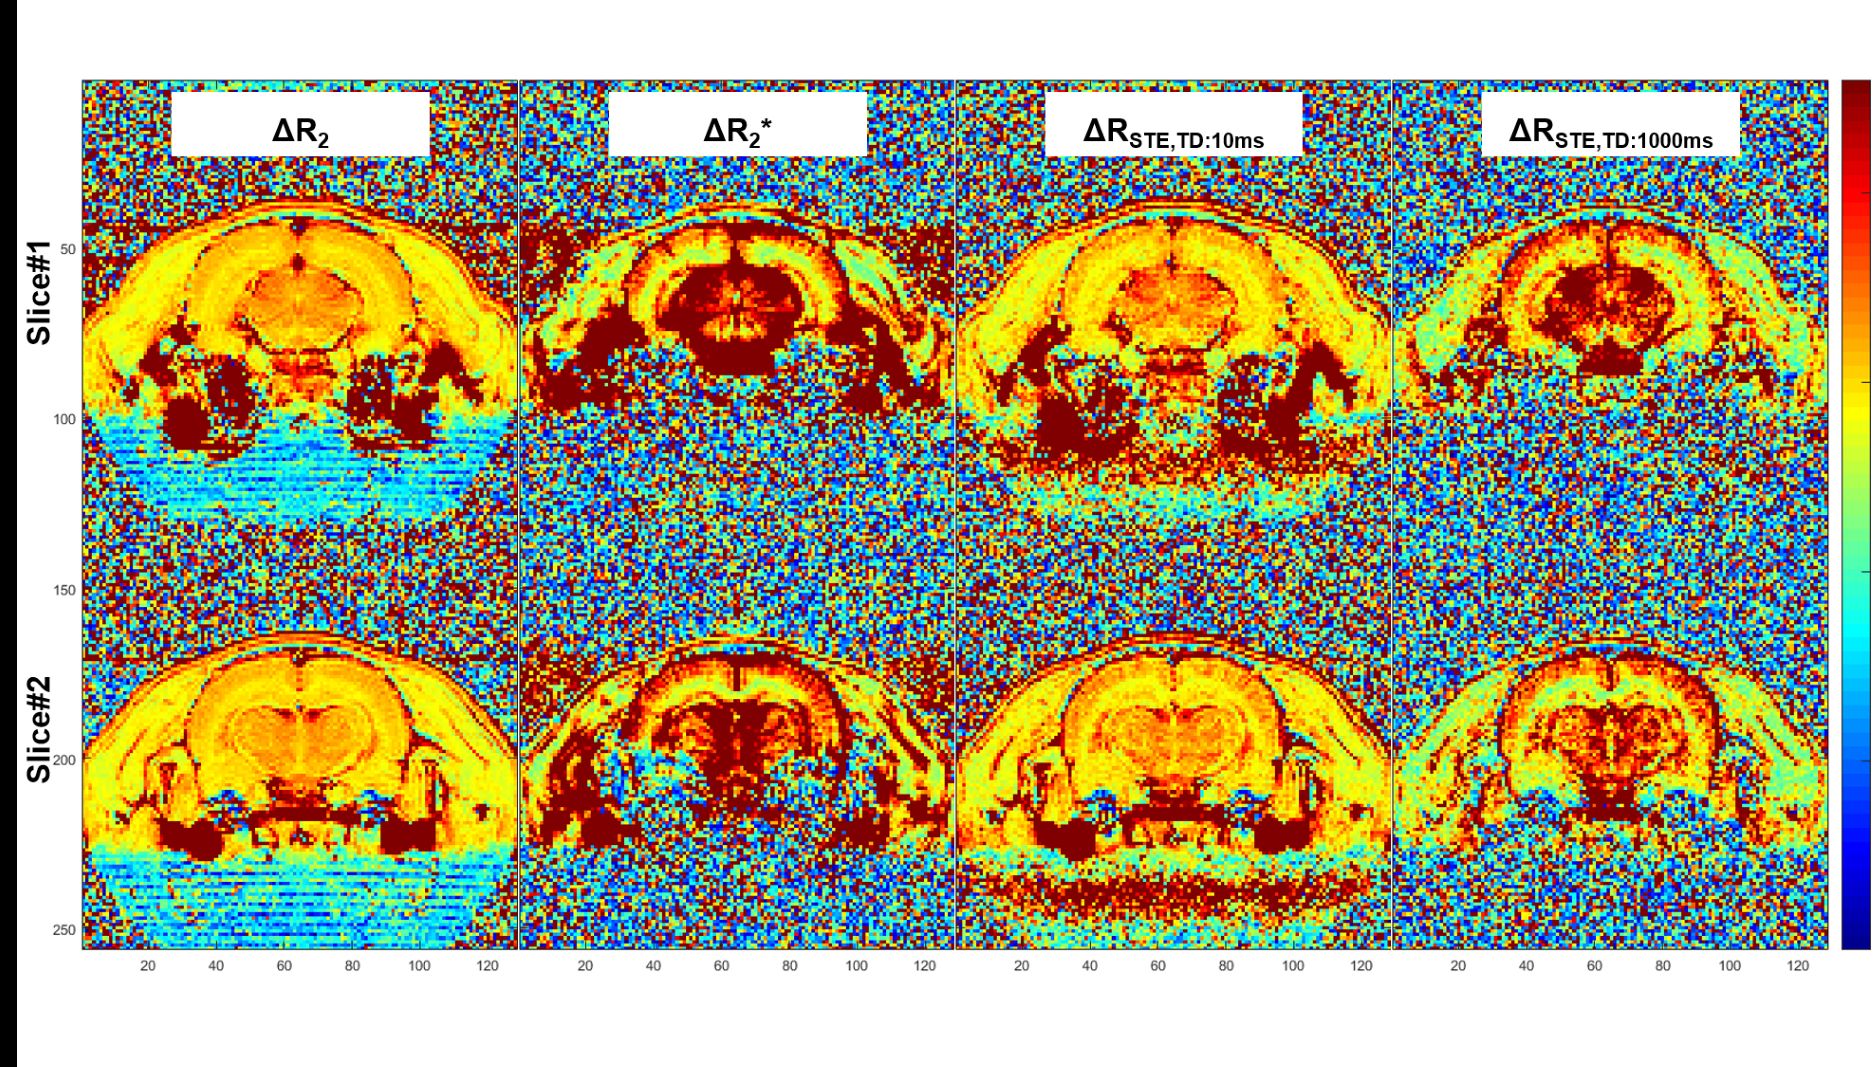
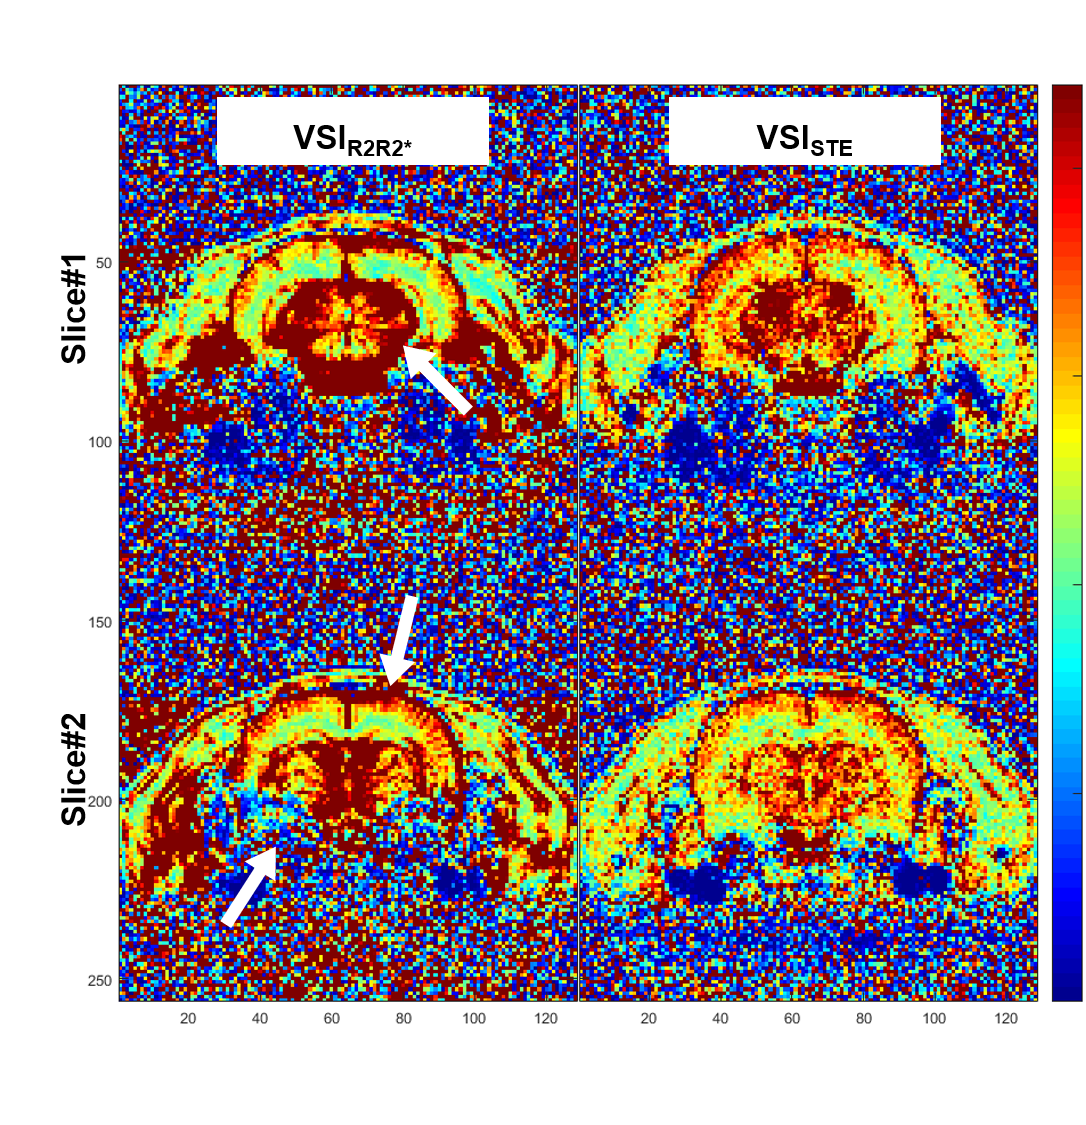
Figure 2 shows in vivo measurement of cerebral ΔR2*, ΔR2, ΔRSTE,TD=10ms, and ΔRSTE,TD=1000ms, and ΔR2*/ΔR2 and ΔRSTE,TD=1000ms/ΔRSTE,TD=10ms are illustrated in Figure 3. In vivo results are comparable to the results of MC simulation. As pointed with white arrows, ΔR2* is distorted where the macroscopic field inhomogeneity is severe, and the blood volume is overestimated where the large vessel exists. Whereas, the results from stimulated-echo based vessel size index appears to be robust again them.
Discussion
For the measurement of cerebral blood volume fraction and vessel radius, we compared stimulated-echo diffusion-imaging method with spin-echo and gradient-echo methods by means of Monte Carlo simulation and in vivo Wister rat experiment on a 7T system. MR relaxation-rates from stimulated-echo methods, ΔRSTE,long TD, and ΔRSTE,short TD, provide cerebral blood volume fraction and vessel size information, which are comparable to ΔR2* and ΔR2 from gradient-echo and spin-echo methods respectively. However, the distortion due to macroscopic field inhomogeneity and overestimation of large vessel region of the gradient-echo based relaxation-rate (ΔR2*) was significantly reduced with stimulated-echo based relaxation-rate (ΔRSTE,long TD). And the vessel size information from ΔR2 and ΔRSTE,short TD is very consistent. Therefore, stimulated-echo based MR relaxation-rates, ΔRSTE,long TD and ΔRSTE,short TD, provide the robust means of assessing cerebral microvasculature where the macroscopic field inhomogeneity is severe and large vessel region without the need of co-registering gradient- and spin-echo acquisitions.Acknowledgements
This work was supported by the National Research Foundation of Korea under Grant number 2018M3C7A1056887.References
1. Troprès, Irène, et al. "Imaging the microvessel caliber and density: principles and applications of microvascular MRI." Magnetic resonance in medicine 73.1 (2015): 325-341.
2. Emblem, Kyrre E., et al. "Vessel calibre—a potential MRI biomarker of tumour response in clinical trials." Nature reviews Clinical oncology 11.10 (2014): 566.
3. Kiselev, Valerij G., et al. "Vessel size imaging in humans." Magnetic resonance in medicine 53.3 (2005): 553-563.
4. Pathak, A.P., B.D. Ward, and K.M. Schmainda, A novel technique for modeling susceptibility-based contrast mechanisms for arbitrary microvascular geometries: the finite perturber method. Neuroimage, 2008. 40(3): p. 1130-1143.
5. Sprinkhuizen, S. M., Ackerman, J. L., & Song, Y. Q. (2014). Influence of bone marrow composition on measurements of trabecular microstructure using decay due to diffusion in the internal field MRI: Simulations and clinical studies. Magnetic resonance in medicine, 72(6), 1499-1508.
Figures