3247
MRI pulse wave profiles of cerebral arteries1Radiology, Weill Cornell Medical College, New York, NY, United States
Synopsis
The pulse pressure wave is an indicator for vascular health. Given the importance of vascular health to the central nervous system, we developed a method to extract intracranial pulse waveforms along the main cerebral arteries from dynamic MRI data. The resulting “pulse wave profiles” track the pulse shape along the main arteries of the brain. The simultaneous acquisition of pulse waveforms within the whole brain at once allows for a system analysis of the vasculature. A Matlab toolbox to compute pulse wave profiles is provided.
Introduction
The pulse pressure wave in the carotid and femoral arteries is an indicator for vascular health, as arterial compliance and the associated pulse wave velocity1,2 are reliable prognostic markers for cardiovascular morbidity and mortality3. Given the importance of vascular health to the central nervous system, there is a need for diagnostic methods to extend the evaluation of pressure waves to the brain. Cerebrovascular compliance absorbs the impact of the pulse pressure wave on the brain and enables steady perfusion throughout the cardiac cycle4,5. In addition, the pressure gradient caused by arterial pulsatility could be a driving force in the brain’s paravascular waste clearance system6,7.
The arterial pulse leaves a clear signal in dynamic MRI data of brain vasculature8-15, originating from pulsations of the vascular wall, vessel movement, blood flow effects, and other factors. Here we propose a method to extract the pulse waveforms along the main cerebral arteries from dynamic 7T MRI data, and present pulse wave profiles, diagrams of stacked pulse waveforms obtained from points along the artery. Pulse wave profiles afford a compact, visual, easily interpreted means for displaying information contained in pulse pressure waves. A link to software used to generate the profiles is provided.
Methods
Data: Dynamic EPI scans acquired on healthy subjects on a 7 Tesla MRI scanner16, covering regions between frontal and occipital cortex.
Analysis: For each subject, pulse waveforms were extracted from EPI data by hypersampling, a generalized form of retrospective gating17. Waveforms were estimated by smoothing the hypersampled signal with a zero-lag filter, retaining six cycles per cardiac cycle, and subsequent amplitude normalization. Waveforms were shifted to offset their relative slice acquisition time and then shifted by a constant amount to position the wave foot at the beginning of the cardiac cycle. From the resulting waveform amplitude volumes, maximum intensity projections (MIPs) were created (Fig. 1B). From those, start and end points on the middle cerebral artery (MCA; Fig. 1A) were selected. A reinforcement learning algorithm based on the Bellman equation18,19 was used to define all the intermediate points on the MCA (overlay in Fig. 1B).
Pulse wave profiles: The pulse wave profiles were created by stacking all waveforms (Fig. 1C) vertically and color coding their values (Fig. 1D). Wave peaks and troughs were detected automatically and labelled with black and white markers, respectively, to guide the eye.
Wave transfer functions: Wave transfer functions relating input to output waveforms in a linear I/O model in frequency space were computed from averaged proximal (towards the heart) and distal (towards the venous system) waveforms (Fig. 1E).
Detailed Analysis and Software: For more details on the analysis, we refer to the provided Matlab toolbox at www.mathworks.com/matlabcentral/fileexchange/68807-pwp. It reproduces the pulse wave profiling results (Fig. 1A - D).
Results
Pulse amplitude maps with an automatically tracked MCA, a pulse wave profile, averaged pulse waveforms, and the corresponding wave transfer function are shown in Fig. 1 for a single subject. Estimates of pulse waveforms show characteristic features such as a systolic upstroke and dicrotic notch (Fig. 1C). Pulse waveforms change with position on the MCA (Fig. 1D), also measured by the transfer function’s gain and phase (Fig. 1E).
Figure 2 shows an animation of the pulse wave traversing the brain.
Figure 3 shows MRI pulse wave profiles for 12 subjects. There is variability between subjects. For example, the slope of the line connecting the wave feet, related to pulse wave velocity, varies considerably between subjects.
Discussion
The simultaneous acquisition of pulse waveforms within the whole brain at once allows for a system analysis that is usually possible only with invasive methods20. For example, timing information in the pulse wave profiles will facilitate estimation of properties such as pulse wave velocity. Transfer functions, which are independent of the incoming pulse shape, can be estimated from the pulse wave profiles to assess downstream wave reflection. The origins of the signals observed with these methods are currently under investigation9,14.
Conclusion
MRI pulse wave profiles consist of estimates of pulse waveforms as the pulse travels down an artery or vein of a human brain. The peaks and troughs of these profiles contain information about local and non-local (via reflection) physical properties of the cerebrovascular system. We have observed a noteworthy variability in a sample of healthy subjects. Because of the significance of pulse pressure wave physiology in vascular health, our findings invite further studies of the origin of this variability, and a Matlab toolbox has been provided for this purpose.
Acknowledgements
We would like to thank the authors of the “Forrest Gump” study16 for providing their MRI data base. Disclosure: This work uses algorithms that are part of patent applications by Cornell University.
References
1 Bramwell, J. C. The velocity of the pulse wave in man. P R Soc Lond B-Conta 93, 298-306 (1922).
2 Fung, Y. C. Biomechanics: Circulation. 2nd edn (Springer 1997).
3 McEniery, C. M. et al. Normal vascular aging: Differential effects on wave reflection and aortic pulse wave velocity - The Anglo-Cardiff Collaborative Trial (ACCT). J Am Coll Cardiol 46, 1753-1760 (2005).
4 Guyton, A. C. & Hall, J. E. Textbook of Medical Physiology. 11th edn (Saunders/Elsevier 2006).
5 Vrselja, Z., Brkic, H., Mrdenovic, S., Radic, R. & Curic, G. Function of circle of Willis. J Cerebr Blood F Met 34, 578-584 (2014).
6 Bacyinski, A., Xu, M. S., Wang, W. & Hu, J. N. The paravascular pathway for brain waste clearance: Current understanding, significance and controversy. Front. Neuroanat. 11 (2017).
7 Jessen, N. A., Munk, A. S. F., Lundgaard, I. & Nedergaard, M. The glymphatic system: A beginner's guide. Neurochem. Res. 40, 2583-2599 (2015).
8 Dagli, M. S., Ingeholm, J. E. & Haxby, J. V. Localization of cardiac-induced signal change in fMRI. NeuroImage 9, 407-415 (1999).
9 Tong, Y. J., Hocke, L. M. & Frederick, B. D. Short repetition time multiband echo-planar imaging with simultaneous pulse recording allows dynamic imaging of the cardiac pulsation signal. Magn. Reson. Med. 72, 1268-1276 (2014).
10 Voss, H. U., Dyke, J. P., Tabelow, K., Ballon, D. J. & Schiff, N. D. Magnetic Resonance Advection Imaging (MRAI): Sensitivity to pulsatile flow. Conference abstract BRAIN/PET, 0141 (2015).
11 Voss, H. U., Dyke, J. P., Ballon, D. J., Schiff, N. D. & Tabelow, K. Magnetic Resonance Advection Imaging (MRAI) depicts vascular anatomy. Conference abstract OHBM - Human Brain Mapping, 2436 (2015).
12 Voss, H. U., Dyke, J. P., Tabelow, K., Schiff, N. D. & Ballon, D. J. Mapping cerebrovascular dynamics with magnetic resonance advection imaging (MRAI): modeling challenges and estimation bias. Conference abstract Meeting of the Society for Neuroscience (2015).
13 Voss, H. U., Dyke, J. P. & Ballon, D. J. Mapping cerebrovascular dynamics with MR advection imaging (MRAI): Estimation bias and image reconstruction challenges. Conference abstract ICERM - Computational and Analytical Aspects of Image Reconstruction (2015).
14 Voss, H. U., Dyke, J. P., Tabelow, K., Schiff, N. D. & Ballon, D. J. Magnetic resonance advection imaging of cerebrovascular pulse dynamics. J. Cereb. Blood Flow Metab. 37, 1223-1235 (2017).
15 Voss, H. U., Stadler, J., Dyke, J. P. & Ballon, D. J. A transfer function model for local signal propagation in spatiotemporal MR data. Proceedings of the International Society for Magnetic Resonance in Medicine, 155 (2018).
16 Hanke, M. et al. A high-resolution 7-Tesla fMRI dataset from complex natural stimulation with an audio movie. Scientific Data 1 140003 (2014).
17 Voss, H. U. Hypersampling of pseudo-periodic signals by analytic phase projection. Comput. Biol. Med. 98, 159-167 (2018).
18 Bellman, R. Dynamic-programming and the numerical-solution of variational-problems. Oper. Res. 5, 277-288 (1957).
19 Sutton, R. S. & Barto, A. G. Reinforcement Learning: An Introduction. (MIT Press 1998).
20 Wagshul, M. E., Eide, P. K. & Madsen, J. R. The pulsating brain: A review of experimental and clinical studies of intracranial pulsatility. Fluids Barriers CNS 8, 5 (2011).
Figures

Figure 1: Results for one subject.
A Angiogram with the MCA outlined by a rectangle.
B Pulse amplitude MIPs from EPI data. Main cerebral arteries and some veins are visible. The pink track follows parts of the MCA and results from an automated fit.
C Waveforms for the proximal and distal part of the MCA, obtained by hypersampling17 with an effective sampling interval of 1.6 ms.
D Pulse wave profile along the main branch of the MCA. Wave peaks and troughs are marked by dots.
E Wave transfer function fit relating the proximal and distal waveforms by a linear I/O model in frequency space.
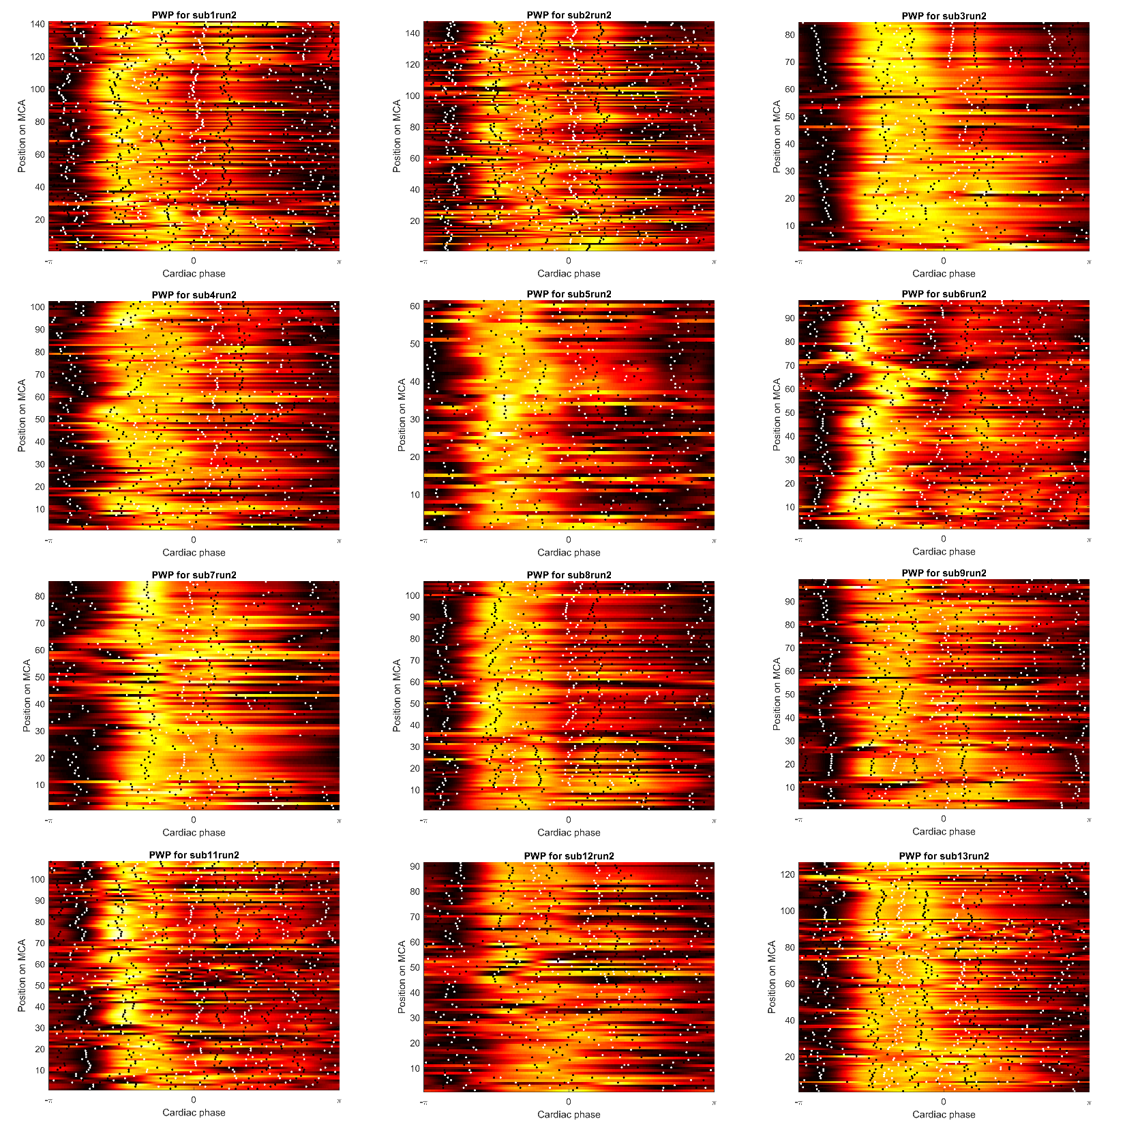
Figure 3: Pulse wave profiles for 12 subjects, showing significant variability along the MCA and across subjects.