3246
Hemodynamic impairments in asymptomatic unilateral carotid artery stenosis are increased within individual watershed areas1Department of Neuroradiology, Technical University of Munich, Munich, Germany, 2MRRC, Yale University, New Haven, CT, United States, 3Clinic for Radiology, Technical University of Munich, Munich, Germany, 4PET center, Institute of Radiopharmaceutical Cancer Research, Helmholtz-Zentrum Dresden-Rossendorf, Dresden, Germany, 5Institute of Clinical Medicine, Aarhus University, Aarhus, Denmark, 6Philips Healthcare, Hamburg, Germany, 7Clinic for Neurology, Technical University of Munich, Munich, Germany
Synopsis
Internal carotid-artery stenosis (ICAS) causes complex and not yet well understood physiological impairments, which currently limits treatment decisions. We present multimodal perfusion and oxygenation-related MRI-data from unilateral asymptomatic ICAS-patients and age-matched healthy controls. The major aim was to investigate hemodynamic impairments in ICAS within individually defined watershed areas (iWSA’s) to account for individual vascular configurations. We found statistically significant lateralization of hemodynamic parameters within iWSA’s - strongest in WM of iWSA’s. Therefore, our iWSA-based approach facilitates detection of even subtle hemodynamic changes in ICAS. Furthermore, we detected spatially widespread capillary flow heterogeneity increases which are promising future treatment indicators.
Purpose
Severe internal carotid-artery stenosis (ICAS) is a major public health issue, as it accounts for approximately 10% of all strokes.1 Hemodynamic impairments in ICAS have been investigated intensively,2-6 but treatment guidelines for asymptomatic patients are still insufficient7, not accounting for hemodynamic changes. Improve the currently lacking detection of subtle hemodynamic changes in asymptomatic ICAS7,8 is crucial to better identify patients at high stroke risk who could benefit from the invasive treatment8,9.10 It is known that perfusion impairments arise first in border zones between perfusion territories,11 while ICAS significantly increases the spatial variability of those watershed areas (WSA), e.g. by collateral flow.12 We therefore hypothesize that we can improve sensitivity to hemodynamic impairments of ICAS by using subject-specific iWSA's.12 Furthermore, we propose an easily applicable multimodal imaging protocol (Fig.1) to gain deeper insights into the complex interplay of hemodynamic impairments.
Methods
Fifty-nine participants (29 asymptomatic, unilateral ICAS-patients, age=70.1±4.8y and 30 age-matched healthy controls [HC], age=70.3±7.3y) underwent MRI on a Philips 3T Ingenia (Philips Healthcare, Best, Netherlands) using a 16-channel head-neck-coil. The imaging protocol and derived hemodynamic parameters are summarized in Fig.1. Imaging yielded maps of cerebrovascular reactivity (CVR),14 cerebral blood flow (CBF),16 relative oxygen extraction fraction (rOEF) following the multiparametric-quantitative BOLD approach (mq-BOLD)20 and relative cerebral blood volume (rCBV), capillary transit-time heterogeneity (CTH) and oxygen extraction capacity (OEC) by parametric modeling19 of dynamic susceptibility contrast (DSC) data (Fig.2C-H). Processing was performed with SPM1222 and custom Matlab23 programs. Artefact-affected parameter-maps were excluded based on visual ratings (CP, SK, JG).
Individual watershed areas (iWSA's) of each participant were defined based on DSC-derived time-to-peak (TTP) maps (Fig.2A).12 For comparisons, additional masks outside iWSA’s were generated (Fig.2B). Mean hemodynamic parameters within each hemisphere were compared between ICAS-patients vs. HC and inside vs. outside iWSA’s with additional GM and WM masks. For ICAS-patients, mean values were evaluated within hemispheres ipsilateral and contralateral to the stenosis.
Results
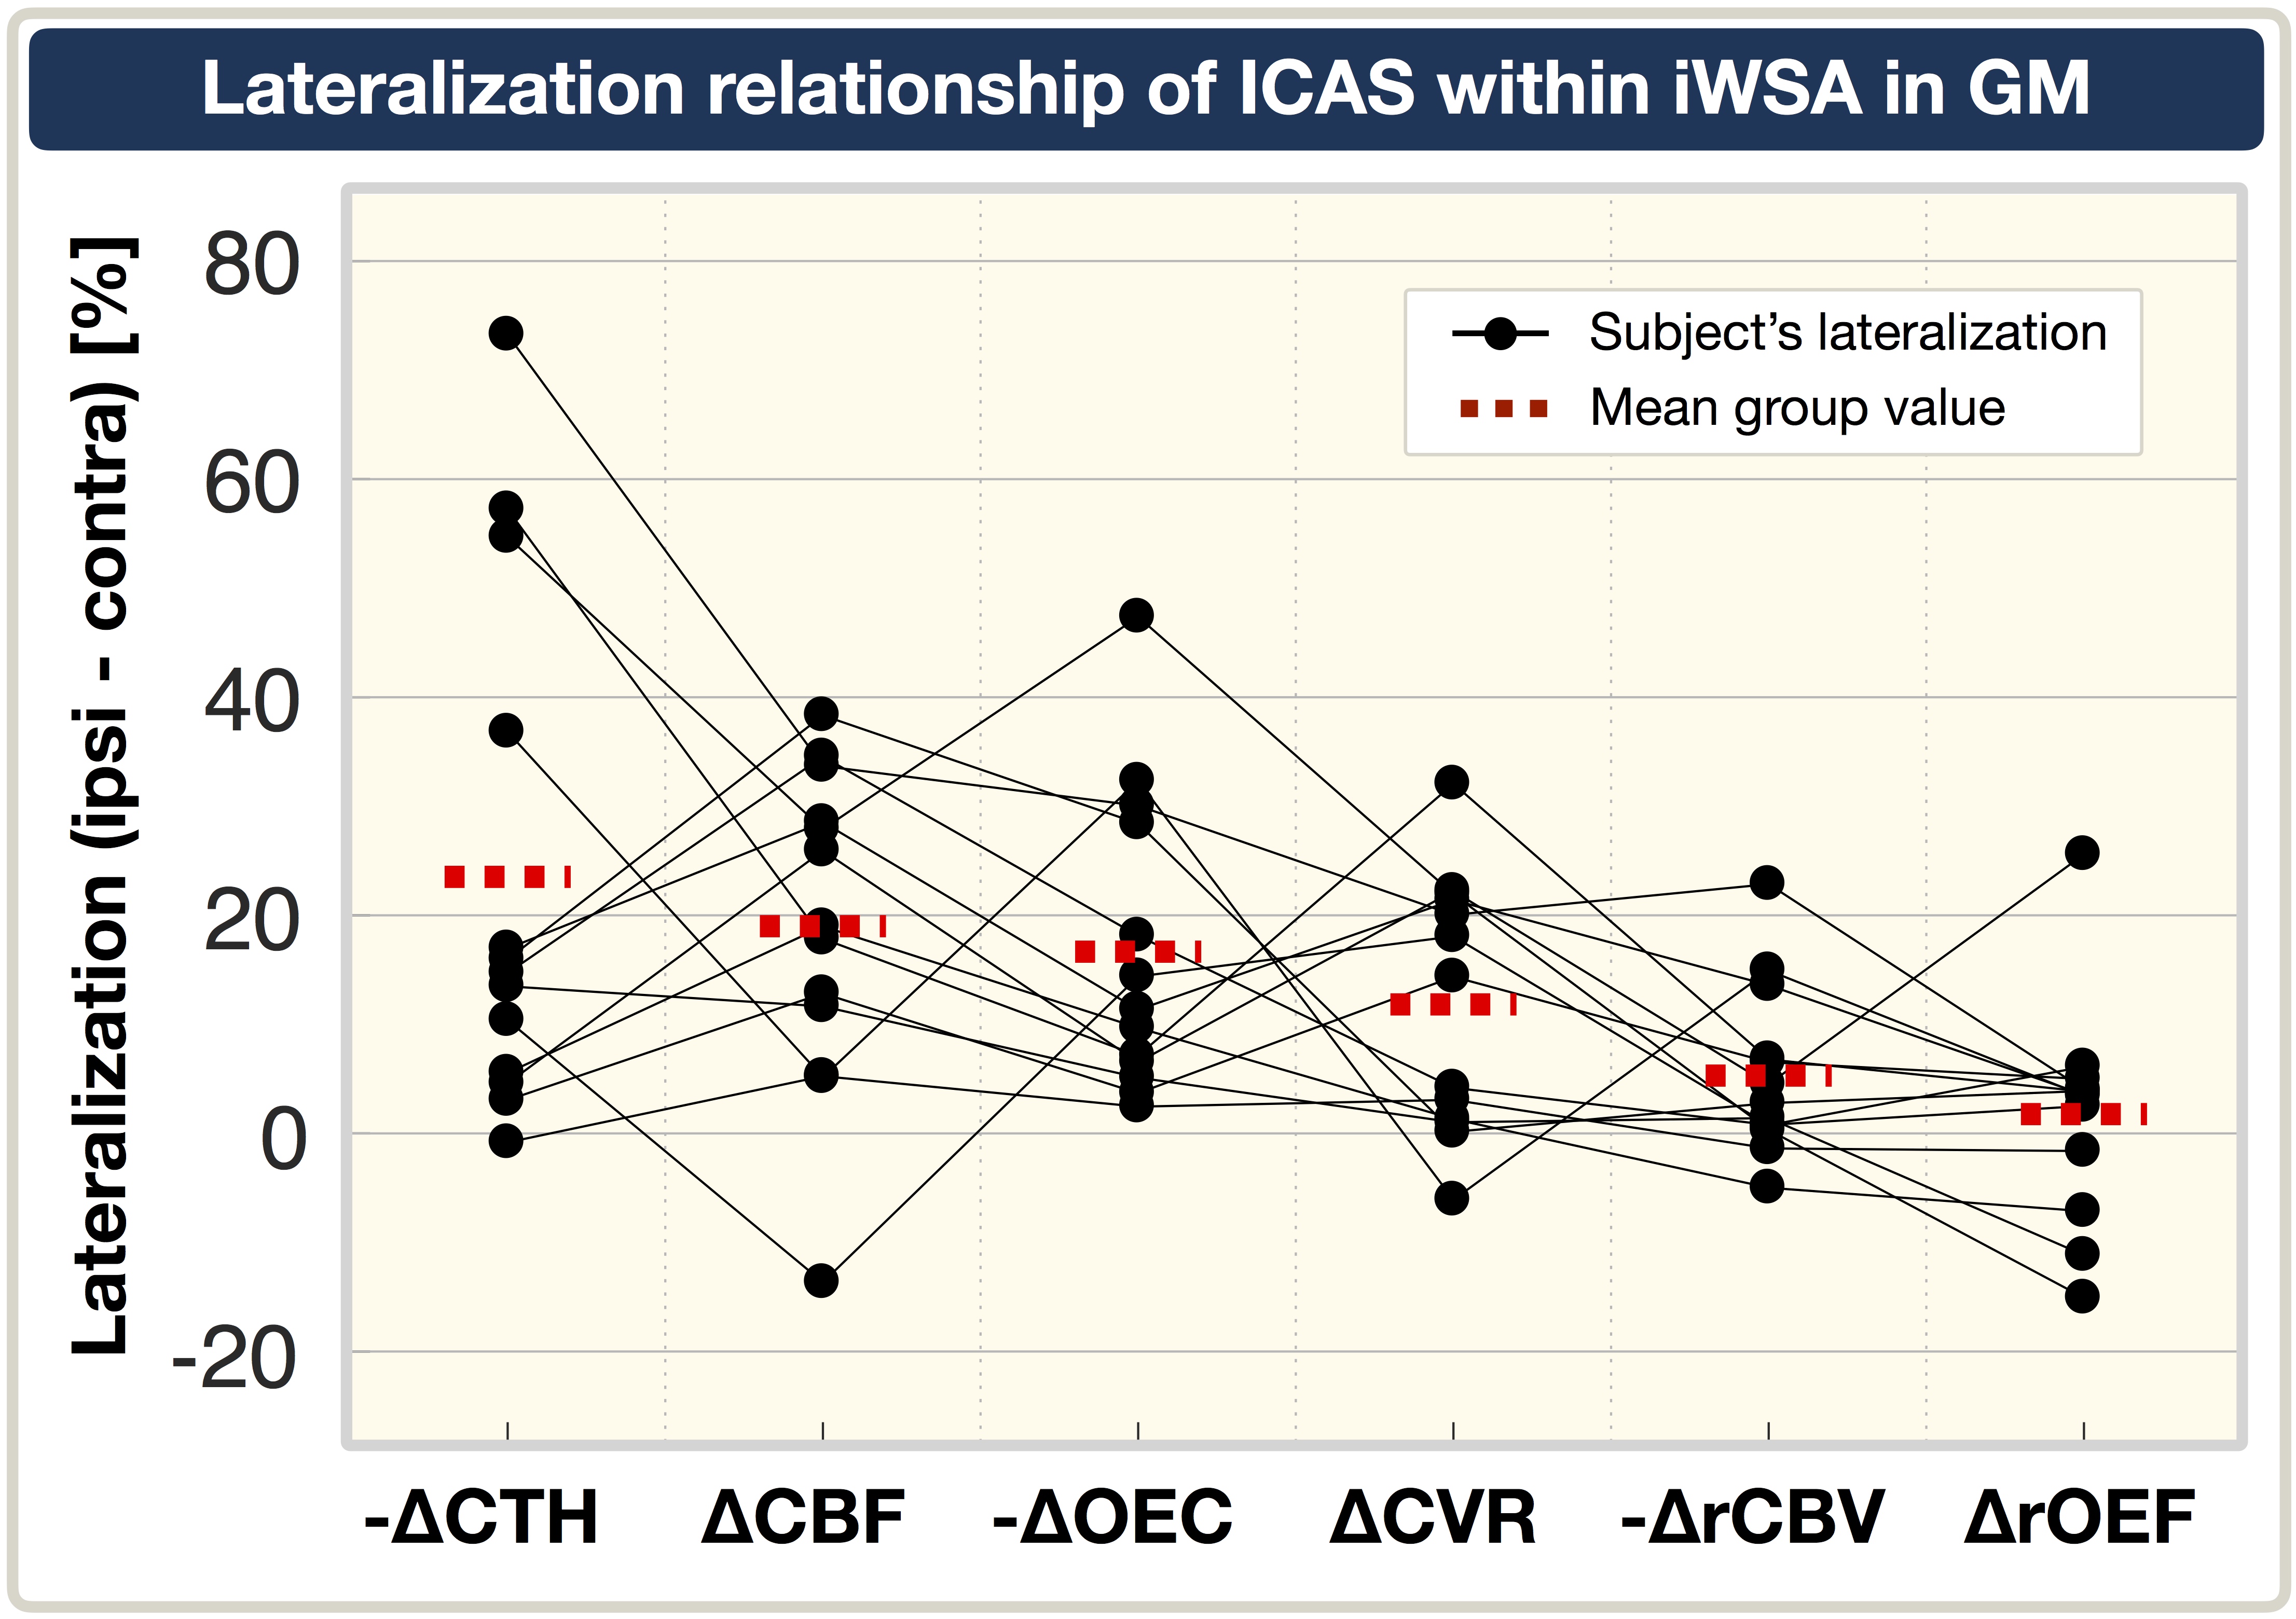
Exemplary data of an ICAS-patient is shown in Fig.2. Statistically significant lateralization of CBF, CVR, rCBV, CTH and OEC within GM-iWSA were found in ICAS-patients. For the HC group, all parameters were symmetrical between hemispheres (Fig.3). Regarding rOEF in ICAS, no significant lateralization was found on group level (Fig.3D), however, lateralization standard deviations were increased by +127% compared to HC (data not shown). Furthermore, focal rOEF increases of single subjects corresponded to elevated OEC and CTH (Fig.2E-G). Lateralization inside iWSA’s was statistically significantly enhanced for CBF and CVR, with a strong trend for rCBV (Fig.4). Overall, lateralization was stronger within WM than GM. Contrary, OEC and CTH were also lateralized, but show comparable values inside/outside iWSA's (Fig.4). Comparison of parameter's relationship reveals a clear trend, ordered from strongest to weakest lateralization (Fig.5): CTH(increased), CBF(decreased), OEC(increased), CVR(decreased), rCBV(increased) to rOEF(unaffected).
Discussion
The multimodal MRI protocol was found to be sensitive to hemodynamic impairments in unilateral-ICAS and affirmed by symmetrical HC results (Fig.3). As hypothesized, impairments of CBF, CVR and rCBV were increased within iWSA’s (Fig.4). Thus, individual WSA definition can contribute to detect subtle hemodynamic changes. Stronger effects in WM-iWSA coincide with the different blood supply in GM/WM. Ipsilaterally decreased CBF agrees with recent studies2 and decreased CVR, along with increased rCBV, indicates chronic vasodilation.25 Consistent with current literature,2 no rOEF lateralization was found on group level. However, detailed analysis revealed increased rOEF variability and individual focal increases – which is suspected to relate to increasing and decreasing OEF26 at different disease stages. Observed CBF vs. OEF mismatch could imply variable oxygen diffusivity27 – potentially moderated by CTH19,28,29.
Increased capillary flow heterogeneity (CTH) has been previously demonstrated in ICAS.30 Interestingly, we found CTH and OEC lateralization independent of iWSA-locations – which suits previous findings regarding CTH and Tmax31,32. Those CTH increases beyond iWSA-locations might be due to different sensitivities of CTH and TTP to macrovascular effects and microcapillary flow heterogeneity.30 Regarding potential early indicators for harmful cerebral hemodynamics, CTH and OEC are highly promising30,33,34 and imply straightforward impairment detection, as they showed strong lateralization independent of iWSA-locations (Fig.4).
Conclusion
In the presented study, we successfully analyzed hemodynamic impairments of ICAS within iWSA's. Our results are in accordance with current literature and offer a substantial perspective with regard to the relationship of involved parameters. Results of ∆CBF, ∆CVR and ∆rCBV suggest increased sensitivity for subtle changes when applying iWSA's. Interestingly, CTH and OEC increases are independent of iWSA-locations which implies representation of different hemodynamic changes. For the next step, we currently evaluate already acquired follow-up data after ICAS-treatment with additional cognitive testing34,35 to investigate whether hemodynamic impairments are reversible and possible positive effects on clinical outcome.
Acknowledgements
The authors acknowledge support by the Friedrich-Ebert-Stiftung, Dr.-Ing. Leonhard-Lorenz-Stiftung and the German research Foundation (DFG, grant PR 1039/6-1).References
1. Petty GW et al. (1999). "Ischemic stroke subtypes: a population-based study of incidence and risk factors." Stroke, 30: 2513-6.
2. Bouvier J et al. (2015). "Reduced CMRO2 and cerebrovascular reserve in patients with severe intracranial arterial stenosis: A combined multiparametric qBOLD oxygenation and BOLD fMRI study." HBM, 36: 695-706.
3. Donahue MJ et al. (2009). "Vascular Space Occupancy (VASO) Cerebral Blood Volume Weighted MRI Identifies Hemodynamic Impairment in Patients with Carotid Artery Disease." JMRI, 29(3): p. 718-724.
4. Vakil P et al. (2013). "Cerebrovascular Occlusive Disease: Quantitative Cerebral Blood Flow Using Dynamic Susceptibility Contrast MR Imaging Correlates with Quantitative H2[15O] PET." Radiology, 266: 879-86.
5. Derdeyn CP et al. (2002). "Variability of cerebral blood volume and oxygen extraction: stages of cerebral haemodynamic impairment revisited." Brain, 125(3): 595-607.
6. Goettler J et al. (2018). "Flow-metabolism uncoupling in patients with asymptomatic unilateral carotid artery stenosis assessed by multi-modal magnetic resonance imaging." JCBFM, p. 271678x18783369.
7. Jalbert JJ et al. (2015). "Outcomes after carotid artery stenting in medicare beneficiaries, 2005 to 2009." JAMA Neurology, 72(3): p. 276-286.
8. Alberts MJ (2015). "Carotid stenting—why treating an artery may not treat the patient." JAMA Neurology, 72(3): p. 263-264.
9. Demire SD et al. (2018). "Comparison of long-term results of carotid endarterectomy for asymptomatic carotid artery stenosis. " Gefasschirurgie, 23(Suppl 1): p. 1-7.
10. Makris N et al. (2017). "Acute reperfusion without recanalization: Serial assessment of collaterals within 6 h of using perfusion-weighted magnetic resonance imaging." JCBFM, p. 271678x17744716.
11. Momjian-Mayor I. and Baron JC (2005). "The pathophysiology of watershed infarction in internal carotid artery disease: review of cerebral perfusion studies." Stroke, 36(3): p. 567-77.
12. Kaczmarz S et al. (2018). "Increased variability of watershed areas in patients with high-grade carotid stenosis." Neurorad, 60(3): p. 311-323.
13. Pillai JJ and Mikulis DJ (2014). "Cerebrovascular Reactivity Mapping: An Evolving Standard for Clinical Functional Imaging." Am J of Neurorad, 36(1):7-13.
14. Vondrácková L et al. (2016). "Data-driven model for evaluation of cerebrovascular-reserve measurement with hypercapnia BOLD." Proc. Intl. Soc. Mag. Reson. Med. 24 (2016): 3801.
15. Alsop DC et al. (2015). "Recommended implementation of arterial spin-labeled perfusion MRI for clinical applications: A consensus of the ISMRM perfusion study group and the European consortium for ASL in dementia." MRM, 73(1): p. 102-116.
16. Kaczmarz S et al. (2016). "Evaluation of pCASL sequences for CBF measures in healthy participants and patients with high-grade internal carotid artery stenosis." ESMRMB presentation, Vienna.
17. Kluge A et al. (2016). "Analysis of three leakage-correction methods for DSC-based measurement of relative cerebral blood volume with respect to heterogeneity in human gliomas." MRM, 34(4): p. 410-21.
18. Leenders KL (1994). "PET: blood flow and oxygen consumption in brain tumors." J Neurooncol, 22(3): p. 269-73.
19. Jespersen SN and Ostergaard L (2012). "The roles of cerebral blood flow, capillary transit time heterogeneity, and oxygen tension in brain oxygenation and metabolism." JCBFM, 32(2): p. 264-77.
20. Hirsch NM et al. (2014). "Technical considerations on the validity of blood oxygenation level-dependent-based MR assessment of vascular deoxygenation." NMR Biomed, 27(7): p. 853-62.
21. Christen T et al. (2012). "Measuring brain oxygenation in humans using a multiparametric quantitative blood oxygenation level dependent MRI approach. " MRM, 68(3): p. 905-911.
22. Statistical Parametric Mapping software (SPM12) Version 6225: www.fil.ion.ucl.ac.uk/spm.
23. MATLAB and Statistics Toolbox Release 2016b, The MathWorks, Inc., Natick, Massachusetts, United States.
24. Vinci software, Max-Planck-Institut für neurologische Forschung, Cologne, Germany: http://www.nf.mpg.de/vinci3/. Accessed 09.Nov 2015.
25. Vagal AS et al. (2009). "The Acetazolamide Challenge: Techniques and Applications in the Evaluation of Chronic Cerebral Ischemia." AJNR, 30(5):p. 876-88.
26. Ostergaard L et al. (2015). "Neurovascular coupling during cortical spreading depolarization and -depression." Stroke, 46(5): p. 1392-401.
27. Hyder F et al. (1985). "A model for the regulation of cerebral oxygen delivery." J Appl Physiol, 85(2): 554-64.
28. Angleys H et al. (2016). "The Effects of Capillary Transit Time Heterogeneity (CTH) on the Cerebral Uptake of Glucose and Glucose Analogs: Application to FDG and Comparison to Oxygen Uptake." Front Comput Neurosci, 10: p. 103.
29. Rasmussen PM et al. (2015). "The effects of transit time heterogeneity on brain oxygenation during rest and functional activation". JCBFM, 35(3): p. 432-442.
30. Mundiyanapurath S et al. (2016). "Capillary Transit Time Heterogeneity Is Associated with Modified Rankin Scale Score at Discharge in Patients with Bilateral High Grade Internal Carotid Artery Stenosis." PLoS One, 11(6): p. e0158148.
31. Calamante F et al. (2010). "The Physiological Significance of the Time-to-Maximum (Tmax) Parameter in Perfusion MRI." Stroke, 41: 1169-74.
32. Østergaard L et al. (2018). "Low on energy? An energy supply-demand perspective on stress and depression." Neurosc & Biobehav Rev, 94: p. 248-270.
33. Engedal SE et al. (2017). "Transit time homogenization in ischemic stroke - A novel biomarker of penumbral microvascular failure?" JCBFM, p. 271678X17721666.
34. Ostergaard L et al. (2016). "Cerebral small vessel disease: Capillary pathways to stroke and cognitive decline." JCBFM, 36(2): p. 302-25.
35. Goettler J et al. (2018). "The stronger one-sided relative hypoperfusion, the more pronounced ipsilateral spatial attentional bias in patients with asymptomatic carotid stenosis. " JCBFM, in press.
Figures