3245
Diffusion Metrics of White Matter in Cerebral Small Vessel Disease: Unravelling the Variance in Microstructural Integrity1Institute of Neuroscience and Medicine 4, INM-4, Forschungszentrum Jülich, Jülich, Germany, 2Georgian Technical University, Tbilisi, Georgia, 3Institute of Neuroscience and Medicine 11, INM-11, JARA, Forschungszentrum Jülich, Jülich, Germany, 4JARA - BRAIN -Translational Medicine, Aachen, Germany. Department of Neurology, RWTH Aachen University, Aachen, Germany
Synopsis
Cerebral small vessel disease (SVD) has a long period of silent progression until it clinically manifests as a stroke or cognitive decline. Early detection of microstructural alterations in the white matter will help to develop targeted therapy and avoid clinical consequences. The need for advanced imaging to reflect the plethora of the changes is increasing. Here, we used the methods for the analysis of the diffusion MRI signal to investigate microstructural alterations in SVD. Our study identified the most frequently changed parameters and the affected regions. We also show increased changes in the diffusion MRI metrics, corresponding with disease severity.
Introduction
Cerebral small vessel disease (SVD) has a long period of silent progression until it clinically manifests either as a stroke or cognitive decline1. SVD induces structural changes in white matter (WM), which are represented as WM hyperintensities (WMH)2. Yet, WMH is the “tip of the iceberg” and does not reflect the whole spectrum of the alterations in microstructural integrity. Histopathological studies have shown ependymal disruption, demyelination, axonal loss and fluid accumulation as the underlying pathology caused by ischemic events and inflammation3,4,5. Due to the sensitivity of water molecular diffusion to the microenvironment, diffusion MRI (dMRI) has the potential to characterise these changes. Few studies investigating SVD via dMRI have been published, mostly using the diffusion tensor imaging (DTI) technique for dMRI signal modelling. They show decreased fractional anisotropy and increased mean diffusivity in the lesions as well as in the normal appearing WM (NAWM)6. However, DTI has well-known limitations relating to the representation of the dMRI signal in regions of complex fibre configurations7. Given that most of the lesions in SVD are located around the lateral ventricles, including the aforementioned areas, the need for more advanced methods for dMRI signal analysis is evident.
The aim of this study was to investigate the influence of the SVD and its severity on the microstructural integrity of WM and to evaluate the sensitivity and specificity of the diffusion kurtosis imaging (DKI) technique8. Furthermore, we investigated the sensitivity of the DKI-based WM model (WMM)9 to SVD-driven microstructural alterations.
Methods
We included 21 subjects (mean age: 68±7; 12 females) with varying WMH load from the population-based neuroscientific study of 1000BRAINS10.
The data were pre-processed as follows: i) denoising using the local principal component analysis11; ii) Gibbs ringing correction using the total variation approach12,13; iii) eddy-current distortions correction using the EDDY-toolkit in FSL14; iv) positive bias correction due to Rician noise15. DKI analysis was performed with the help of ExploreDTI. Four diffusion tensor metrics (mean (MD), axial (AD), radial (RD) diffusivity, and fractional anisotropy (FA)), and four kurtosis tensor metrics (mean (MK), axial (AK), radial (RK) kurtosis, and kurtosis anisotropy (KA)) were determined on a voxel-by-voxel basis. The following WMM metrics were evaluated: axial and radial extra axonal diffusivities (AxEAD, RadEAD), axonal water fraction (AWF) and tortuosity (TORT)9.
The study cohort was divided into the age- and gender-matched four groups according to the Fazekas scale, reflecting the growing load of the lesions, starting from grade 0 (no WMH) to grade 3 (most severe)16. WMH-masks were created manually based on FLAIR using ITK-snap3.4.017. FA maps were coregistered linearly and then non-linearly to the MNI152_T1_1mm using the Johns Hopkins University (JHU) FA template in FSL18,19. The estimated warp fields were applied to the rest of the metrics. The regions-of-interest (ROIs) for the WM, NAWM, corona radiata (CR) and 20 WM tracts were derived in the following way: The subject-specific WM masks were created using the overlap of the FA>0.25, and 95% of WM probability map, derived in SPM1220. WMH-masks were fed to the WM mask to avoid voxel misclassification due to the low FA values in the lesions. WMH lesions were excluded from the NAWM masks. WM tracts and CR were created using the JHU atlas. Binary masks were applied to the diffusion maps to calculate the mean and the standard deviation of the ROIs in each subject. A group-wise analysis was conducted using one-way ANOVA with the multiple comparisons corrected p<0,05.
Results
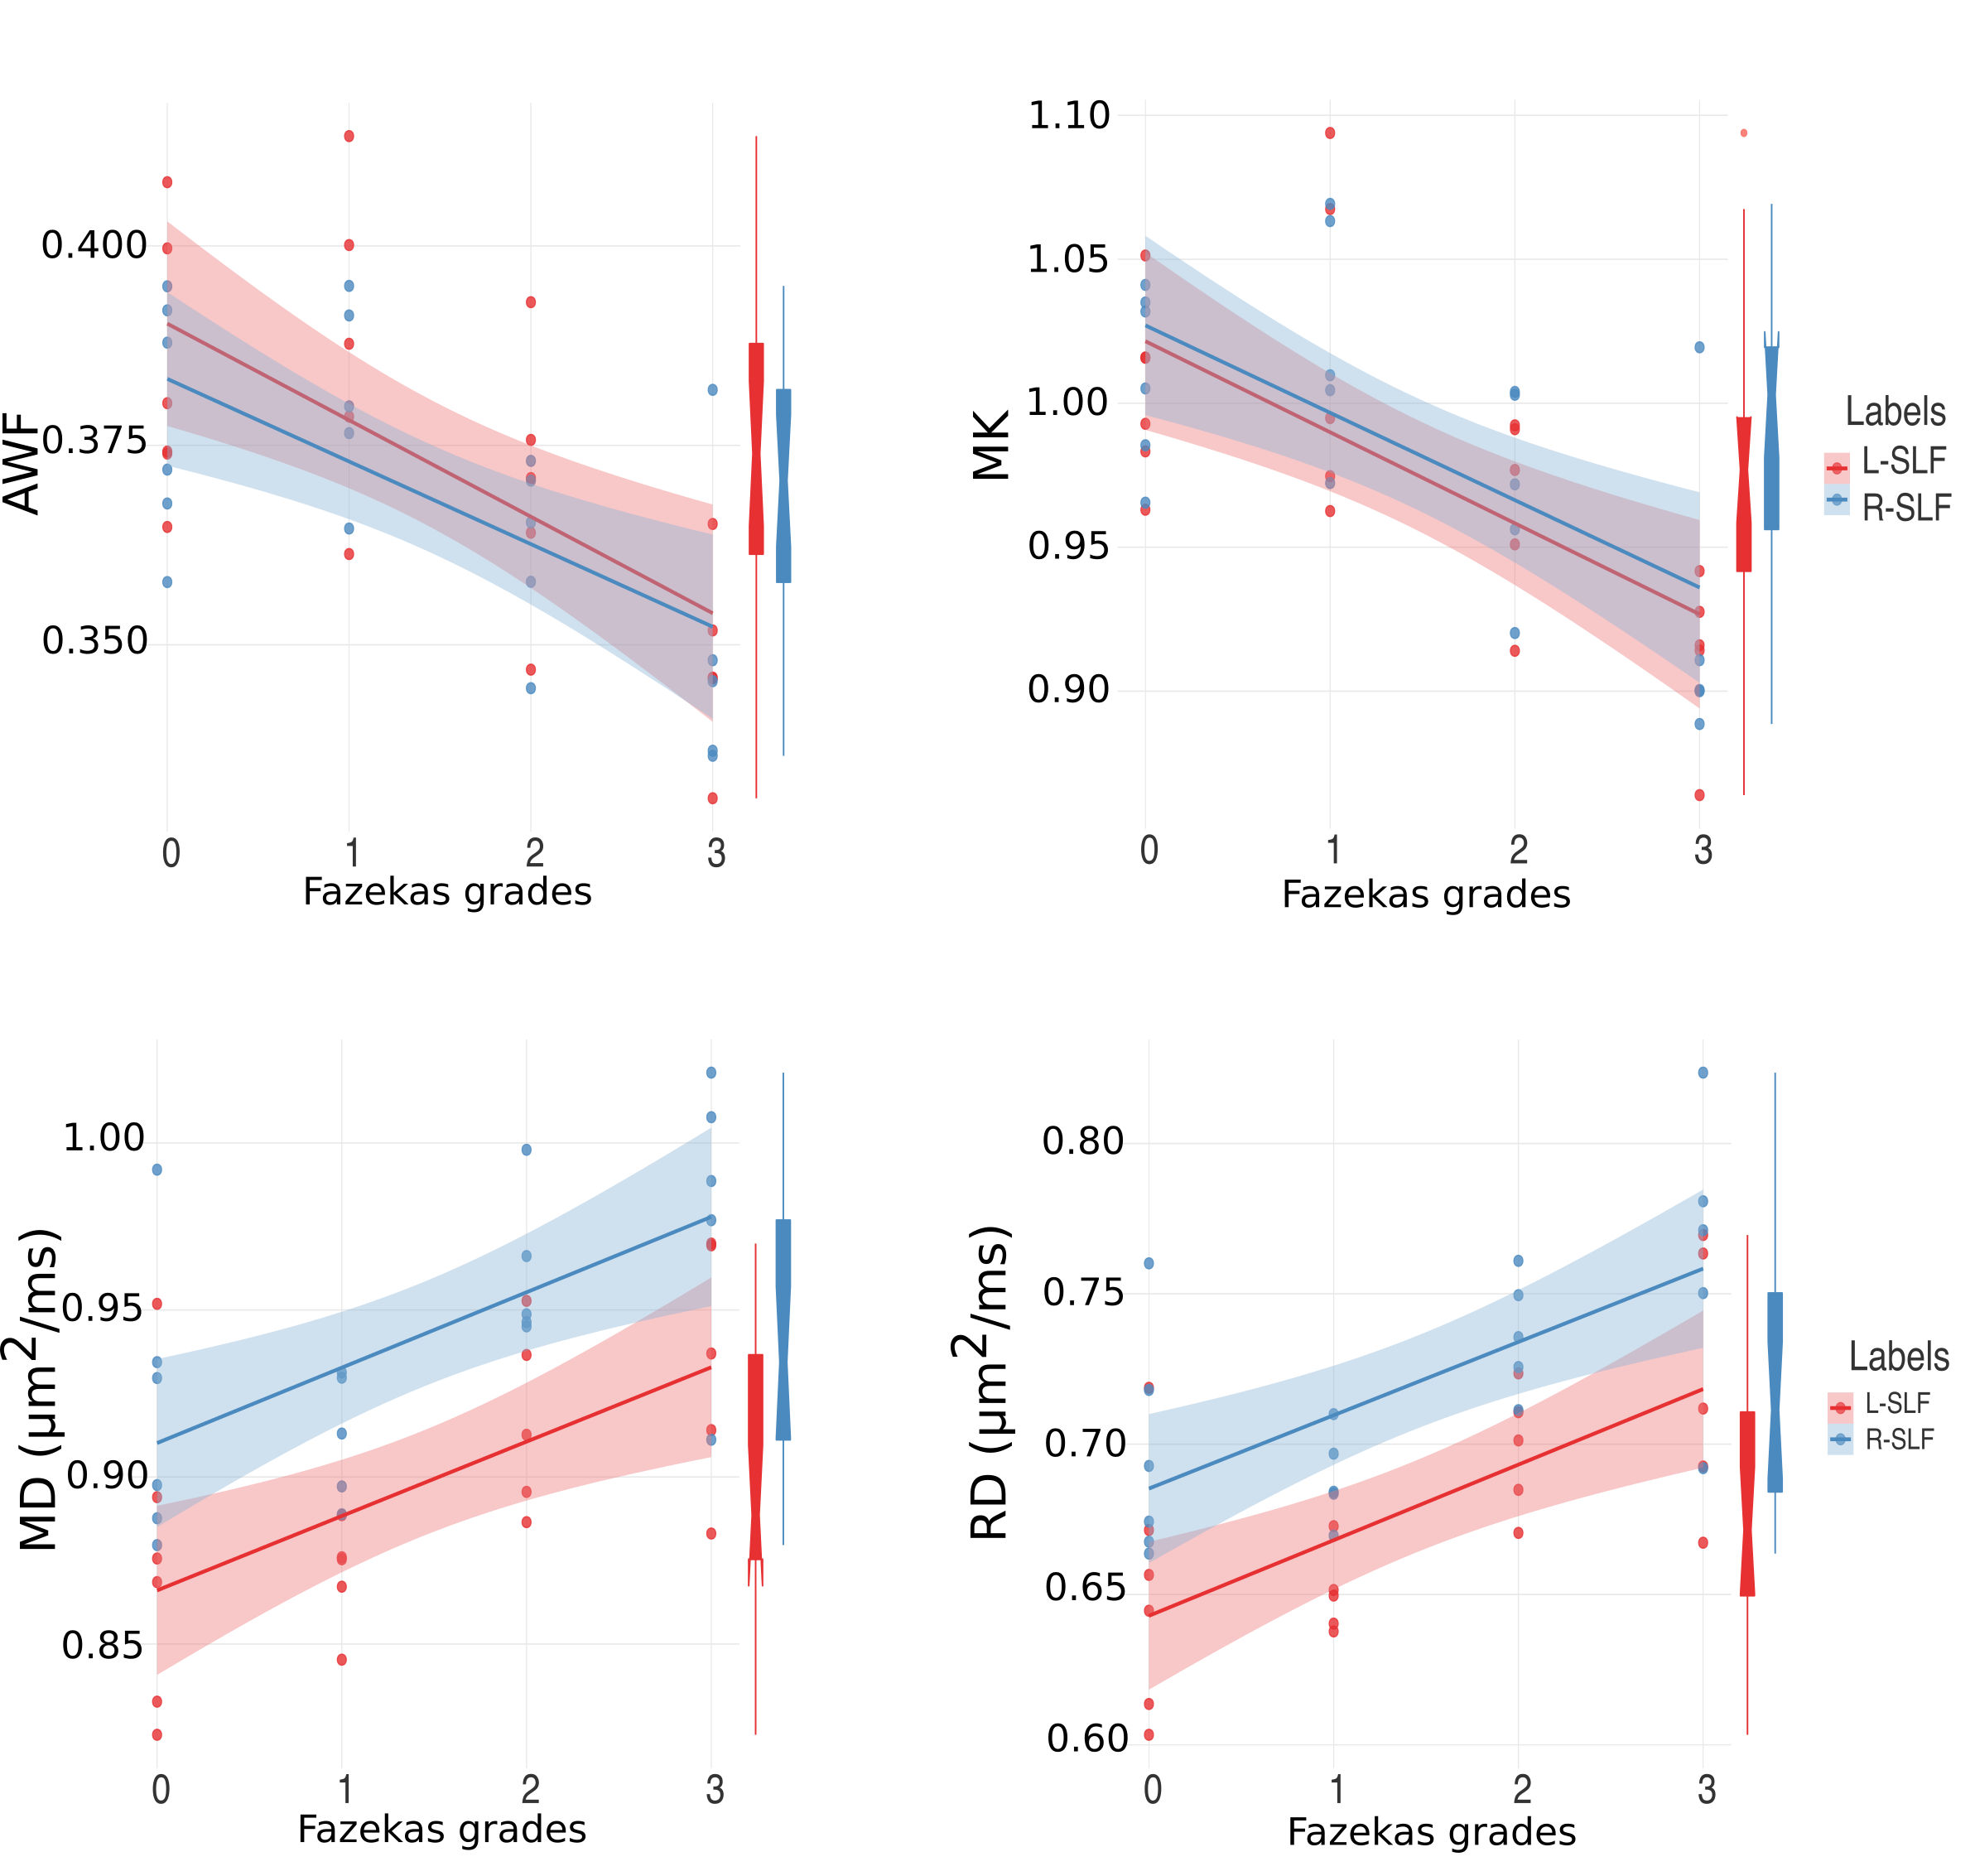
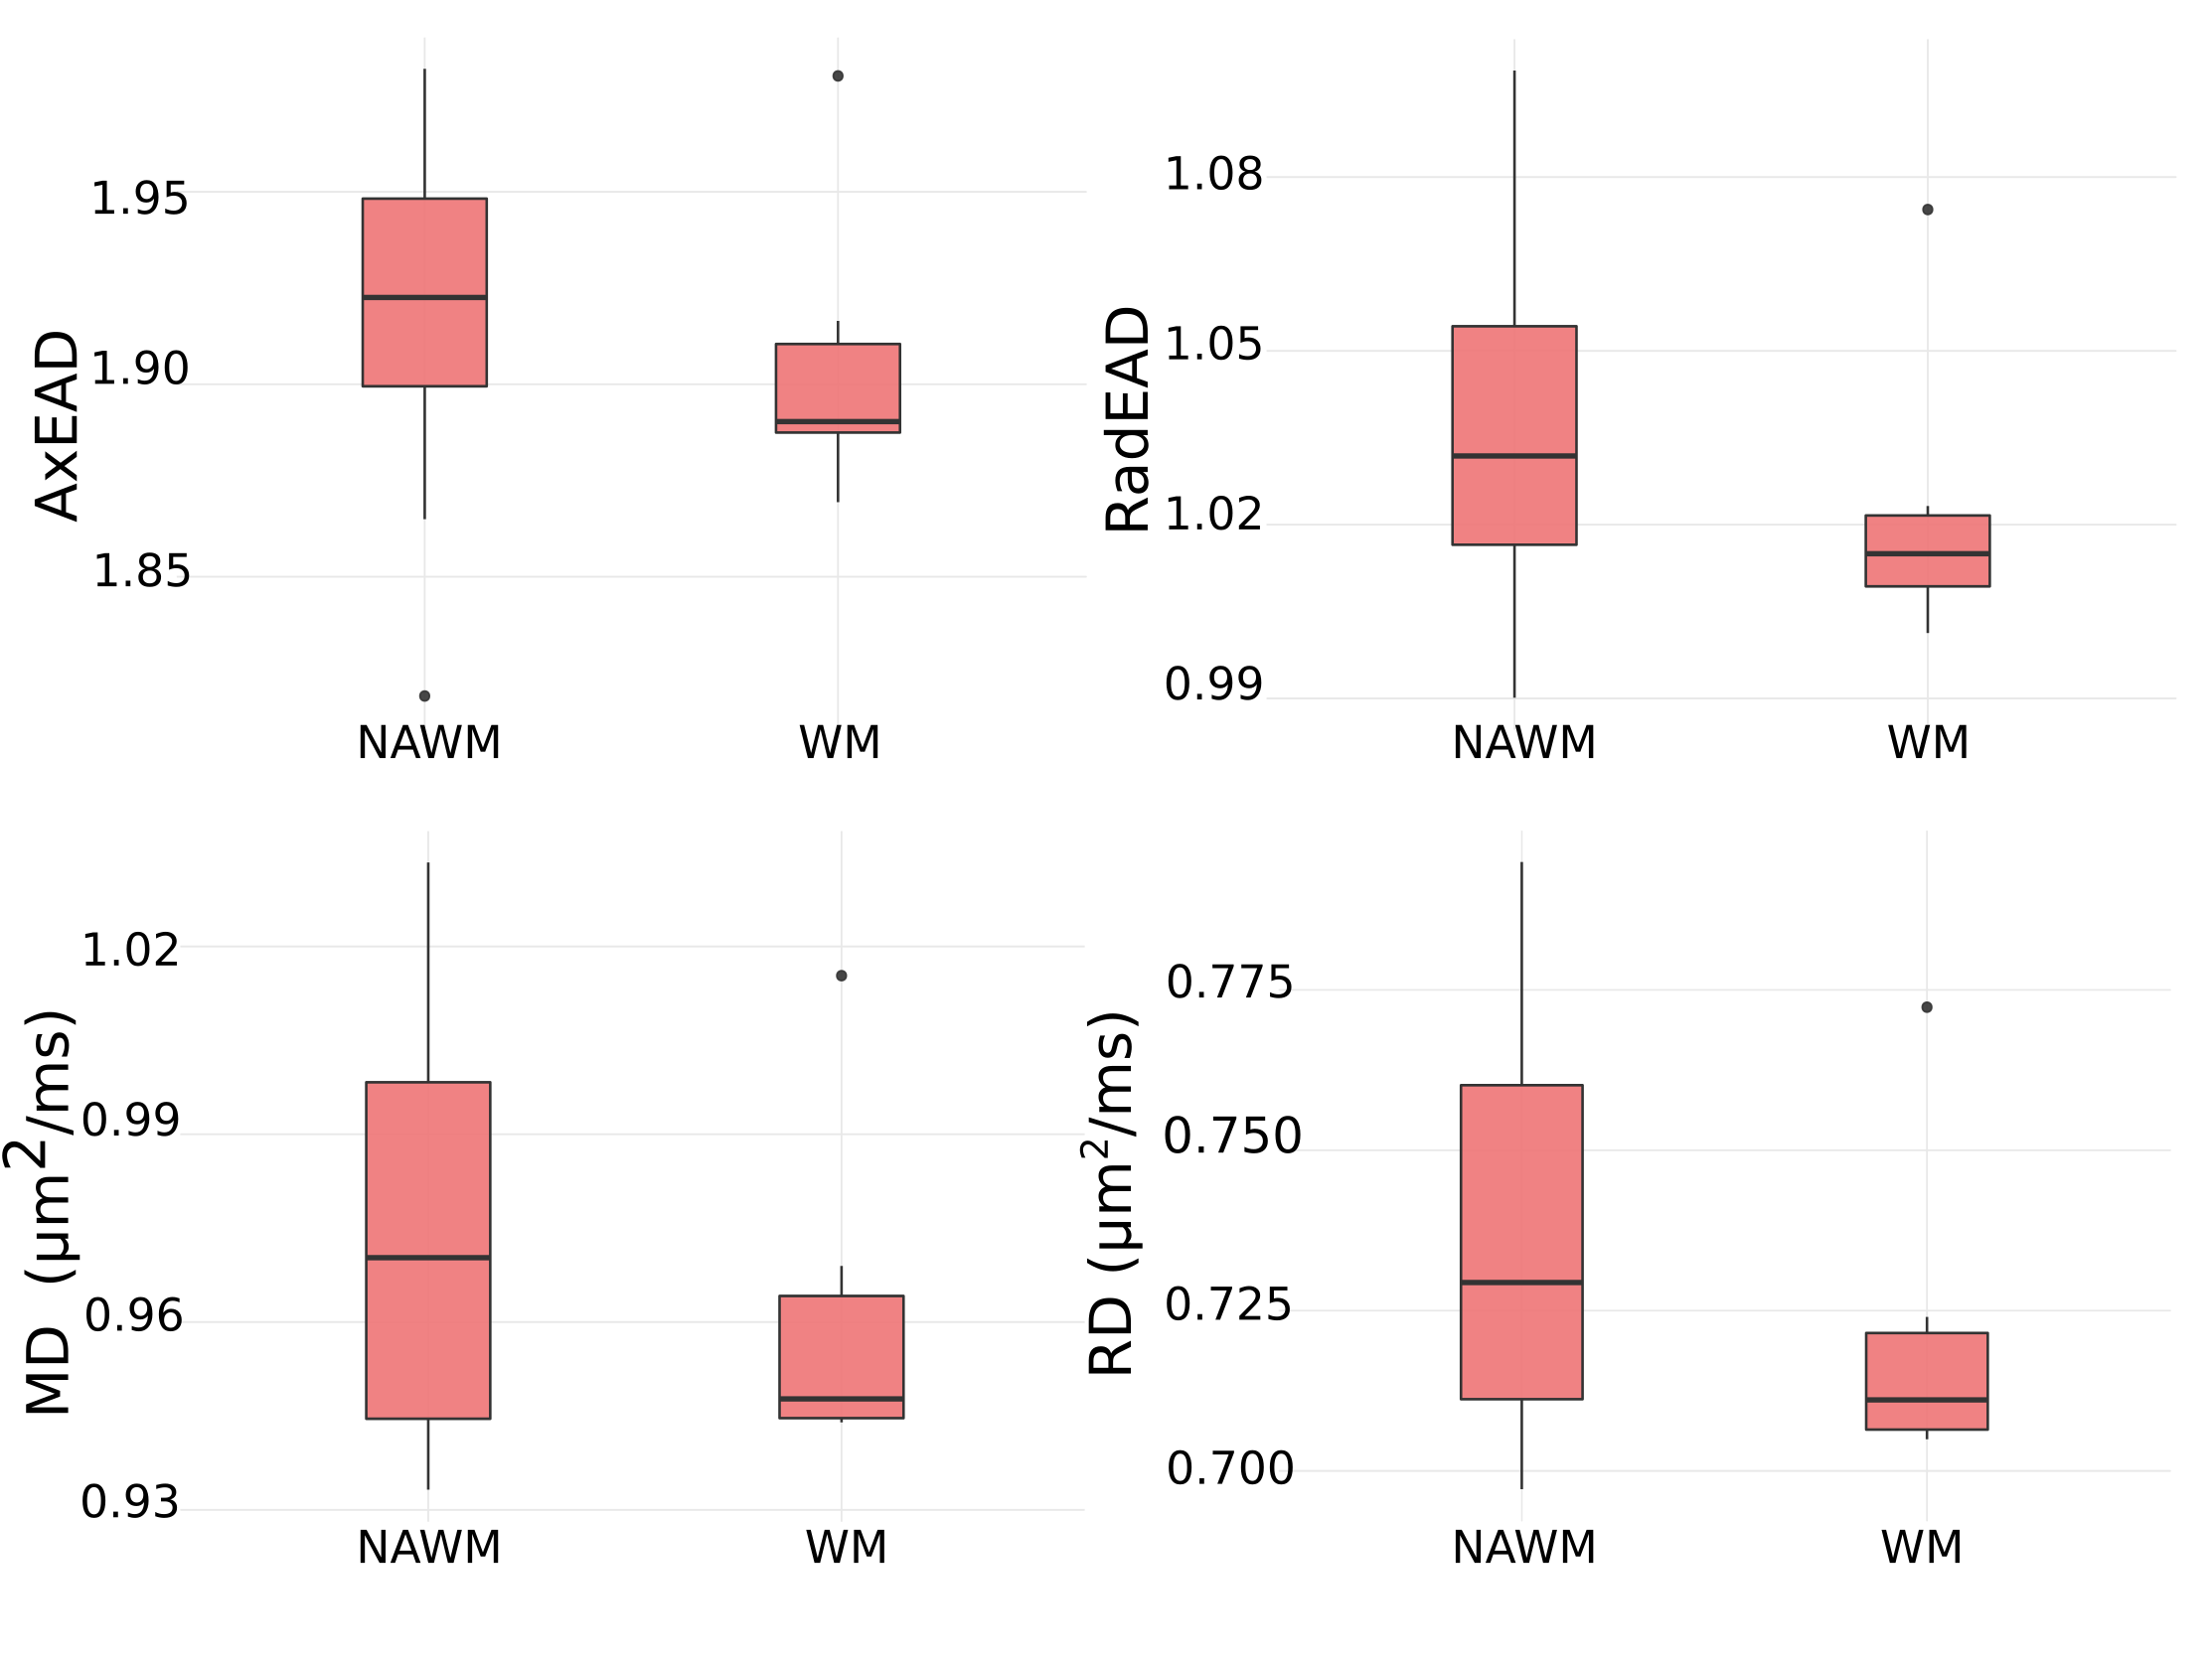
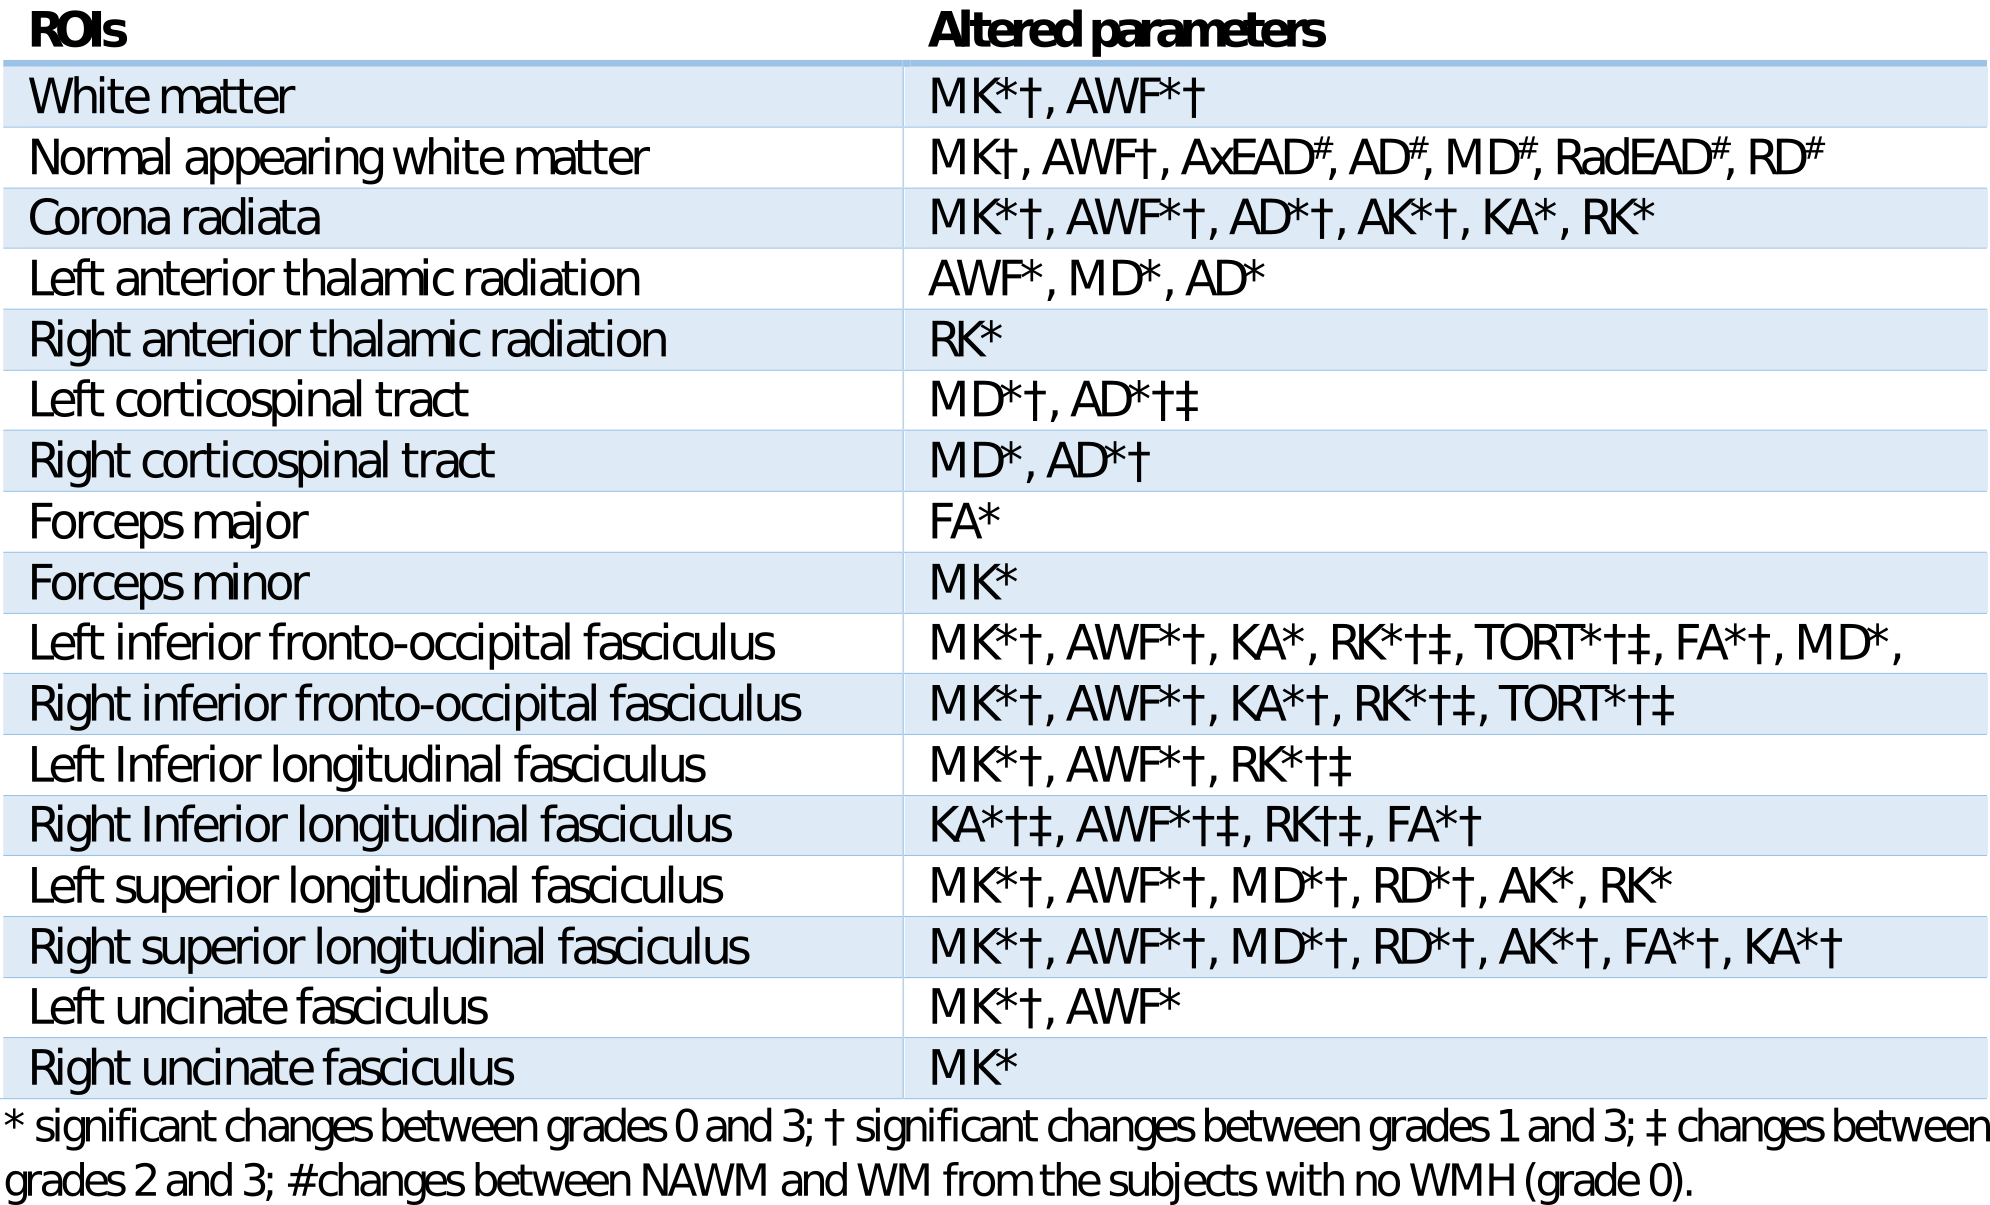
Most of the ROIs demonstrated changes in various diffusion metrices corresponding to increasing severity of disease (Table 1). Bilateral superior longitudinal and inferior fronto-occipital fasciculi and CR demonstrated changes in the most parameters. NAWM showed significant changes in MD, RD, L1, AxEAD, and RadEAD compared to WM from grade 0 (Figs. 1-2).Discussion
We show that various DKI metrics reflect the microstructural alterations in SVD. The more severe the pathology, the greater the changes in the DKI parameters. MK and AWF were most frequently affected, which indicates a higher sensitivity to the pathological changes. Increased MD, RD, AD and decreased FA might be indicative of either axonal loss, demyelination or both21. Higher AxEAD and RadEAD disentangle this issue and reflect increased fluid volume in the extracellular space, which might be caused by myelin loss, blood-brain barrier disruption or both, supporting previous histopathological studies with in vivo9,22 data. The decreased AWF and tortuosity might reflect a reduced number of axons, although these results should be interpreted cautiously as they could be obscured with changes in the myelin volume9.Conclusion
Our study is the first to investigate DKI and WMM parameters of WM structures in SVD and monitor their changes according to the severity of the pathology.Acknowledgements
The authors thank to the 1000BRAINS study scientists, especially Prof. Svenja Caspers, Prof. Susanne Moebus, Dr. Noreen Pundt and Nora Bittner.References
1. Debette, S., & Markus, H. S. (2010). The clinical importance of white matter hyperintensities on brain magnetic resonance imaging: systematic review and meta-analysis. Bmj; 341(jul26 1), c3666–c3666
2. Wardlaw, J. M., Valdés Hernández, M. C., & Muñoz-Maniega, S. (2015). What are white matter hyperintensities made of? Relevance to vascular cognitive impairment. Journal of the American Heart Association; 4(6), 1140
3. Gouw, A. A., Seewann, A., van der Flier, W. M., Barkhof, F., Rozemuller, A. M., Scheltens, P., & Geurts, J. J. G. (2011). Heterogeneity of small vessel disease: a systematic review of MRI and histopathology correlations. Journal of Neurology, Neurosurgery & Psychiatry; 82(2), 126–135
4. Fazekas, F., Kleinert, R., Offenbacher, H., Schmidt, R., Kleinert, G., Payer, F., … Lechner, H. (1993). Pathologic correlates of incidental MRI white matter signal hyperintensities. Neurology; 43(9), 1683–9
5. Rosenberg, G. A., Wallin, A., Wardlaw, J. M., Markus, H. S., Montaner, J., Wolfson, L., … Hachinski, V. (2016). Consensus statement for diagnosis of subcortical small vessel disease. Journal of Cerebral Blood Flow and Metabolism, 36(1), 6–25
6. Pasi, M., van Uden, I. W. M., Tuladhar, A. M., de Leeuw, F.-E., & Pantoni, L. (2016). White Matter Microstructural Damage on Diffusion Tensor Imaging in Cerebral Small Vessel Disease. Stroke, 47(6), 1679–1684
7. Jeurissen, B., Leemans, A., Tournier, J. D., Jones, D. K., & Sijbers, J. (2013). Investigating the prevalence of complex fiber configurations in white matter tissue with diffusion magnetic resonance imaging. Human Brain Mapping, 34(11), 2747–2766
8. Jensen, J. H., Helpern, J. A., Ramani, A., Lu, H., & Kaczynski, K. (2005). Diffusional Kurtosis Imaging: The Quantification of Non- Gaussian Water Diffusion by Means of Magnetic Resonance Imaging, 1440, 1432–1440
9. Fieremans, E., Jensen, J. H., & Helpern, J. A. (2011). White matter characterization with diffusional kurtosis imaging. NeuroImage, 58(1), 177–188
10. Caspers, S., Moebus, S., Lux, S., Pundt, N., Schütz, H., Mühleisen, T. W., … Amunts, K. (2014). Studying variability in human brain aging in a population-based German cohort-rationale and design of 1000BRAINS. Frontiers in Aging Neuroscience; 1–14
11. Manjón, J. V., Coupé, P., & Buades, A. (2015). MRI noise estimation and denoising using non-local PCA. Medical Image Analysis, 22(1), 35–47
12. Perrone D, Aelterman J, Pižurica A, Jeurissen B, Philips W, Leemans A. (2015). The effect of Gibbs ringing artifacts on measures derived from diffusion MRI. NeuroImage; 120:441–455
13. Leemans A, Jeurissen B, Sijbers J (2009). ExploreDTI: a graphical toolbox for processing, analyzing, and visualizing diffusion MR data. 17th Annual Meeting of Intl Soc Mag Reson Med, Hawaii, USA, p. 3537
14. Andersson, J. L. R., & Sotiropoulos, S. N. (2016). An integrated approach to correction for off-resonance effects and subject movement in diffusion MR imaging. NeuroImage, 125, 1063–1078
15. Gudbjartsson H, Patz S. (1995) The Rician distribution of noisy MRI data Magn Reson Med;34: 910–914
16. Fazekas, F., Chawluk, J. B., Alavi, A., Hurtig, H. I., & Zimmerman, R. A. (1987). Mr Signal Abnormalities At 1.5-T in Alzheimer Dementia and Normal Aging. American Journal of Roentgenology; 149(2), 351–356
17. Paul A. Yushkevich, Joseph Piven, Heather Cody Hazlett, Rachel Gimpel Smith, Sean Ho, James C. Gee, and Guido Gerig (2006). User-guided 3D active contour segmentation of anatomical structures: Significantly improved efficiency and reliability. Neuroimage; 31(3):1116-28
18. Jenkinson, M. & Smith, S. (2001). Global optimisation for robust affine registration. Med. Image Anal. 5, 143–156
19. Andersson JLR, Jenkinson M, Smith S (2010). Non-linear registration, aka spatial normalisation. FMRIB technical report TR07JA2
20. Ashburner, J., & Friston, K. J. (2005). Unified segmentation. NeuroImage, 26, 839851
21. Blair, G. W., Hernandez, M. V., Thrippleton, M. J., Doubal, F. N., & Wardlaw, J. M. (2017). Advanced Neuroimaging of Cerebral Small Vessel Disease. Current Treatment Options in Cardiovascular Medicine, 19(7)
22. Young, V. G., Halliday, G. M., & Kril, J. J. (2008). Neuropathologic correlates of white matter hyperintensities. Neurology, 71(11), 804–811
Figures