3239
In vivo MRI characterization of a mouse model of vanishing white matter disease1Discovery, Global Pharmaceutical Research and Development, Abbvie, North Chicago, IL, United States, 2Calico Life Sciences LLC, South San Francisco, CA, United States
Synopsis
Vanishing White Matter Disease (VWMD) is a rare genetic disorder characterized by white matter degeneration. Here we employed MRI to longitudinally characterize pathological changes in white matter with contrasts sensitive to pathology (T2W) and myelin integrity (MTR, DTI). Statistically significant difference were detected in T2W and MTR comparing wild-type and homozygous mice starting at 14 and 22 weeks of age, respectively. These differences between the wild-type and homozygous mice were observed before symptomatic behavioral changes, and became more prominent over the time. Correlations with immunohistochemistry markers provided underlying pathology corresponding to the observed imaging changes.
INTRODUCTION
Vanishing white matter disease (VWMD) is a fatal genetic leukoencephalopathy linked to mutations in one of the five subunits of the eukaryotic initiation factor 2B (eIF2B) [1]. VWMD predominantly affects the white matter in the brain and spinal cord and is characterized by axonal loss, demyelination and gliosis in subcortical white matter [2]. Developing a mouse model that reflects similar eIF2B genetic defects as seen in human is crucial to understand the neuropathology in an experimentally controlled environment. However, traditional methods to characterize disease pathological progression in mouse models are restricted to ex-vivo studies such as cross-sectional immunohistochemistry (IHC) [3]. In vivo longitudinal MRI allows for non-invasively monitoring disease progression in both spatial and temporal readouts, and ultimately, methodological translation to the clinic. The aim of this study was to quantitatively assess the evolution of VWMD progression and myelin pathology noninvasively.METHODS
Animal
All animal protocols were approved by Abbvie IACUC. Female and male wild-type (WT) and age-matched Eif2b5R191H/R191H homozygous (R191H, HO) mice were included in this study (n = 10 per genotype/gender). Imaging started at approximately six weeks of age as baseline.
In Vivo MRI
In vivo MRI was performed on a 4.7 Tesla Bruker PharmaScan 47/16 system (Bruker, MA) with 72mm 1H Quadrature and 10 mm loop coil as transmitter-receiver. Mice were anesthetized with isoflurane (2-2.5%) in an oxygen-air mixture (1:1 ratio). T2-Weighted (T2W, RARE sequence, TE/TR=65/3500ms, RARE Factor=8, Averages=12), magnetization transfer ratio (MTR, RARE sequence, TE/TR=24/5000ms, RARE Factor=4, Averages=2, saturation pulse at 15μT RF peak amplitude and +2000.0 Hz offset frequency) and diffusion tensor imaging (DTI, respiratory gated multi-shot EPI-SE sequence, number of section=4, single b-value of 800 s/mm2, 30 isotropically-distributed directions, TE/TE=26/2500ms, δ/Δ=5/9.5ms) images were acquired with same geometry and spatial resolution at 117x117 µm2 in-plane, 1 mm slice thickness, 10 slices. T2W signal intensity in the corpus callosum (manual ROI) was normalized to signal intensity in cortical regions (manual ROI, CC/cortex) and is referred to as T2 ratio. Regional analysis focused in the caudal CC, and ROIs applied to all imaging matrix derived from T2W, MTR and DTI. Voxel-based analysis was performed with affine registration in FSL and voxel based statistics in SPM to detect potential brain regions that exhibit genotype differences in T2W ratio at 14, 22 and 30 weeks of age.
RESULTS
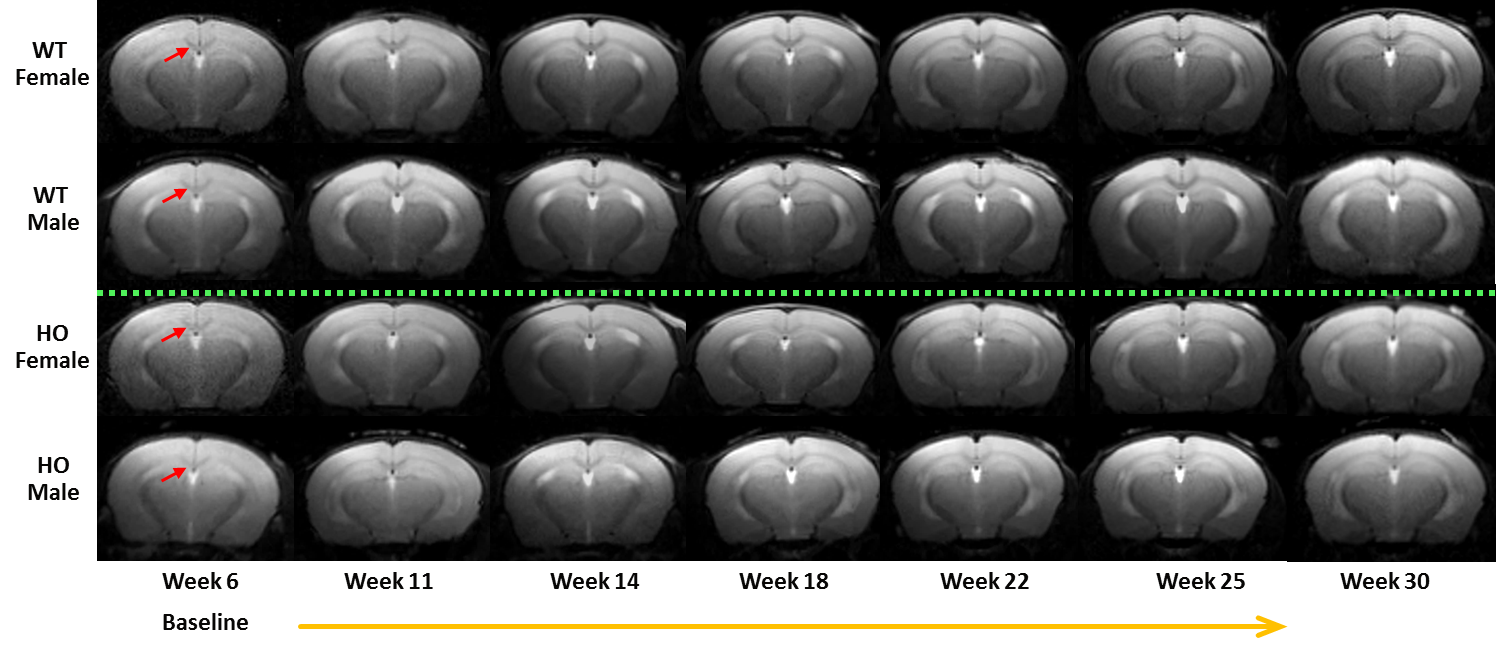
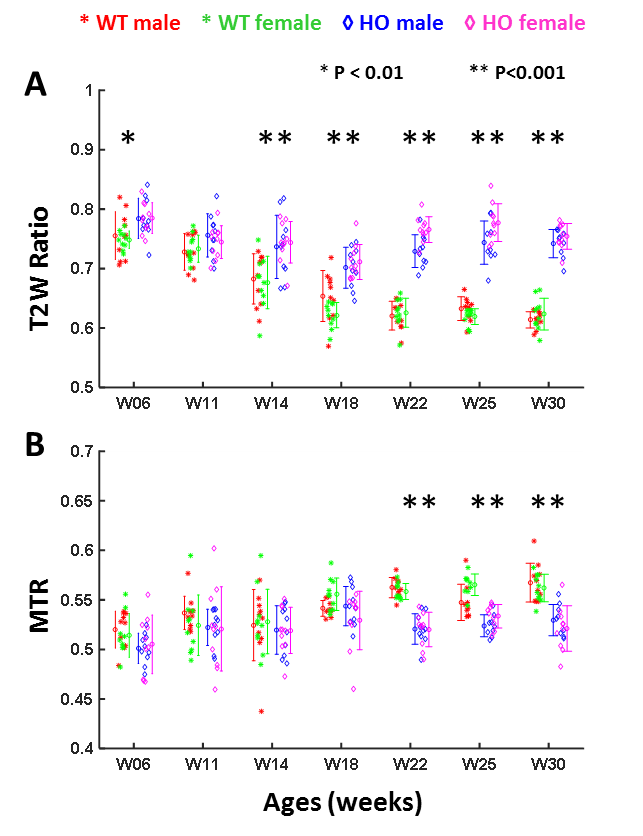
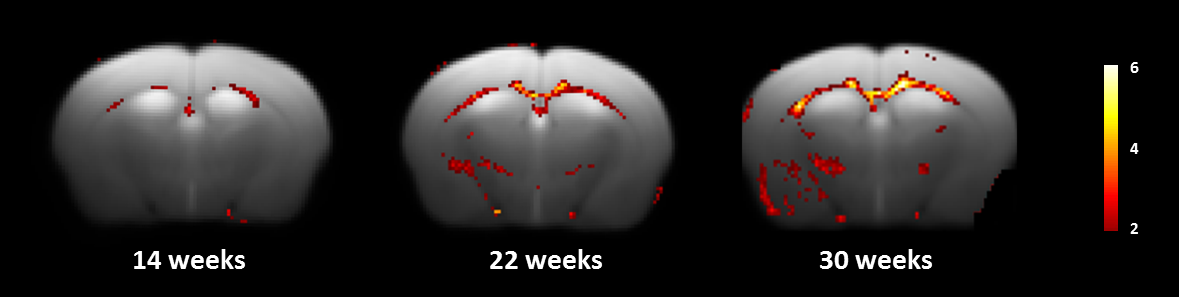
T2W MRI T2W ratios in HOs were significantly higher compared to WT mice at age of week 14 to 30. (Figure-1) The differences between WT and HO mice were smaller at earlier time points and became more prominent over the time. (Figure-2A) Probability maps derived from voxel-based analysis of the whole brain highlights regions where genotype differences were observed at a level of t > 2, without multiple comparison correction. Genotype differences in T2W ratio (t>2) were observed in major white matter regions such as the corpus callosum, external and internal capsules, cerebral peduncles, fornix, medial lemniscus, and other regions in midbrain and pons. From 14 to 30 weeks of age, areas with significant differences expanded mostly involving white matter. (Figure-3)
MTR There was a slight trend of an increase in MTR from 6 to 18 weeks of ages in both WT and HO mice. While the increase continued in WT mice from week 18 to 22, it reversed in HO mice. A significant decrease in MTR compared to WT mice was detected in HOs starting at 22 weeks of age. These differences persisted for the rest of the study duration (up to 30 weeks). (Figure-2B)DTI No significant differences in any
DTI derived parameters (FA, MD, AD, RD) were detected between WT and HO mice at all time points.
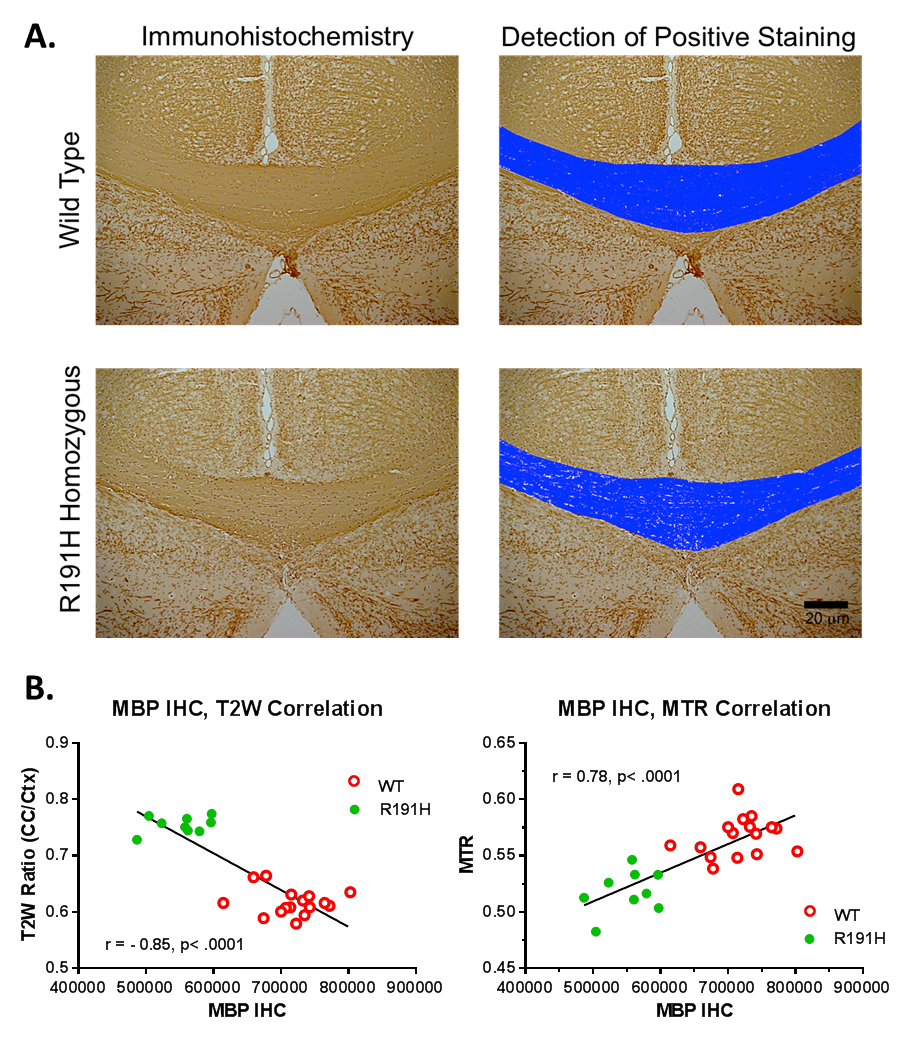
Histology Myelin basic protein (MBP) staining showed a 23% white matter loss in HO mice at 30 weeks of age (Figure-4A). There was no difference in myelin loss between HO males and females. Thinning of corpus callosum was observed in some male HO mice.
Imaging/IHC Correlations Strong correlations (Pearson) were found between MBP staining and T2W ratio (r = -0.85, p<0.0001), as well as between MBP and MTR (r = 0.78, p<0.0001). (Figure-4B)
CONCLUSION
We demonstrated that longitudinal in vivo MRI measures (T2W and MTR) are sensitive to the white matter development and pathological changes in a mouse model of leukodystrophy. An increase in T2 and a decrease in MTR in the white matter of HO mice suggest pathological modifications consistent with gliosis and myelin loss. Longitudinal T2 and MTR changes indicate progressive myelin loss in HO mice which was confirmed histologically.Acknowledgements
The authors would like to thank Dr. Nick van Bruggen for his scientific insight and experience for the imaging work. We thank Dr. Yan Sun for his statistical support and David P. Blanchard for designing a mouse brain cradle for minimizing the motion artifacts.References
1. Hamilton EMC, van der Lei HDW, Vermeulen G, Gerver JAM, Lourenco CM, Naidu S, et al. Natural History of Vanishing White Matter. Ann Neurol. 2018;84(2):274-88. Epub 2018/07/18. doi: 10.1002/ana.25287. PubMed PMID: 30014503.
2. Wong YL, LeBon L, Edalji R, Lim HB, Sun C, Sidrauski C. The small molecule ISRIB rescues the stability and activity of Vanishing White Matter Disease eIF2B mutant complexes. Elife. 2018;7. Epub 2018/03/01. doi: 10.7554/eLife.32733. PubMed PMID: 29489452; PubMed Central PMCID: PMCPMC5829914.
3. Geva M, Cabilly Y, Assaf Y, Mindroul N, Marom L, Raini G, et al. A mouse model for eukaryotic translation initiation factor 2B-leucodystrophy reveals abnormal development of brain white matter. Brain. 2010;133(Pt 8):2448-61. Epub 2010/09/10. doi: 10.1093/brain/awq180. PubMed PMID: 20826436.
Figures