3238
Postnatal Ocular Development in Normal and Visually Impaired Rats using in vivo Multi-Modal MRIMalack Hamade1, Hassan Hamade1, Swarupa Kancherla2, and Kevin C. Chan1,3
1Department of Ophthalmology, New York University School of Medicine, New York, NY, United States, 2Department of Ophthalmology, University of Pittsburgh School of Medicine, Pittsburgh, PA, United States, 3Department of Radiology, New York University School of Medicine, New York, NY, United States
Synopsis
Ocular development is a complex process yet limited tools are currently available for non-invasive and longitudinal studies of the whole eye while minimizing biovariability. Using 7-Tesla MRI, we showed the growth characteristics of the anterior chamber and posterior chamber, the lens and the vitreous humor of rats from postnatal day 1 to 60 and compared the development of these three compartments between normal and impaired states. We conclude that MRI is an effective tool in characterizing normal and abnormal postnatal ocular growth over time before and after eyelid opening.
Introduction
Ocular development is a complex process that may be disrupted by various stressors and disease processes. To date, limited tools are currently available for non-invasive and longitudinal studies of the whole eye of the same subjects while minimizing biovariability. Using 7-Tesla MRI, we determine the growth characteristics of various ocular components during normal development (ND), and the effects of neonatal unilateral hypoxic-ischemic encephalopathy (HIE), monocular deprivation (MD) and monocular enucleation (ME) on postnatal eye growth in rats.Methods
T2-weighted anatomical MRI was used to investigate the development of the anterior and posterior chambers (ACPC), the lens, and the vitreous humor (VH) in 7 ND Sprague-Dawley rats at postnatal day (P) 1, 5, 10, 15, 21, 28 and 60. The volumes of the three ocular compartments were measured using ImageJ, and the volumetric growth curves were then produced for each compartment using quadratic regression models. To induce HIE in rats, 7 rats underwent ligation of the left common carotid artery followed by hypoxia for 2 hours at P7 and were compared to ND rats when both were at P60 using ANOVA testing followed by post-hoc multiple comparisons correction tests. MD was achieved by suturing the left eyelids of 6 rats after eyelid opening at about P15, whereas ME was performed to the right eyes of 5 rats at P1, leaving the left eyes intact. MD and ME rats were compared to another group of 8 ND rats at P45. Lastly, T1-weighted MRI was used to compare left eyes, which were injected with potassium dichromate (K2Cr2O7 ) for contrast-enhancement, with uninjected and non-contrast enhanced right eyes in a separate batch of ND rats at (P) 1, 7 and 14. Retinal area and signal intensity, which was normalized to surrounding muscules, were compared between the enhanced and non-enhanced eyes at each postnatal time point.Results
Qualitatively, the lens, vitreous, retina and hyaloid vessels are visible during early postnatal development and can be seen as early as P1before eyelid opening at P15, whereas neither the anterior nor posterior chamber can be appreciated in T2-weighted MRI at this time (Figure 1). In subsequent imaging for P5-P60, the ACPC begins to develop, becoming more apparent whereas the hyaloid vessels begin to regress, eventually disappearing (Figures 1-2). Quantitatively, normal rat eyes followed a quadratic growth curve of Y=0.26+0.15X+1.58x10^-3X^2 for ACPC, Y=3.97+0.54X-2.71x10^-3X^2 for lens and Y=6.53+0.86X-4.21x10^-3X^2 for VH respectively, where Y is volume in mm3, and X is postnatal day (Figure 3). Development of ACPC volume appears to be greatest between P21 to P28 whereas development of the lens and VH volumes appears to be greatest between P1-P10. Unilateral neonatal HIE significantly decreased the volumes of ACPC, lens and VH in the same hemisphere of the lesion and significantly decreased the lens volume in the opposite hemisphere (Figure 4). MD significantly decreased the ACPC, lens and VH volumes compared to ND, whereas the remaining eye after ME showed reduced VH volume compared to ND (Figure 4). Normalized signal intensity in retina is shown to be statistically greater in chromium-enhanced eyes when compared to the non-enhanced eye at P1, P7, P10 (Figure 5). Retinal size also increased signfiicantly in both chromium-injected and uninjected eyes of ND rats at P 1, P7, or P10 (Figure 5).Conclusion
High-field MRI allows for non-invasive qualitative and quantitative characterizations of early postnatal ocular growth during ND, HIE, ME and MD before and after eyelid opening. Chromium-enhanced MRI may provide additional understanding of the mechanisms of lipid metabolism in the retina during postnatal ocular development given that chromium (Cr) can stabilize lipid fractions in the retina and is suggested to enhance oxidizable lipids in brain MRI. Overall, MRI-based ocular biometry may prove to be useful for characterizing normal and abnormal postnatal ocular growth over time before and after eyelid opening.Acknowledgements
This work was supported in part by the National Institutes of Health R01-EY028125 (Bethesda, Maryland); BrightFocus Foundation G2013077 and G2016030 (Clarksburg, Maryland); and Research to Prevent Blindness/Stavros Niarchos Foundation International Research Collaborators Award (New York, New York).References
No reference found.Figures
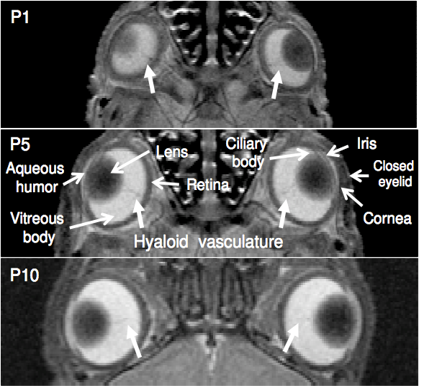
In
vivo magnetic resonance microscopy allowed delineation of ocular structures
non-invasively before eyelid opening.
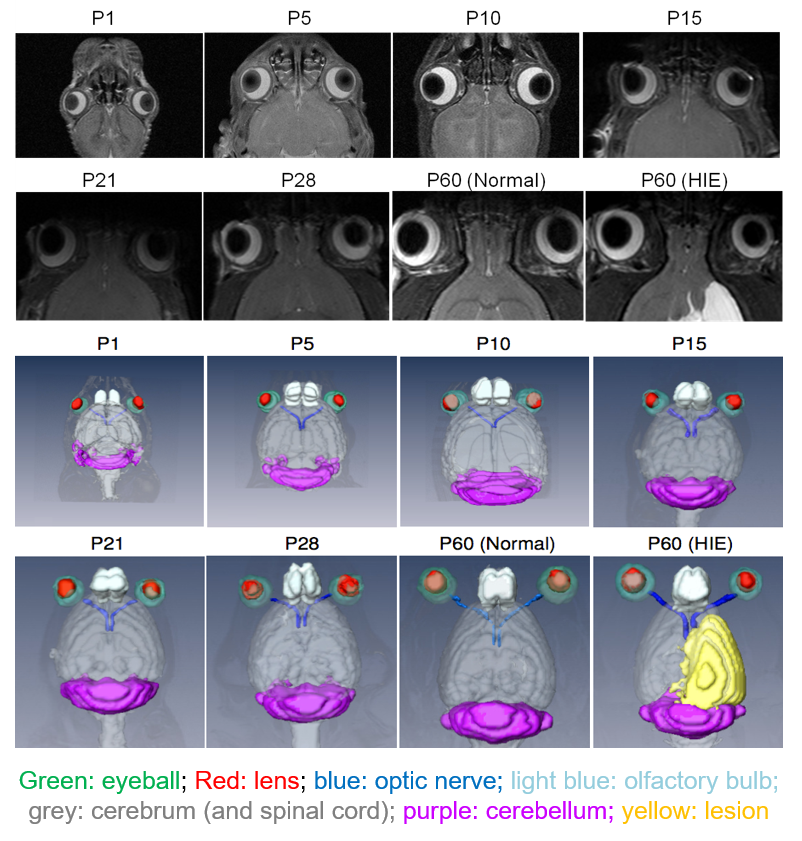
In vivo magnetic resonance microscopy of
postnatal ocular development from postnatal day (P) 1 to 60 with and without
hypoxic-ischemic encephalopathy (HIE).
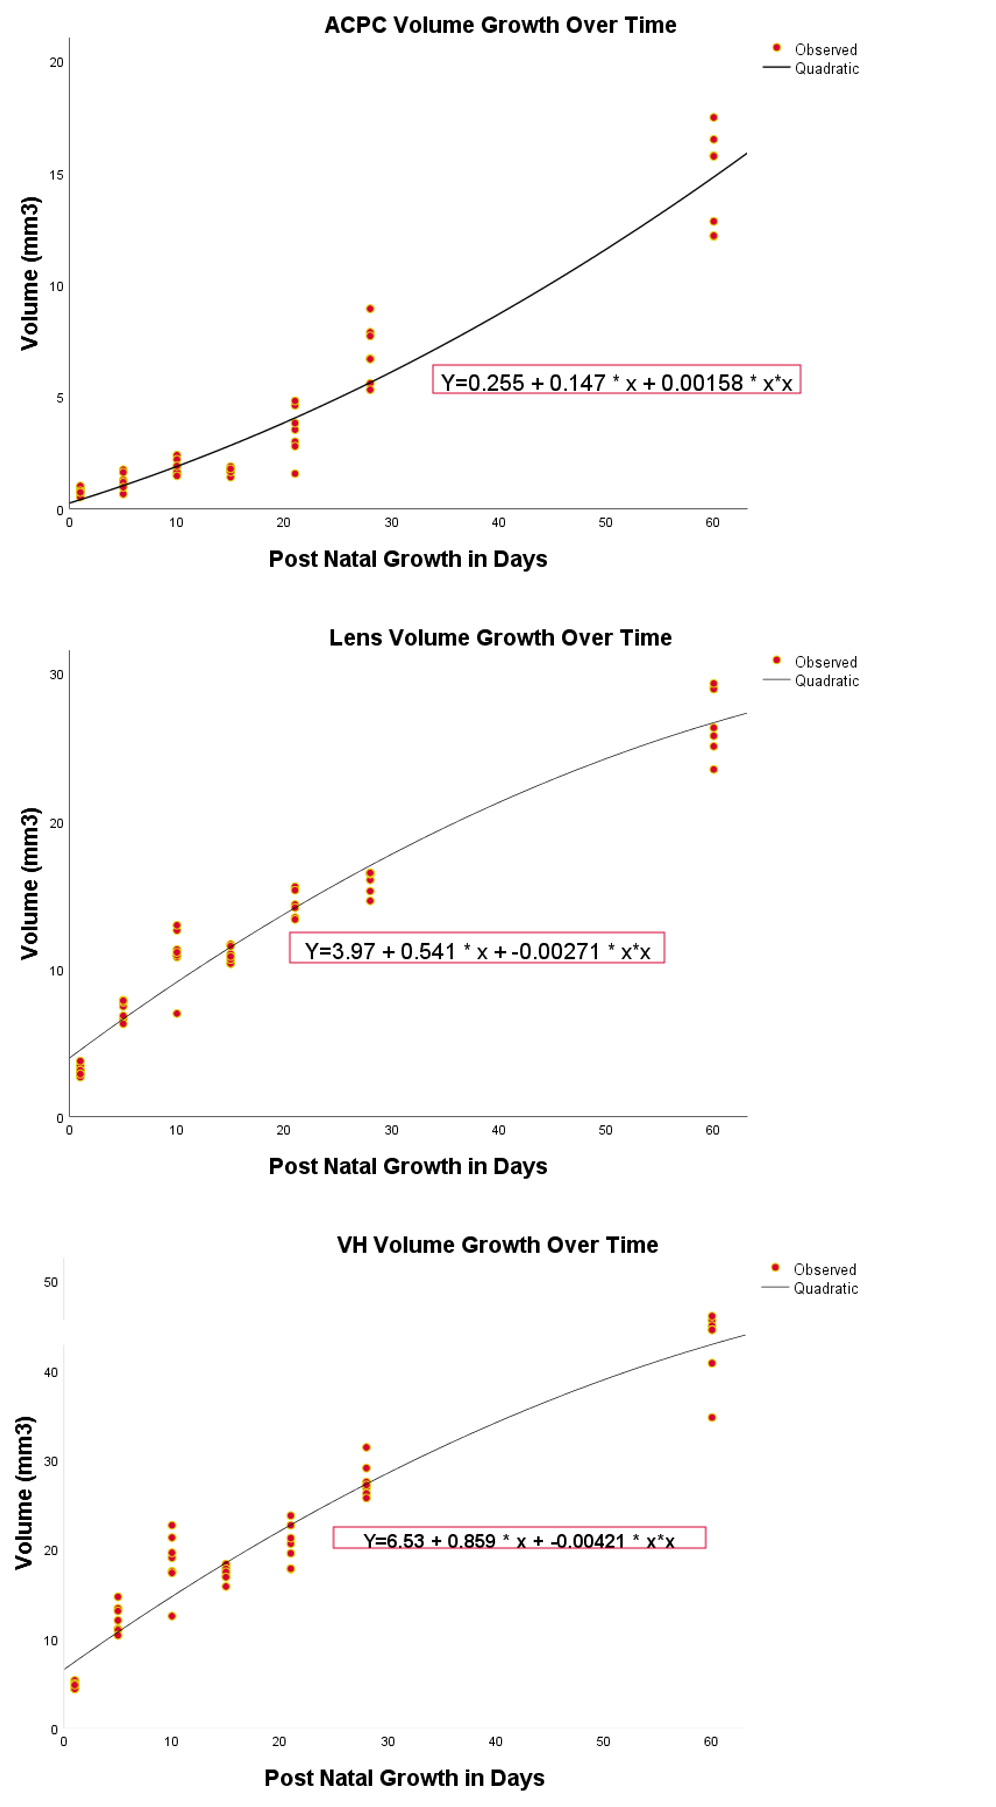
Growth
curves depicting volumetric change in Anterior and Posterior Chambers (ACPC), Lens and Vitreous Humor (VH) from P1 to P60. Using quadratic regression
modeling, the following equations were generated for ACPC, Lens and VH
respectively: Y=0.255+0.147X+0.00158X2, Y=3.97+0.541X+0.00271X2,
and Y=6.53 +0.859X +0.00421X2 where X denotes time in days and Y
denotes volume measured in mm3.
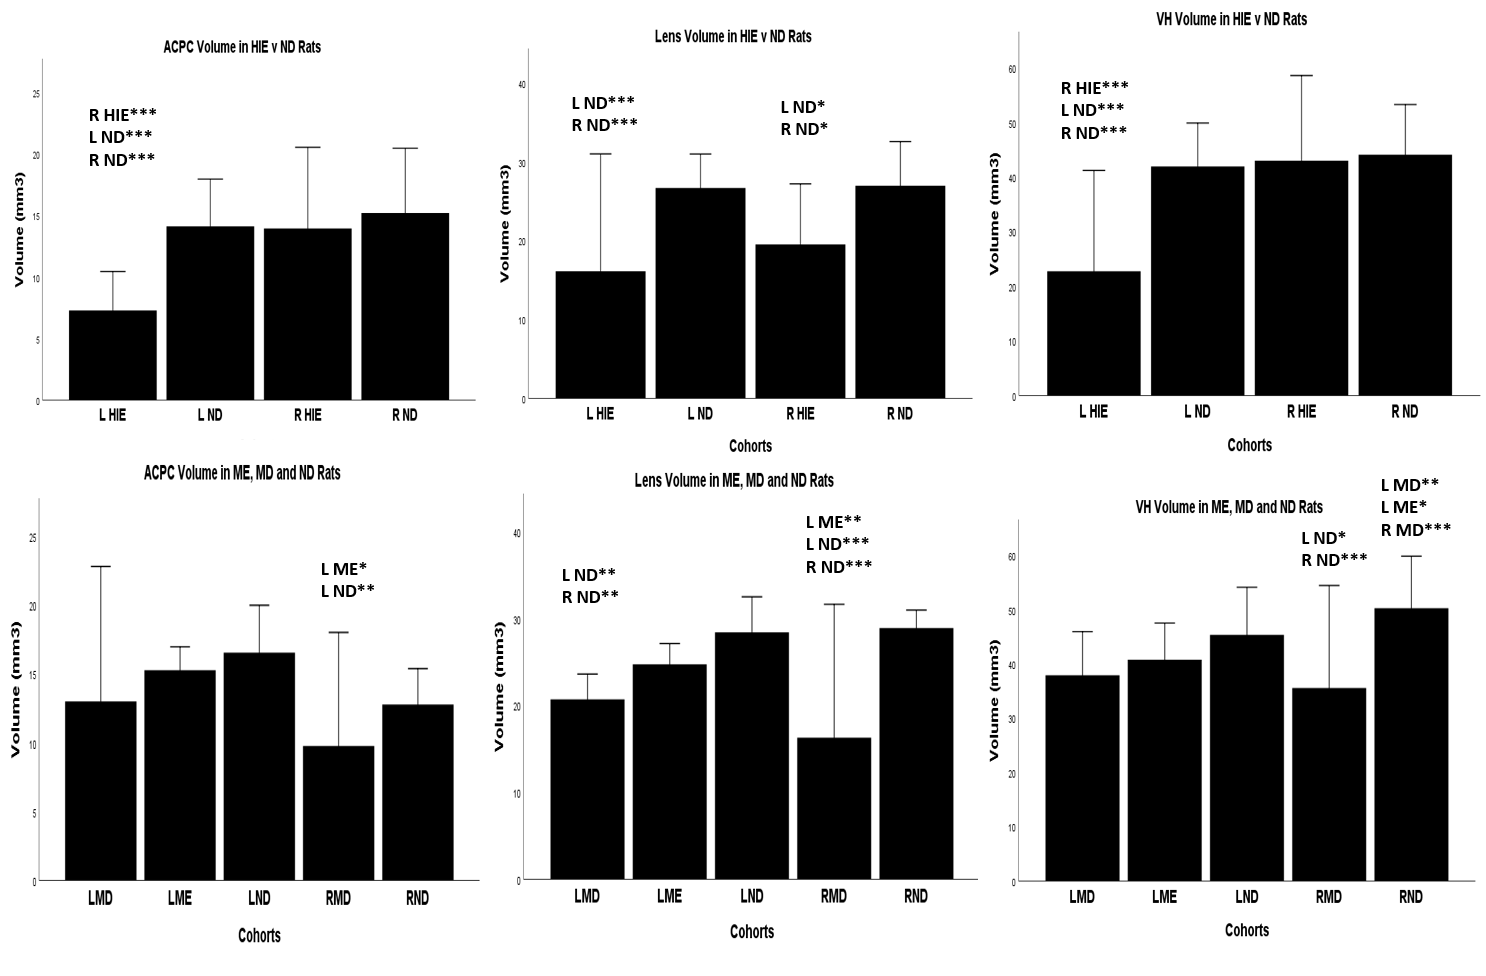
(Top
row) Volume of the ACPC, lens and VH in HIE and normally developing (ND) rats at P60. (Bottom row) Volume of the ACPC, lens and VH in monocularly
deprived (MD), monocularly enculeated (ME) and ND rats at P45. Data are
presented as mean±standard deviation. *p<0.05, **p<0.01 and ***p<0.001
for post-hoc multiple comparison correction tests between the group underneath
with other groups in left (L) or right (R) eyes.
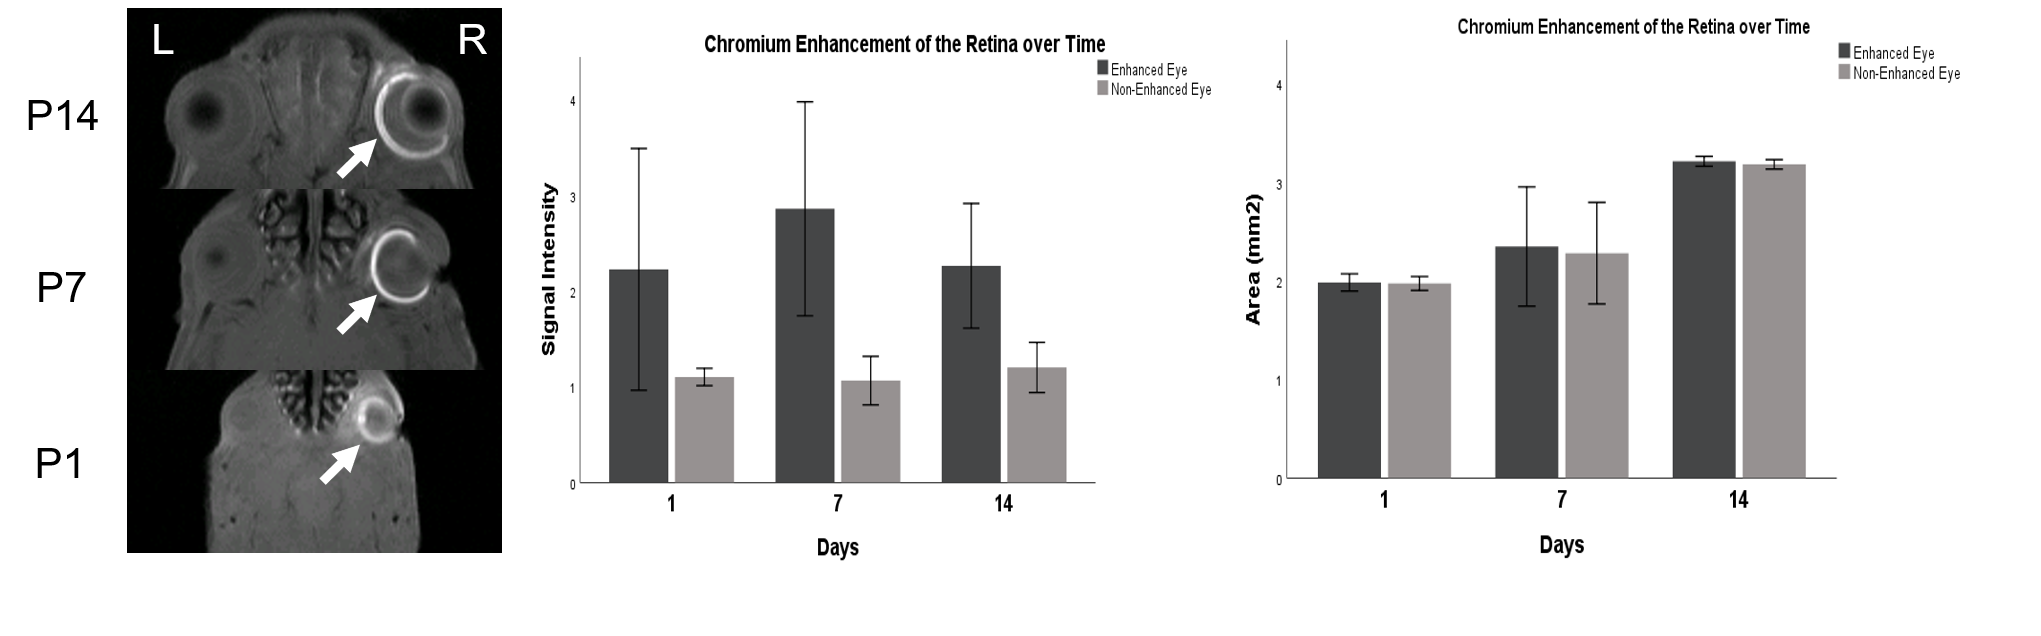
(Left)
Chromium-enhanced MRI of the retina (arrows) after intravitreal chromium
injection to the right eyes of normally developing P1, 7 and 14 rats. (Center
and Right) Chromium-enhanced (with intravitreal injection; arrows) vs
non-enhanced (without intravitreal injection) retinal signal intensity (Center)
and area measurements (Right) in ND rats at P1, P7 and P14.