3236
Automatic Measurement of Infarct Volume and Prediction by Pial Collaterals in Experimental Acute Ischemic Stroke1Northwestern University, Evanton, IL, United States, 2University of Chicago, Chicago, IL, United States, 3Illinois Institute of Technology, Chicago, IL, United States, 4University of Illinois at Chicago College of Medicine, Chicago, IL, United States
Synopsis
Tissue
infarct due to major vessel occlusion depends on the compromised blood flow and
the time since onset. Compromised blood flow may be sustained by recruitment of
pial collateral vessels. In this study, the extent of pial collateral
recruitment was used to predict infarct volume in an experimental middle
cerebral artery occlusion animal model with and without norepinephrine and
hydralazine. An automatic method of infarct volume measurement was developed to
minimize user variability and time. The automatically calculated infarct
volumes were highly correlated to manually measured volumes, and pial
collaterals were predictive of infarct volume.
Introduction
In acute ischemic stroke due to major vessel occlusion, the ability to determine tissue that is still viable to treat and reverse the damage is critical in clinical outcome. The degree of tissue infarct is known to depend on the compromised blood flow and the time since onset1. In patients with prolonged occlusion of the middle cerebral artery, the final infarct volume was found to vary depending on the degree of the pial collateral blood supply2,3. A better understanding of infarct growth, and the relationship it may have with pial collateral recruitment may lead to better management of patients. Therefore, we develop a method to automatically calculate infarct volumes and predict them using pial collateral scores (PCS) in a controlled canine model.Methods
The experimental model in this study was approved by the University of Chicago Institutional Animal Care and Use Committee. A total of 16 mongrel dogs (20-30 kg) underwent permanent endovascular occlusion of the M1 segment of the middle cerebral artery4. Six of the 16 cases were from a retrospective dataset with manually calculated infarct volumes up to 24 hours. Ten cases were prospectively studied up to 4 hours after occlusion, of which 6 were treated with norepinephrine and hydralazine. Anesthesia was maintained using isoflurane, propofol and rocuronium throughout the experiments. The extent of pial collateral blood vessel recruitment was determined by examining arteriography images and by giving a score based on an established 11-point system5.
Diffusion weighted images (DWI) were acquired to develop an automatic method of infarct volume measurements by segmenting out the canine brain and then applying a level-set threshold based on apparent diffusion coefficient (ADC). The brain was segmented out by going through four steps: 1) a threshold of 0.2 coefficient of variation along the diffusion gradient directions was applied; 2) the biggest contiguous mask in 3 dimensions was selected; 3) only regions that overlapped with the largest contiguous area were selected; and 4) lastly, masks were dilated to fill in gaps and eroded back. Using the brain mask and ADC map, the best ADC threshold of 0.57 x 10⁻³ s/mm2 was found by lowest sum of squared errors compared to manually calculated infarct volumes of the retrospective dataset. The infarct volumes of the prospective dataset were automatically calculated.
A nonlinear asymptotic model of infarct growth was fit and parameterized as a function of PCS4 using the retrospective dataset. The model was:
$$V(t) = (A1*PCS+B1)*(1-exp(-(A2*PCS+B2)*t)) (Eq. 1)$$
where V(t) is the infarct volume as a function of time, and A1, B1, A2 and B2 are fitted coefficients (-2472.7, 34297, -0.0013, 0.0179, respectively). This model was then used to predict infarct volumes of the prospective dataset.
Results
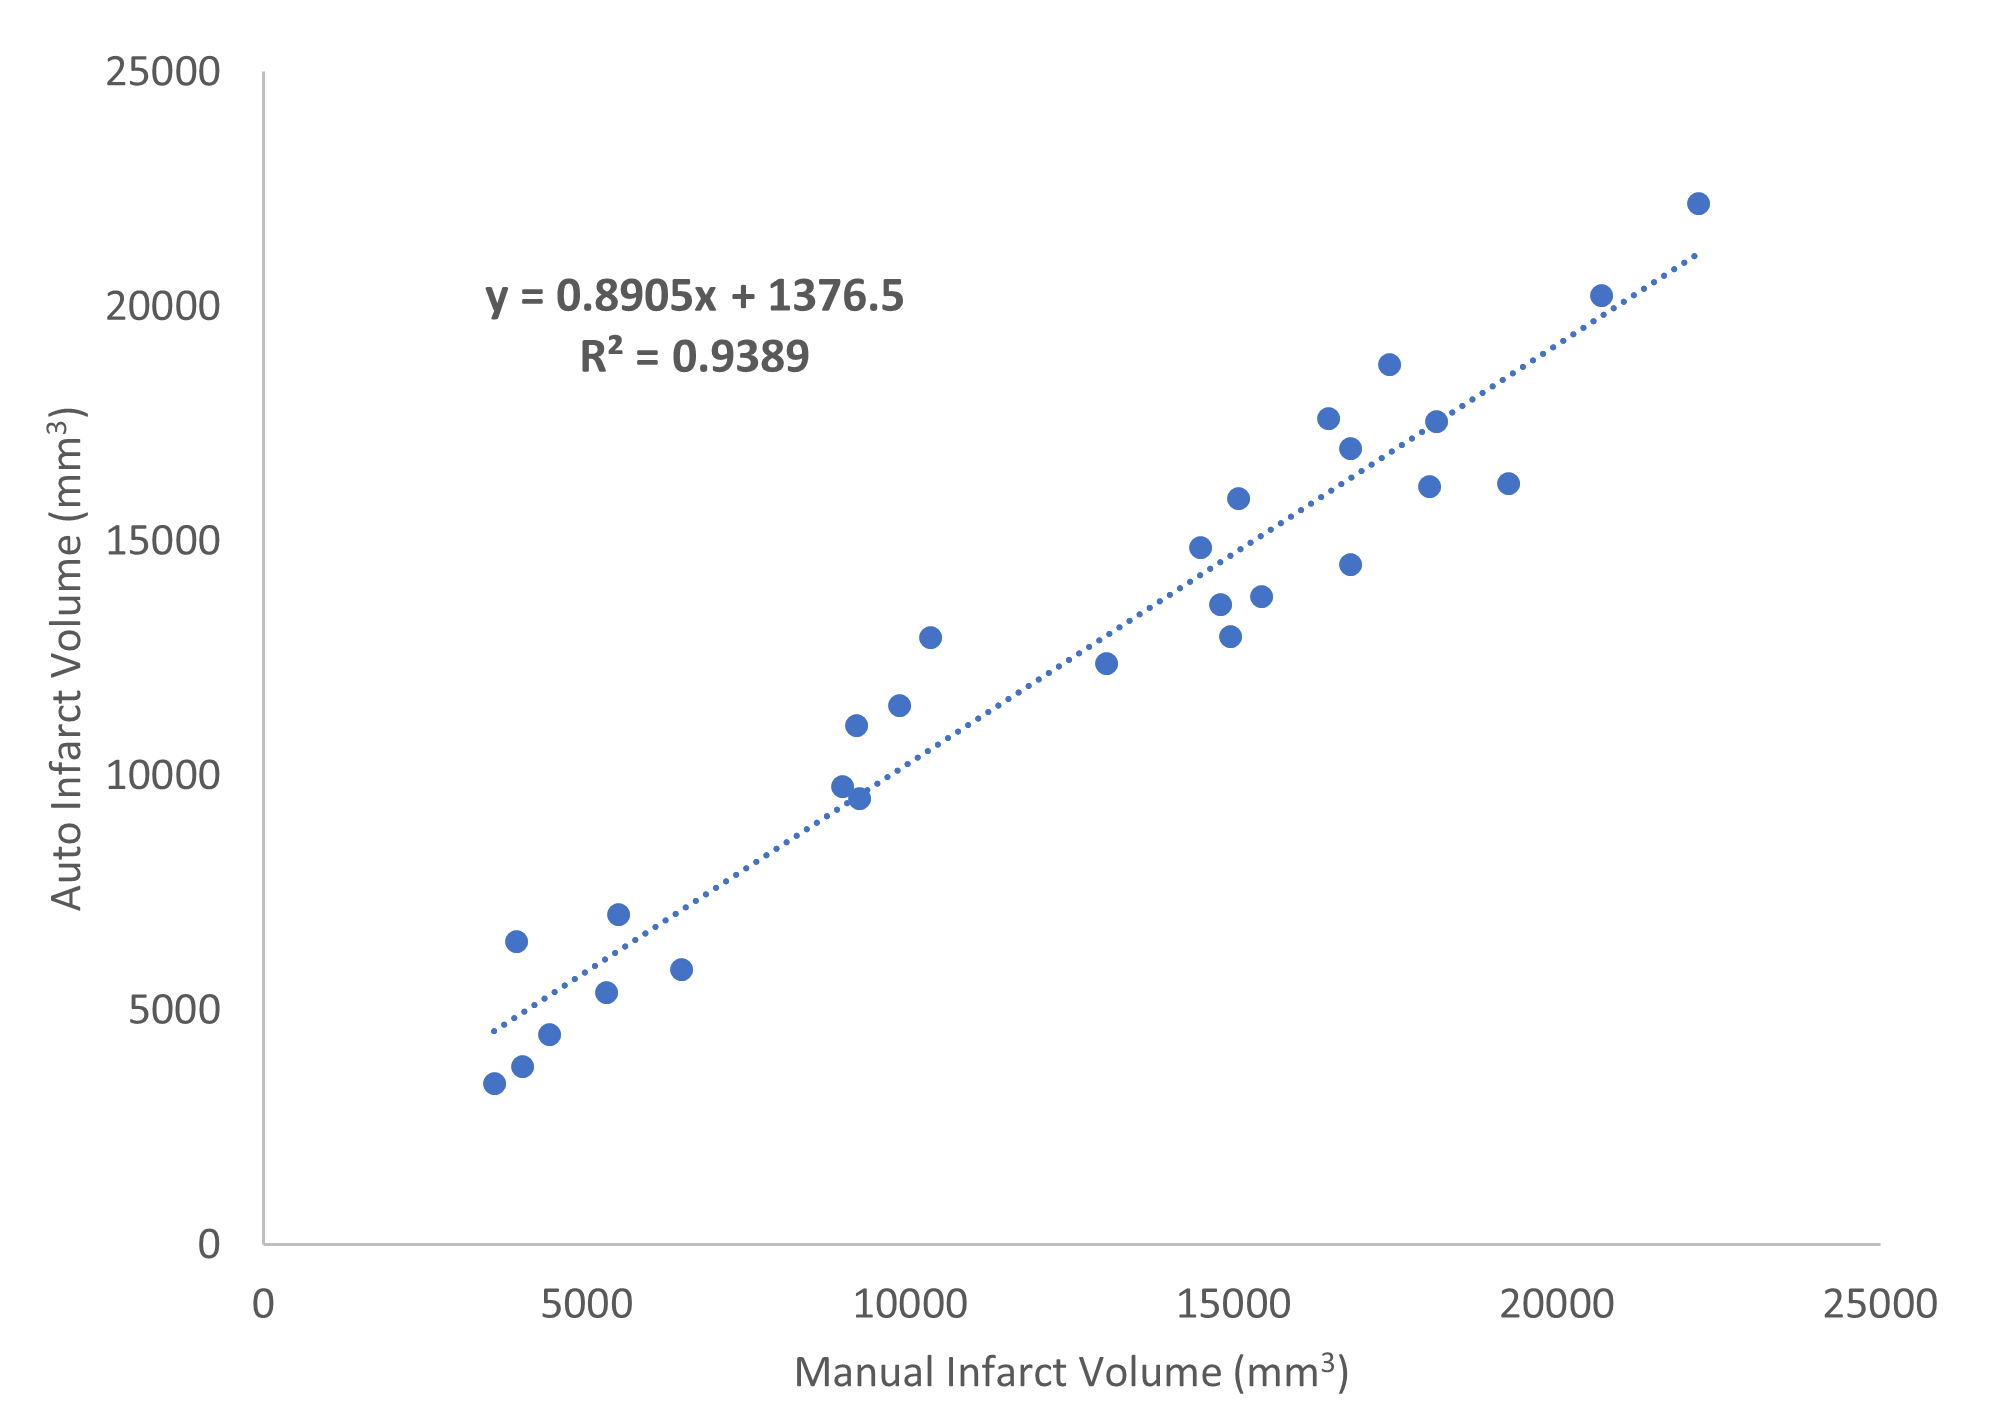
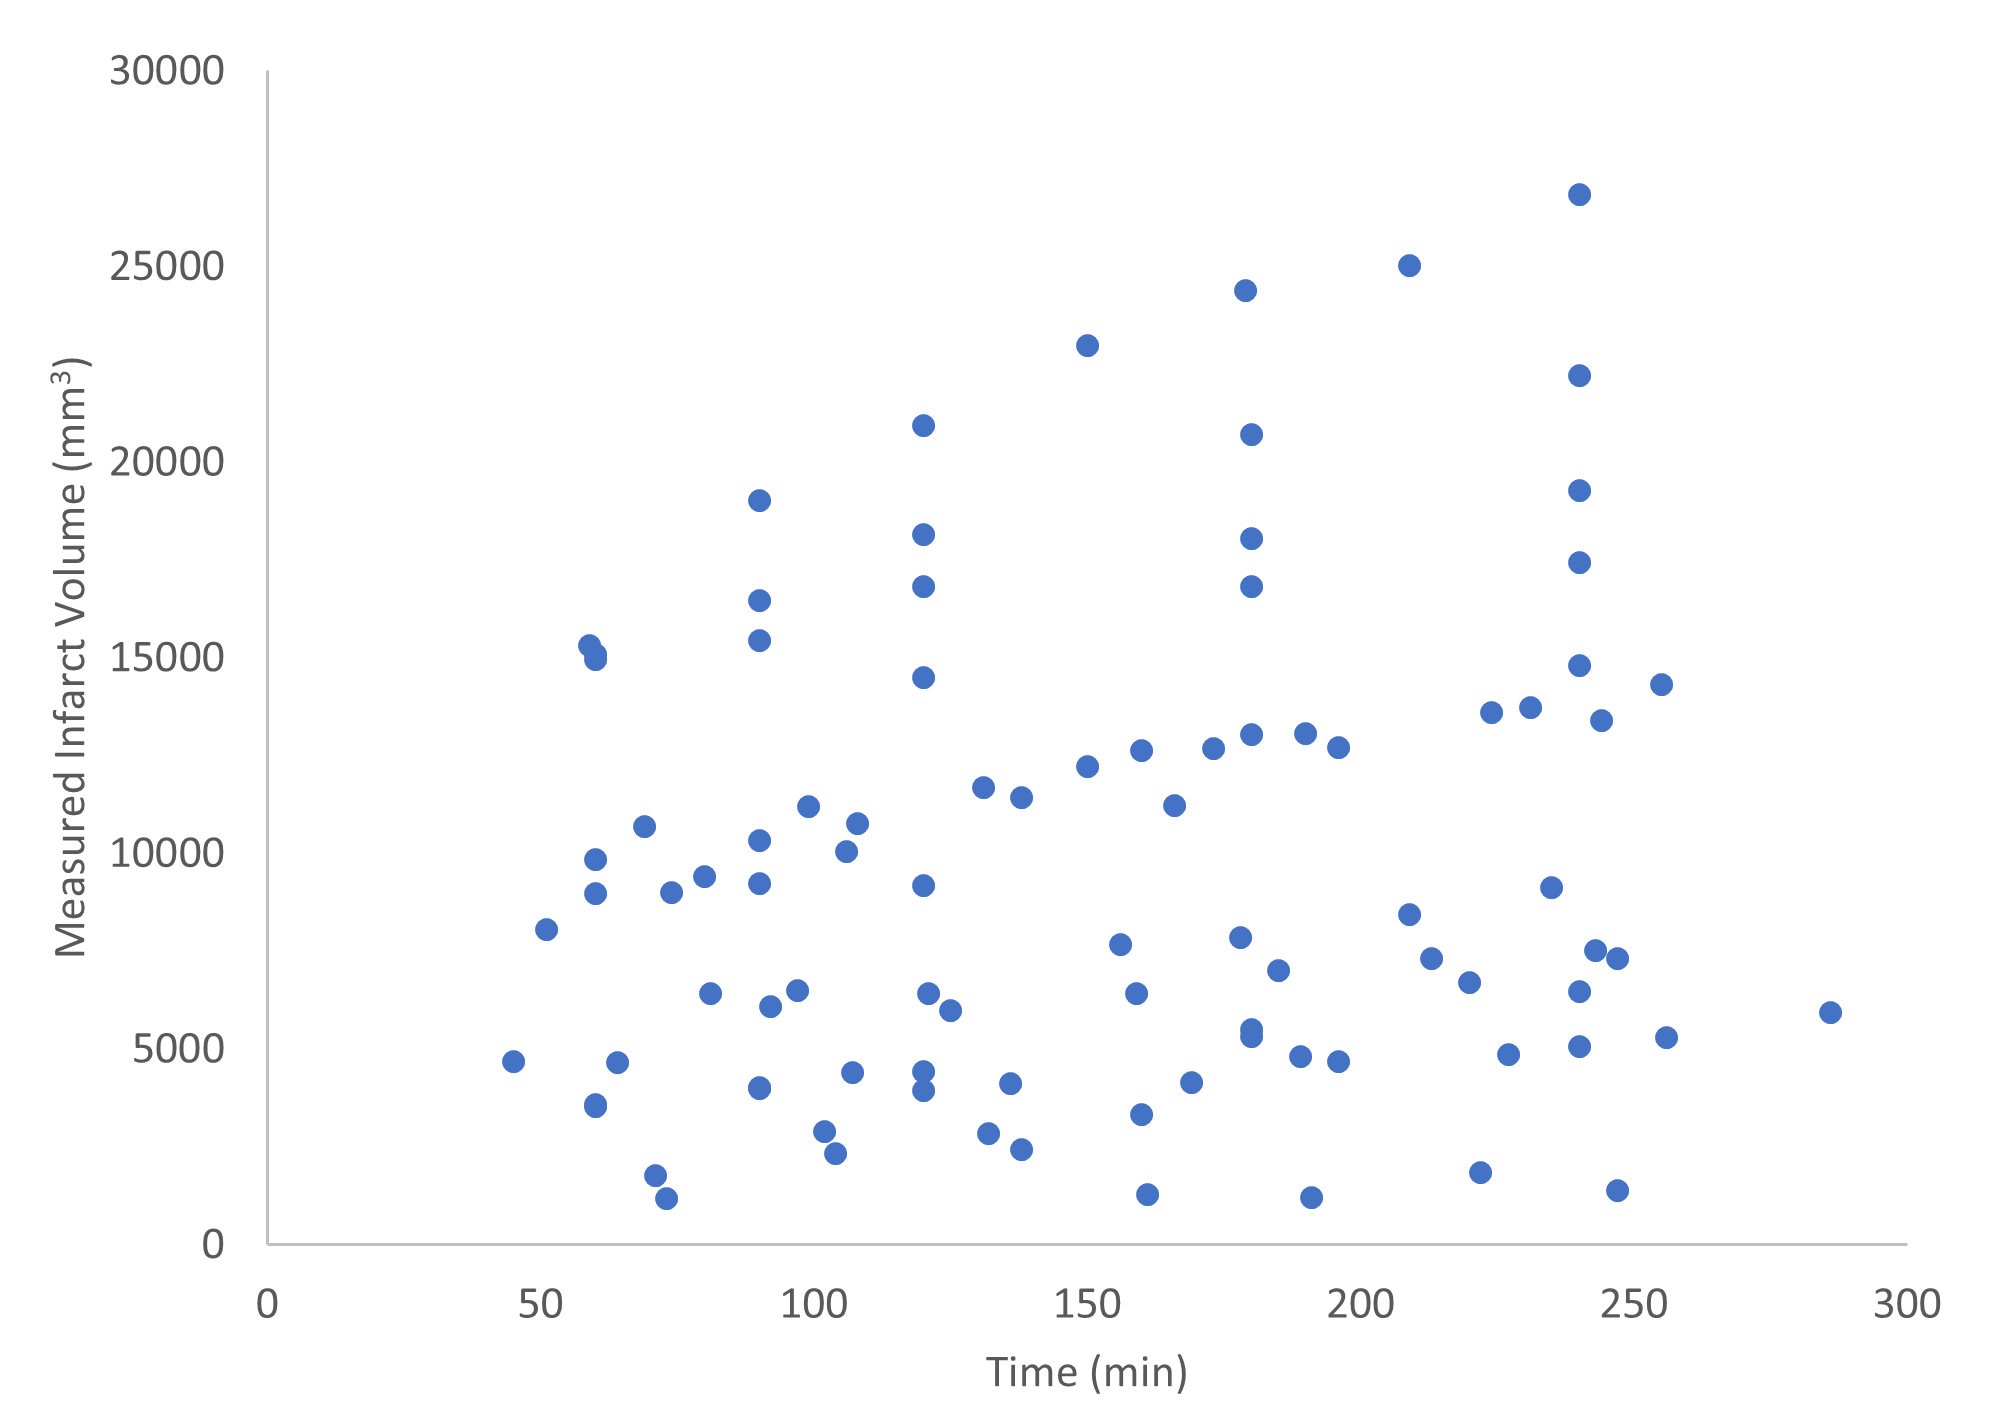
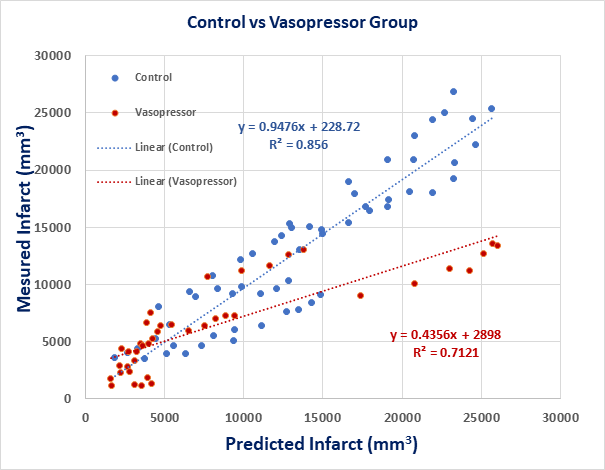
From the retrospective dataset, a high correlation (r2 = 0.94) was found between manually calculated infarct volumes and automatically calculated volumes (Figure 1). In Figure 2, an example case with automatically measured infarct region is shown across time. The infarct volumes versus time for all the cases are shown in Figure 3 and were found to vary largely between cases. The measured infarct volumes were compared against predicted infarct volumes separately for cases with and without treatment. Strong correlations were found in both cases (r2 = 0.71 and r2 = 0.86 respectively), but with treatment, the measured volumes were much smaller than the predicted (Figures 4).Discussion
Using ADC and coefficient of variation as parameters for infarct volume calculation showed high correlation to manually calculated infarct volumes. However, this method utilizes signal intensity that may change based on the b-value used for the DWI scans. Therefore, it’s possible the method presented here may need to be re-tuned for other b-values.
PCS was found to be a good predictor of infarct volume as a function of time when used in the nonlinear model (Eq. 1) as seen by the high correlation. However, with norepinephrine and hydralazine, the predicted infarct volume was greater than the measured infarct volume in most cases. This suggests that a different infarct growth model may exist in which the infarct growth is suppressed under the effects of norepinephrine and hydralazine.
Conclusion
We developed a method of automatically calculating infarct volumes using DWI scans and developed a predictive model of infarct volume using PCS in a controlled canine experiment. Infarct growth and infarct volume are important parameters in patient selection and treatment decision making in acute ischemic stroke. Though a canine model was used in this study, similar relationships may be relevant in humans.Acknowledgements
This work was supported by National Institutes of Health Research Grant R01NS093901-01A1, and American Heart Association Pre-Doctoral Fellowship AHA-16PRE27530023.References
1. Fitzek, S., et al., Time course of lesion development in patients with acute brain stem infarction and correlation with NIHSS score. Eur J Radiol, 2001. 39(3): p. 180-5.
2. Christoforidis, G.A., et al., Angiographic assessment of pial collaterals as a prognostic indicator following intra-arterial thrombolysis for acute ischemic stroke. AJNR Am J Neuroradiol, 2005. 26(7): p. 1789-97.
3. Martinon, E., et al., Collateral circulation in acute stroke: assessing methods and impact: a literature review. J Neuroradiol, 2014. 41(2): p. 97-107.
4. Christoforidis, G.A., et al., Impact of Pial Collaterals on Infarct Growth Rate in Experimental Acute Ischemic Stroke. AJNR Am J Neuroradiol, 2017. 38(2): p. 270-275.
5. Christoforidis, G.A., et al., An endovascular canine middle cerebral artery occlusion model for the study of leptomeningeal collateral recruitment. Invest Radiol, 2011. 46(1): p. 34-40.
Figures