3227
Comparison of Undersampling Capability of Magnetic Resonance Fingerprinting Using Rosette and Variable Density Spiral Trajectories1Department of Biomedical Engineering, Case Western Reserve University, Cleveland, OH, United States, 2Department of Radiology, Case Western Reserve University, Cleveland, OH, United States, 3Department of Biomedical Engineering, Cleveland Clinic, Cleveland, OH, United States, 4Department of Physiology and Biophysics, Case Western Reserve University, Cleveland, OH, United States
Synopsis
The undersampling capability of magnetic resonance fingerprinting (MRF) using Rosette (ROS) and variable density spiral (VDS) trajectories was compared in this study. With a high undersampling factor, ROS-based MRF showed more uniform T1 and T2 mapping in phantoms with reduced errors. However, ROS reconstructed images of mouse brain showed slightly reduced SNR and off-resonance related artifacts, leading to similar undersampling capability as VDS-based MRF in vivo.
Introduction
Magnetic resonance fingerprinting (MRF) allows multi-parametric mapping with unprecedented efficiency1,2. On clinical scanners with parallel imaging capability, MRF using a variable density spiral (VDS) trajectory has allowed accurate T1 and T2 mapping with 48-fold undersampled data. The high efficiency of MRF enables dynamic contrast-enhanced MRI (DCE-MRI) with high temporal resolution. However, without the SNR gain provided by array coils, preclinical applications of MRF have been limited to 8-fold undersampling, leading to >2 min temporal resolution3. The Rosette (ROS) trajectory has been shown to improve the quality of reconstruction in compressed sensing MRI4. In this study, we aimed at evaluating whether Rosette-based MRF can lead to improved undersampling capability in mouse brain.Methods
A FISP-based MRF sequence was implemented on a Bruker 7T scanner with 2π dephasing along the slice direction. 1024 frames were acquired with a constant TR of 10 ms. The flip angle (FA) varied in a sinusoidal pattern as shown in Fig. 1a. VDS and ROS trajectories were designed to allow the coverage of the entire k-space with 48 interleaves (Fig. 1b). Each VDS interleaf sampled 1260 points with the central 10x10 k-space fully smapled5, while each ROS interleaf sampled 1220 points and fully covered the central 4x4 k-space4. In vitro studies were performed on a 4-compartment phantom with manganese chloride (MnCl2) concentration varying from 100 to 400 µM. In vivo studies were performed on two C57/BL6 mice. To validate MRF measurements, T1 and T2 maps were also acquired with Cartesian-based saturation recovery Look-Locker (SRLL) and multi-slice multi-echo (MSME) sequences, respectively. All images were acquired with 2x2 cm2 FOV, 128x128 matrix size, and 1 mm slice thickness. T1 and T2 maps derived from retrospectively undersampled data with an undersampling factor varying from 2 to 48 were compared to those derived from fully sampled data. The normalized root mean square error (NRMSE) was calculated to evaluate the accuracy of T1 and T2 mapping for varied undersampling factors.Results
With only one interleaf (48-fold undersampling), VDS allowed better coverage of the central k-space while ROS had better coverage of the outer k-space (Fig. 1b). As a result, the point spread functions (PSF) of one ROS interleaf showed reduced side lobes and more evenly distributed undersampling noise (Fig. 1c), leading to slightly reduced aliasing artifacts in the reconstructed image.
Using T1 and T2 maps derived from SRLL and MSME as the ‘standard’, results from the phantom study showed that less than 10% differences in estimated mean T1 and T2 values were achieved in all four compartments by both ROS-MRF and VDS-MRF methods using fully sampled data (Fig. 2). ROS-MRF showed more uniform estimation of both T1 and T2 within each compartment. T1 and T2 maps were also generated from retrospectively undersampled data, and ROS-MRF also allowed more uniform T1 and T2 mapping than VDS-MRF (Fig. 3). At a higher undersampling rate, an NRMSE reduction of up to 30% was achieved by ROS-MRF.
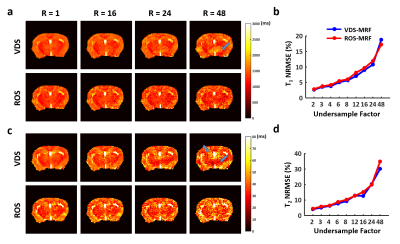
Results of T1 and T2 mapping in vivo are shown in Fig. 4. Imaging artifacts were more pronounced in data acquired with ROS-MRF (Fig. 4a). In addition, images reconstructed from ROS-MRF data also showed about 30% SNR loss comparing to VDS-MRF. Since the ROS trajectory samples the center k-space 4 times in one interleaf, further examination of the k-space revealed a significant signal loss by 47% when sampling the center of k-space the 4th time. In comparison, this signal loss was only 10% in phantom (Fig. 4b). Because of these artifacts and signal loss, ROS-MRF generated T1 and T2 maps showed more severe distortion in delineated brain structures (Fig. 4c). Nevertheless, both ROS-MRF and VDS-MRF showed similar T1 and T2 estimation in the cortex and basal ganglia regions (Fig. 4d). The undersampling capability in vivo as indicated by NRMSE was also similar between ROS-MRF and VDS-MRF (Fig. 5).
Discussion and Conclusion
In the current study, we evaluated the undersampling capability of MRF using ROS- and VDS-based readout trajectories. Results on phantom study suggest improved undersampling capacity using ROS-MRF. However, ROS-MRF showed more pronounced artifacts and SNR loss in vivo that gave rise to similar performance as VDS-MRF. The SNR loss could be caused by fast T2* decay and off-resonance effects in vivo. Future work can focus on correcting for the fast T2* decay and off-resonance effects to improve the accuracy of parameter mapping by ROS-MRF in vivo.Acknowledgements
This work was supported by grants from the U.S. National Institute of Health (R01 EB23704).References
1. Ma D, Gulani V, Seiberlich N, et al. Magnetic resonance fingerprinting. Nature. 2013;495(7440):187-192. doi:10.1038/nature11971.
2. Jiang Y, Ma D, Seiberlich N, Gulani V, Griswold MA. MR fingerprinting using fast imaging with steady state precession (FISP) with spiral readout. Magn Reson Med. 2015;74(6):1621-1631. doi:10.1002/mrm.25559.
3. Gu Y, Wang CY, Anderson CE, et al. Fast magnetic resonance fingerprinting for dynamic contrast-enhanced studies in mice. Magn Reson Med. 2018;(March):2681-2690. doi:10.1002/mrm.27345.
4. Li Y, Yang R, Zhang C, Zhang J, Jia S, Zhou Z. Analysis of generalized rosette trajectory for compressed sensing MRI Analysis of generalized rosette trajectory for compressed sensing MRI. 2015;5530. doi:10.1118/1.4928152.
5. Pipe JG, Zwart NR. Spiral trajectory design: A flexible numerical algorithm and base analytical equations. Magn Reson Med. 2014;71(1):278-285. doi:10.1002/mrm.24675.
Figures


