3225
Optimized quantification of T2 relaxation times using gel phantoms in animal models for high-consequence pathogens in a Biosafety Level 4 environment1National Institute of Allergy and Infectious Diseases - Integrated Research Facility, National Institutes of Health, Fort Detrick, MD, United States, 2Philips Healthcare, Highland Height, OH, United States, 3Clinical Monitory Research Program Directorate, Frederick National Laboratory for Cancer Research sponsored by the National Cancer Institute, National Institutes of Health, Frederick, MD, United States, 4Clinical Center, National Institutes of Health, Bethesda, MD, United States
Synopsis
This experiment improved the accuracy of in vivo T2 measures used to evaluate blood brain barrier (BBB) disruption and subtle cerebral edema in non-human primate models of high-consequence viral infections in a Bio-Safety Level 4 (BSL-4) environment. In a healthy non-human primate, we used four gel phantoms to optimize T2 relaxation times and investigated dependence of T2 on echo times. This methodology improved the accuracy of T2 estimation using fast spin echo sequences and phantoms. We hypothesized that reliable T2 values can be obtained by adding a phantom-calibration step to the T2 map calculation.
INTRODUCTION
T2 relaxometry can accurately quantify extravascular liquid accumulation. T2 parametric maps could be biomarkers of infectious diseases having consequence in the brain. Computation of T2 maps from multiple-echo images during a repetition time (TR) interval in conventional and fast spin-echo images has been used before [1-4]. Dual echo time (TE) T2 FLAIR (Fluid-Attenuated Inversion Recovery) minimizes the partial volume effects from cerebrospinal fluid (CSF) and meets the acquisition time required in a BSL-4 laboratory, where cohorts of animals are imaged during the disease on a tight schedule until terminal stages [5]. However, the prescribed TE to compute T2 varies among slices due to k-space mapping in fast spin-echo and an effective echo time (TEeff) should be considered. We hypothesize that accurate TEeff can be estimated by optimization based on semi-empirical values for each slice ordering. To evaluate this hypothesis, four gel phantoms were scanned and their T2 values were computed using echo times around the prescribed TE. Dependence of computed T2 in a healthy non-human primate on echo times was investigated.METHODS
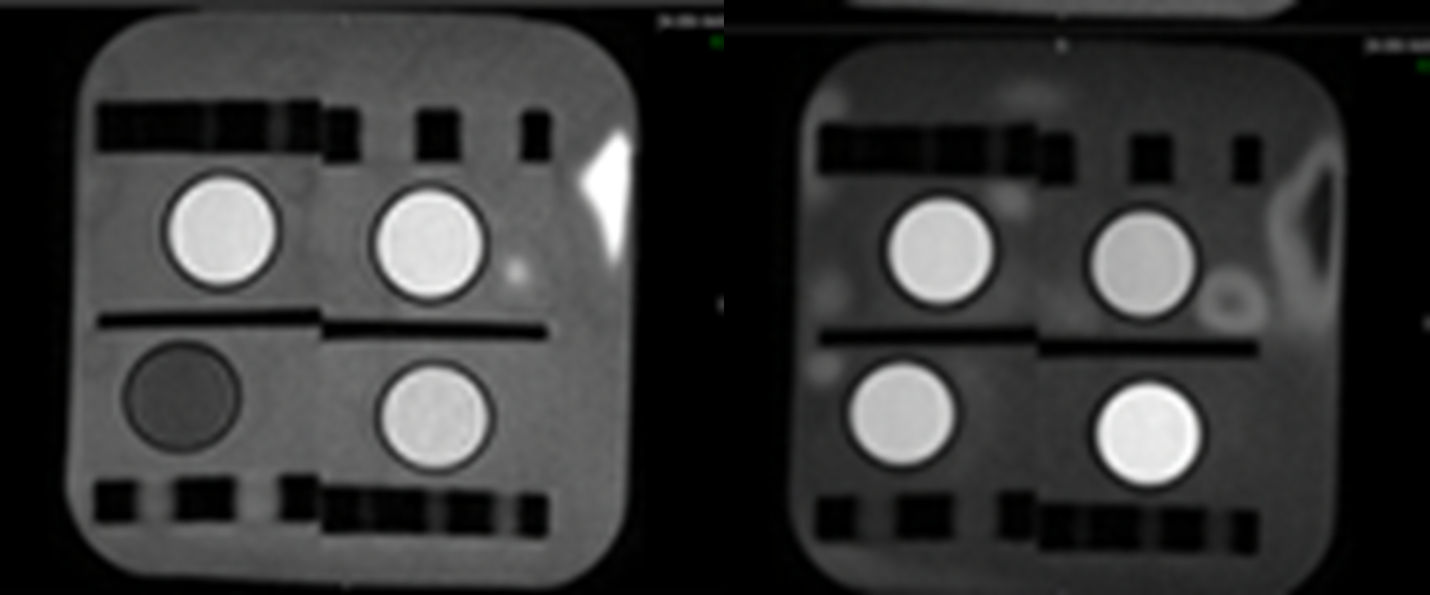
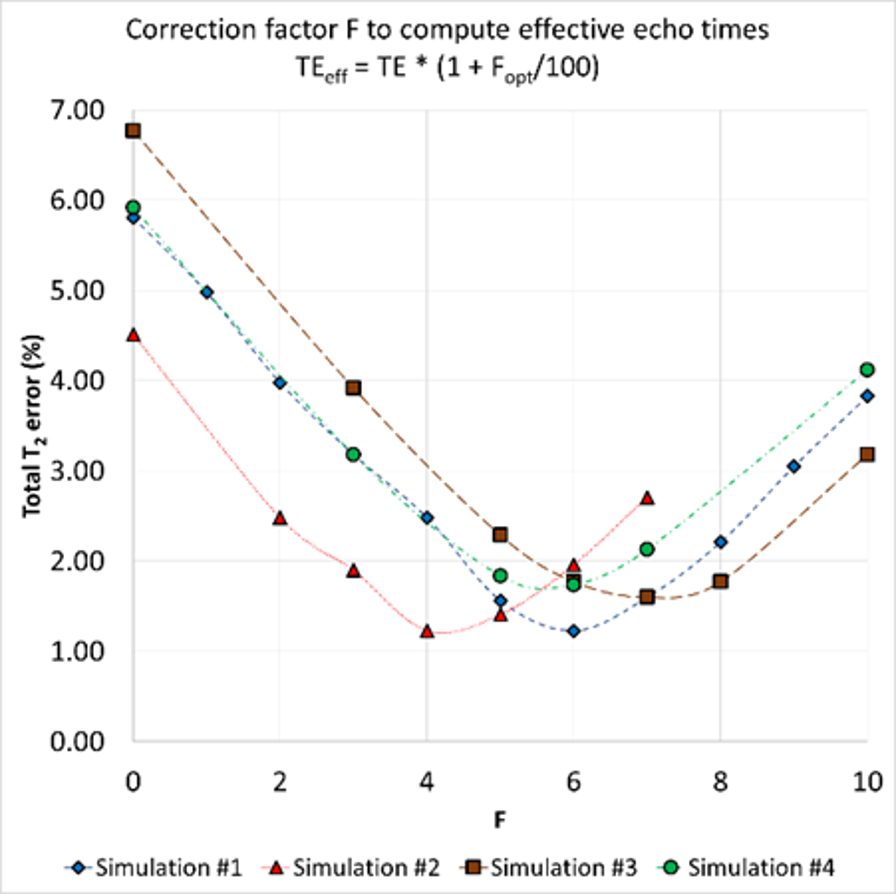
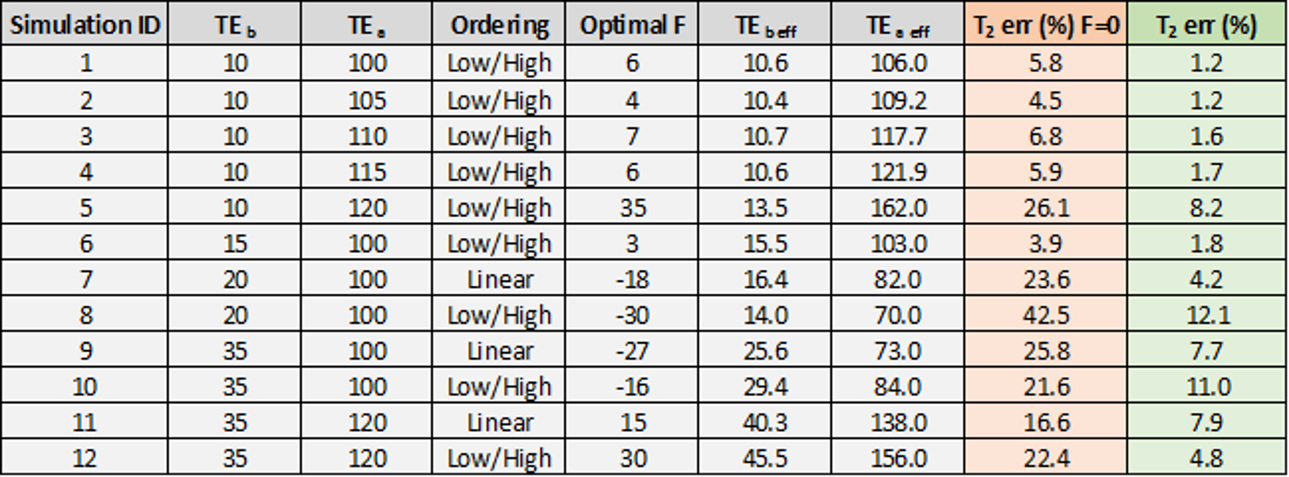
A dedicated Philips Achieva 3T MRI scanner (Philips Healthcare) was used for imaging. Four gel phantoms (Leeds Test Objects, North Yorkshire, UK) with reported T2 values similar to those expected in the brain were used: T2p1 = (52+/-2) ms; T2p2 = (113+/-3) ms; T2p3 = (157+/-5) ms; T2p4 = (214+/-6) ms (T=19°C, 3% error). Dual TE T2 FLAIR images (FA=90°; TR=10000 ms; TEa=100-120 ms; TEb=10-35 ms) with either linear or low/high slice ordering were acquired (Table 1) and processed with an in-house extension for MIM v.6.7 (MIM Software, Cleveland, OH, USA). T2 maps were computed (T2 = (TEa – TEb) / (ln(Sa)-ln(Sb)) using increased and decreased TE with respect to the prescribed values by a correction factor F(%). For each phantom, the mean T2 within a volume of interest (VOI) was calculated, the total error between the computed T2 and the T2 reported by the manufacturer was minimized, and TEeff=TE(1+Fopt/100) was calculated using the optimal factor Fopt. A healthy rhesus macaque was scanned to compare T2 maps. The animal was housed in an Assessment and Accreditation of Laboratory Animal Care International accredited facility.RESULTS
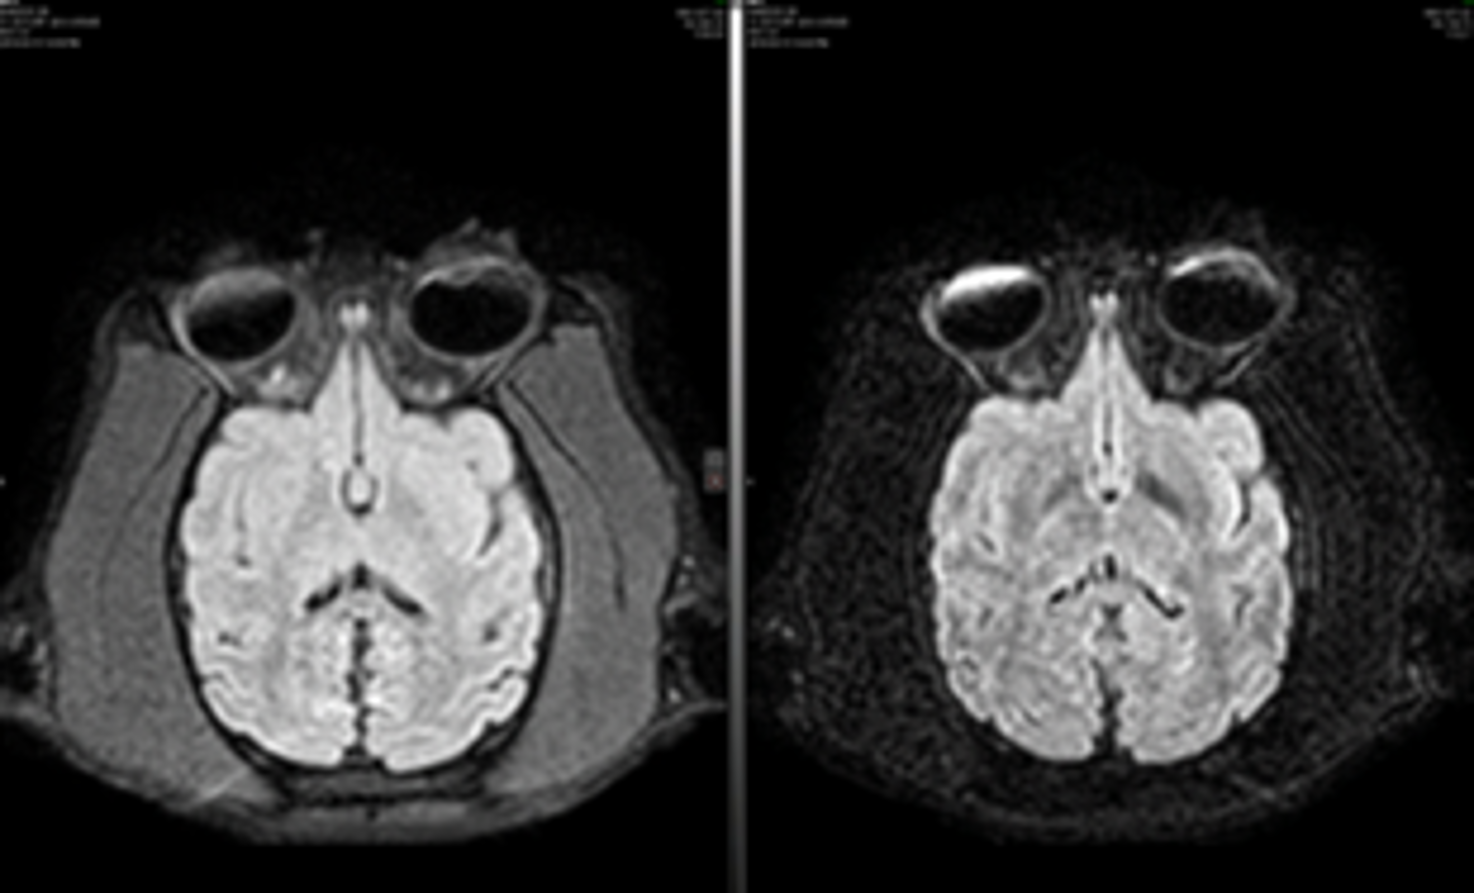
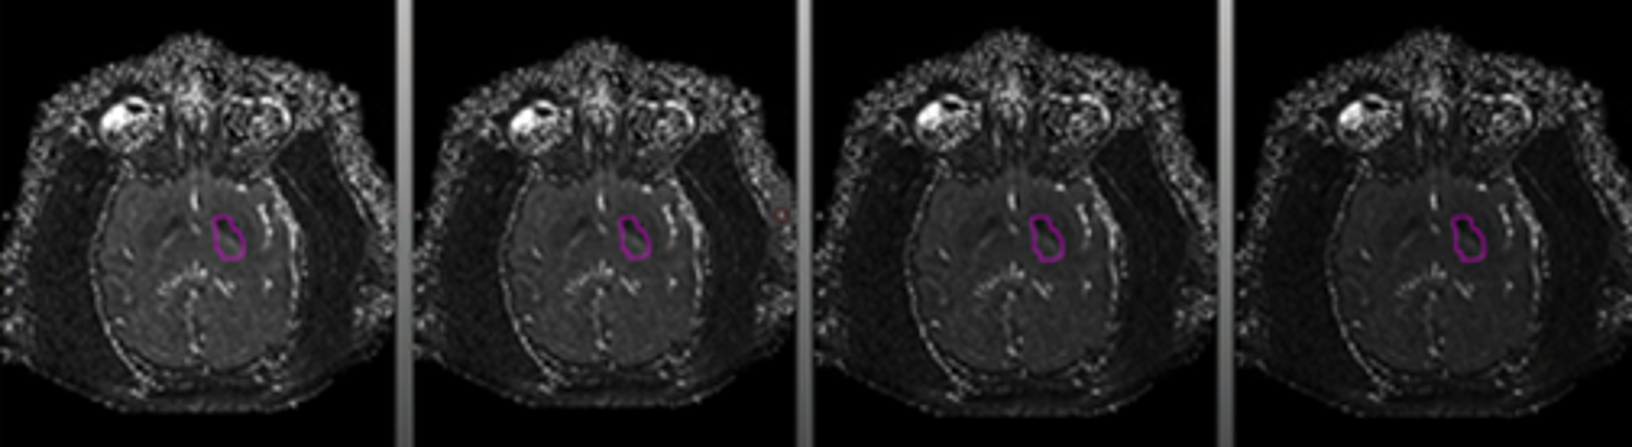
Figure 1 shows the setting for all phantoms in dual TE T2 FLAIR images. All computed T2 maps for different phantoms, slice ordering, and correction factors exhibited standard deviations within the VOIs comparable to the reported T2 errors. Figure 2 shows the total percent error in all phantoms between the computed and reported T2 relaxation times calculated as a function of F (Simulations #1-#4). The effective echo times TEeff corresponding to the optimal correction factor Fopt for each slice ordering in the k-space are shown in Table 1. For the lowest short TE of 10 ms and all long echo times ranging from 100 ms to 115 ms the total percent error and the maximum error for an individual phantom remained below 1.9% and 3.5%, respectively. The performance of linear and low/high slice ordering schemes was compared for TEa = 100 ms, TEb = 20 ms and 35 ms, and the percent error was smaller for the linear ordering: 4.2% and 7.7% compared to 12.1% and 11.0%. Dual TE T2 FLAIR images of the non-human primate (Figure 3) were used to compute T2 maps using different echo times (Figure 4) around TEa=100 ms (linear) and TEb=35 ms (linear). A minimum total error of 7.7% with respect to all phantoms was achieved when the optimal correction factor F was used.DISCUSSION
The brain is an organ of interest in the high-consequence infectious disease mechanics and therapy monitoring. Subtle BBB disruption and edema can be identified and quantified using T2 maps [7]. However, accurate estimation of T2 relaxation times is required to accurately correlate imaging finding with biological processes and therapeutic efficiency. The use of phantoms to estimate water content was proposed [8]. In this work, however, we present a methodology to improve the accuracy of T2 estimation using fast spin echo sequences and phantoms. Reliable relaxation times can be obtained by adding a phantom-calibration step to the T2 map calculation. Calibration is needed for further comparison to R2* maps to compute of R2’ maps as a biomarker of iron deposition, and reliable synthetic MR images based on T1/T2 maps.Acknowledgements
The authors thank Laura Bollinger and Jiro Wada, IRF, for technical writing services and figure preparation and layout, respectively. This work was supported by NIAID Division of Intramural Research and NIAID DCR and was performed under Battelle Memorial Institute contract (No. HHSN272200700016I) with NIAID. Animals were housed in an AAALAC-International-accredited facility. All experimental procedures were approved by the NIAID Division of Clinical Research (DCR) Animal Care and Use Committee and were in compliance with the Animal Welfare Act regulations, Publish Health Service policy, and the Guide for the Care and Use of Laboratory Animals recommendations.References
[1] J Magn Reson Imag 13(4):547-542, 2001
[2] Epilepsy Res 48(1-2):131-142, 2002
[3] Am J Neuroradiol 17(10):1805-1810,1996
[4] Radiology 209(2):551-555,1998
[5] Pathog Dis 71(2):211-216, 2014
[6] J Infect Dis 208:310-318, 2013
[7] Neuroimage Clin 6:166-170, 2014
[8] Magn Reson Imag 34:246-251, 2016
Figures