3222
Preclinical detection of leptomeningeal inflammation in the myelin oligodendrocyte glycoprotein (MOG) induced experimental autoimmune encephalomyelitis (EAE) model of multiple sclerosis (MS)1Buffalo Neuroimaging Analysis Center, Department of Neurology, Jacobs School of Medicine and Biomedical Sciences, University at Buffalo, The State University of New York, Buffalo, NY, United States, 2Center for Biomedical Imaging, Clinical and Translational Science Institute, University at Buffalo, The State University of New York, Buffalo, NY, United States
Synopsis
Clusters of inflammatory cells in the leptomeningeal compartment are suspected to contribute directly to subpial cortical demyelination and neurodegeneration in patients with multiple sclerosis (MS). Clinical post-contrast 3D T2-FLAIR detects these clusters through the leakage of a T1 contrast agent into inflammatory foci and the subarachnoid space, referred to as leptomeningeal contrast enhancement (LMCE). While leptomeningeal inflammation has been reported in rodent models of MS, LMCE has not been used to study disease pathology in the preclinical setting.
In this work, we present an imaging protocol for LMCE imaging in the experimental autoimmune encephalomyelitis myelin oligodendrocyte glycoprotein (EAE-MOG) murine model of MS at 9.4 Tesla.
Introduction
Histology suggests the existence of persistent clusters of inflammatory cells in the leptomeningeal compartment and associated subpial demyelination of the cortex in patients with the progressive form of multiple sclerosis (MS). It has been hypothesized that these foci play a critical role in subpial cortical demyelination and neurodegeneration.1-4
The leakage of intravenously administered contrast agent into the subarachnoid space is an indirect marker of LMI that allows studying this phenomenon in vivo.
A particularly sensitive technique for the detection of leptomeningeal inflammation (LMI), which is used in the clinical setting, is three-dimensional (3D) fluid-attenuated inversion recovery (FLAIR) imaging after the injection of a T1-shortening contrast agent.5 However, despite its significant research implications, it is unclear if MRI can reliably detect LMI in rodent models of MS. In the present work, we systematically studied the feasibility of in vivo detection of LMI with LMCE-based MRI in the myelin oligodendrocyte glycoprotein (MOG) induced experimental autoimmune encephalomyelitis (EAE) mouse model of MS at 9.4 Tesla.
Methods
Animals: We immunized ten C57BL/6J mice with MOG peptide fragment and injected four with saline (shams).
MRI: Isoflurane-anesthetized animals were scanned between one and two weeks after induction at 9.4 Tesla. We nulled the signal from the cerebrospinal fluid (CSF; T1CSF=2450ms) by adding an inversion recovery (IR) pulse to a 2D RARE sequence (FLAIR-RARE; TI=1162ms; TR/TE=3500/5.44ms;BW=89kHz; FOV=18x19 mm2; RARE factor=2; NEX=3; 22 slices; thickness=600μm; matrix=170x180; reconstructed resolution=52.5x52.5μm2; TA=15m45s). Before the first MRI sequence, we injected 0.2 μmol/g gadobutrol (Gadovist, Bayer HealthCare) into the tail vein. To determine the optimal post-contrast acquisition time, we applied the sequence twice back-to-back.
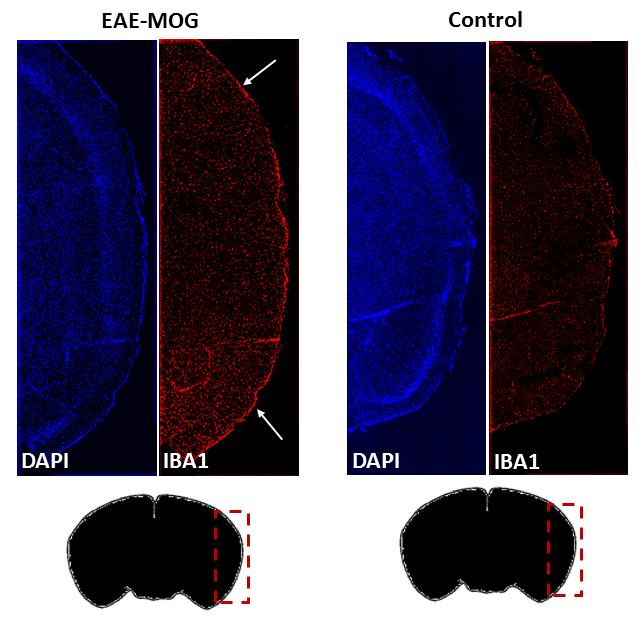
Histology: Cell nuclei were stained using DAPI colorant (4',6-diamidino-2-phenylindole; Sigma). The density of microglia was assessed by staining with iba1 (ionized calcium-binding adapter molecule 1) to verify the presence of inflammatory foci.
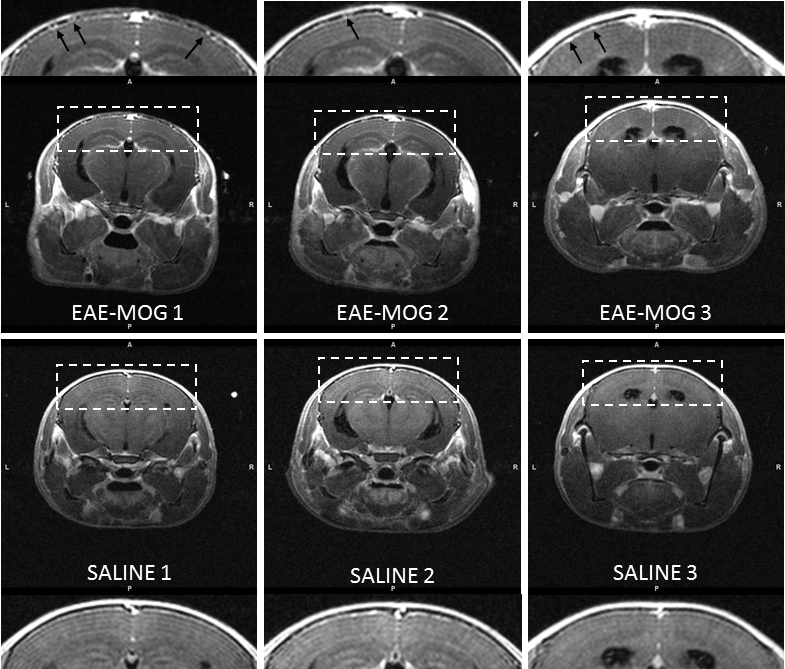
Qualitative Analysis: Three trained, blinded image raters identified LMI based on one of the following two criteria (Figure 3):
- Hyper-intense meninges that is in several regions or everywhere thicker than veins typically seen in this area.
- Presence of hyper-intense focal nodules that extend from the meninges into the arachnoid space.
Raters used these criteria to classify scans as definite, probable, or absence of LMI.
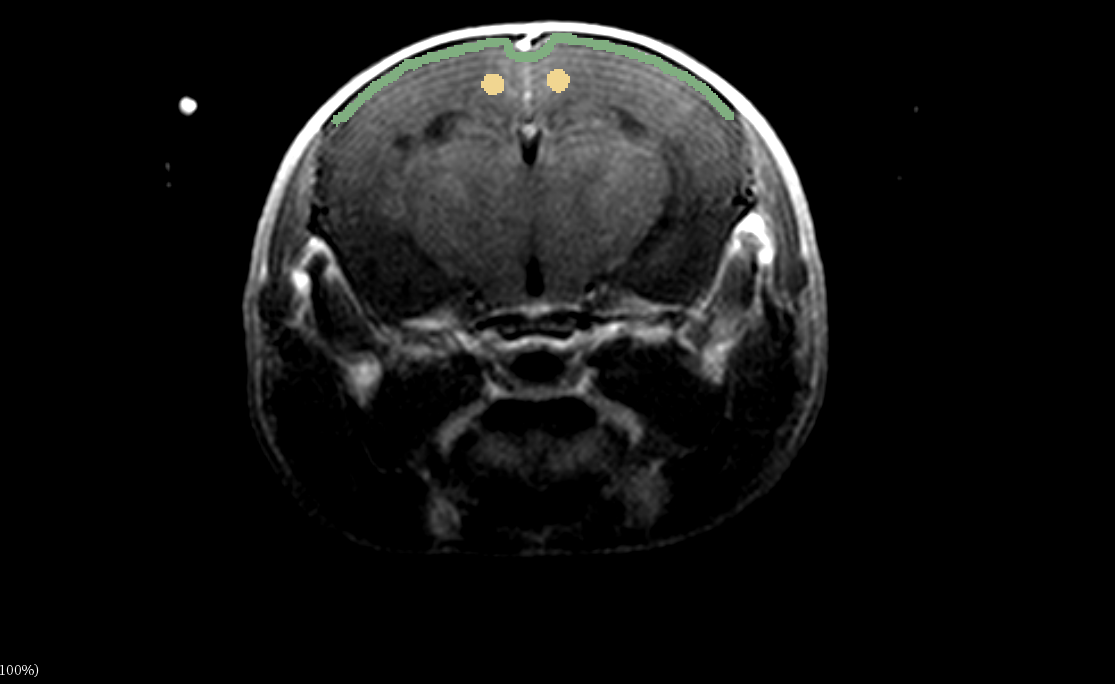
Quantitative ROI-Analysis: For each scan, we defined a 105μm-thick elongated region of interest (ROI) along the dorsal meningeal area on the slice located 1.2mm posterior to the anterior boundary of the ventricles (Figure 2). We referenced signal intensities to cortical gray matter and calculated normalized average signals in the ROI.
Results
Histology confirmed a higher density of immune response cells in the meninges of all EAE-MOG animals (Figure 4).
Raters correctly classified all scans as LMI-positive or LMI-negative with an inter-rater agreement (ICC) of 74%. Specificity and sensitivity were 93% and 100%, respectively, for all raters combined, and ≥80% and 100% for each rater. For the second of the two scans, sensitivity and specificity were 100% for each of the three raters. Sensitivity was lower (all raters combined: 89%; individual raters: ≥67%) for the first of the two scans. Intra-rater reproducibility was 100%.
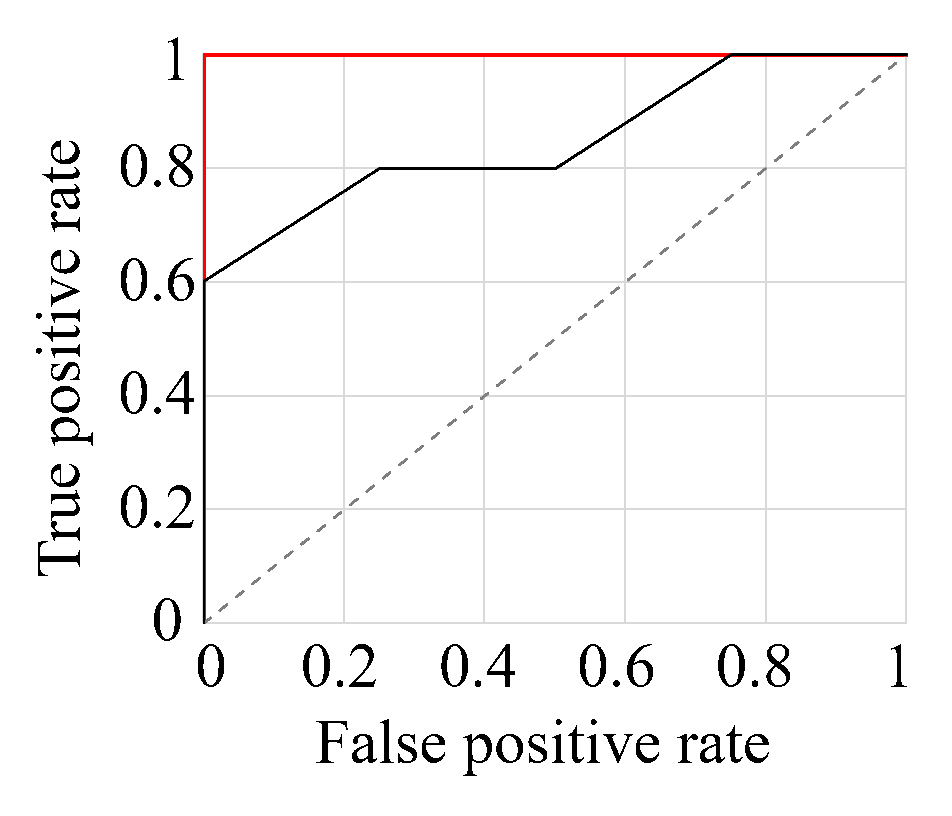
Normalized mean meningeal signal intensities in the ROIs were significantly increased (p<0.020, d=2.1) in EAE-MOG (1.17±0.10 mean±std) compared to shams (1.03±0.03) for the second post-injection scan, but not the first (p=0.13, d=1.0). Figure 1 shows receiver operating characteristic (ROC) curves for the identification of infected animals using the mean (red) and the maximum intensity values (black) of the second scans, respectively. A cut-off mean value of 1.07 yielded 100% sensitivity and 100% specificity for the detection of LMCE.
Discussion
This work is the first systematic investigation of the feasibility of preclinical LMCE-MRI in rodents.
We showed that post-contrast FLAIR at 9.4T reliably detects contrast agent accumulation in the meningeal compartment of EAE-MOG mice. Although specificity and sensitivity were relatively high for the qualitative approach, we found that the accuracy of the technique depended on a meticulous assessment of the images to avoid interpretation of large vessels and Gibbs-ringing as thickening of the meninges. Similar to clinical LMCE-FLAIR protocols, which usually involve a delay of 10-20 minutes between injection and acquisition, delayed acquisition improved the sensitivity also in the preclinical model.
Conclusion
FLAIR at 9.4 Tesla detects LMI with high sensitivity and specificity, providing a new avenue for the preclinical investigation of MS-related pathology and therapeutic approaches.Acknowledgements
Research reported in this publication was funded by the National Center for Advancing Translational Sciences of the National Institutes of Health under Award Number UL1TR001412. The content is solely the responsibility of the authors and does not necessarily represent the official views of the NIH.References
1. Serafini B et al. “Detection of ectopic B-cell follicles with germinal centers in the meninges of patients with secondary progressive multiple sclerosis,” Brain Pathol, 14(2):164–174, 2004.
2. Magliozzi R et al. “Meningeal B-cell follicles in secondary progressive multiple sclerosis associate with early onset of disease and severe cortical pathology,” Brain, 130(4):1089–1104, 2007.
3. Magliozzi R et al. “A Gradient of neuronal loss and meningeal inflammation in multiple sclerosis,” Annals of Neurology, 68(4):477–493, 2010.
4. Howell OW et al. “Meningeal inflammation is widespread and linked to cortical pathology in multiple sclerosis,” Brain, 134(9):2755–2771, 2011.
5. Choi SR et al. “Meningeal inflammation plays a role in the pathology of primary progressive multiple sclerosis,” Brain, 135(10):2925–2937, 2012.
Figures