3219
The mechanical signature of the dying brain1AG Elastography, Experimental Radiologie, Charité - Universitätsmedizin Berlin, Berlin, Germany, 2Institue for Medical Informatics, Charité - Universitätsmedizin Berlin, Berlin, Germany, 3Department of Neurology, Charité - Universitätsmedizin Berlin, Berlin, Germany
Synopsis
In this study the mechanical properties of the mouse brain were continuously sampled by fast magnetic resonance elastography during ketamine/xylazine induced dying. Mechanical properties were correlated with metabolic and physiological imaging markers. Immediately after respiration arrest, stiffness of the whole brain and the hippocampus increased significantly while cardiac functioning was intact and reached a plateau ca. 5 min after ECG stop. Stiffness increase was inversely correlated with diffusion decrease. Results suggest that during the process of dying cytotoxic edema and brain swelling occurs leading to significant tissue stiffening.
Introduction
The structural changes that occur in brain parenchyma during the process of dying, are largely unknown. Respiratory arrest (RA) is a major life-threatening condition leading to cessation of vital functions and hypoxic-anoxic injury (HAI) of the brain. In this study, fast single-shot magnetic resonance electrography (MRE)1 is used to monitor dynamic viscoelasticity changes in an HAI mouse model with 40-sec temporal resolution. To further characterize biophysical parameter changes, MRE is combined with diffusion-weighted imaging (DWI) and magnetic resonance spectroscopy (MRS). Our study aims at analyzing biophysical parameters associated with microstructural alterations during live-threatening conditions in the brain eventually leading to death.Methods
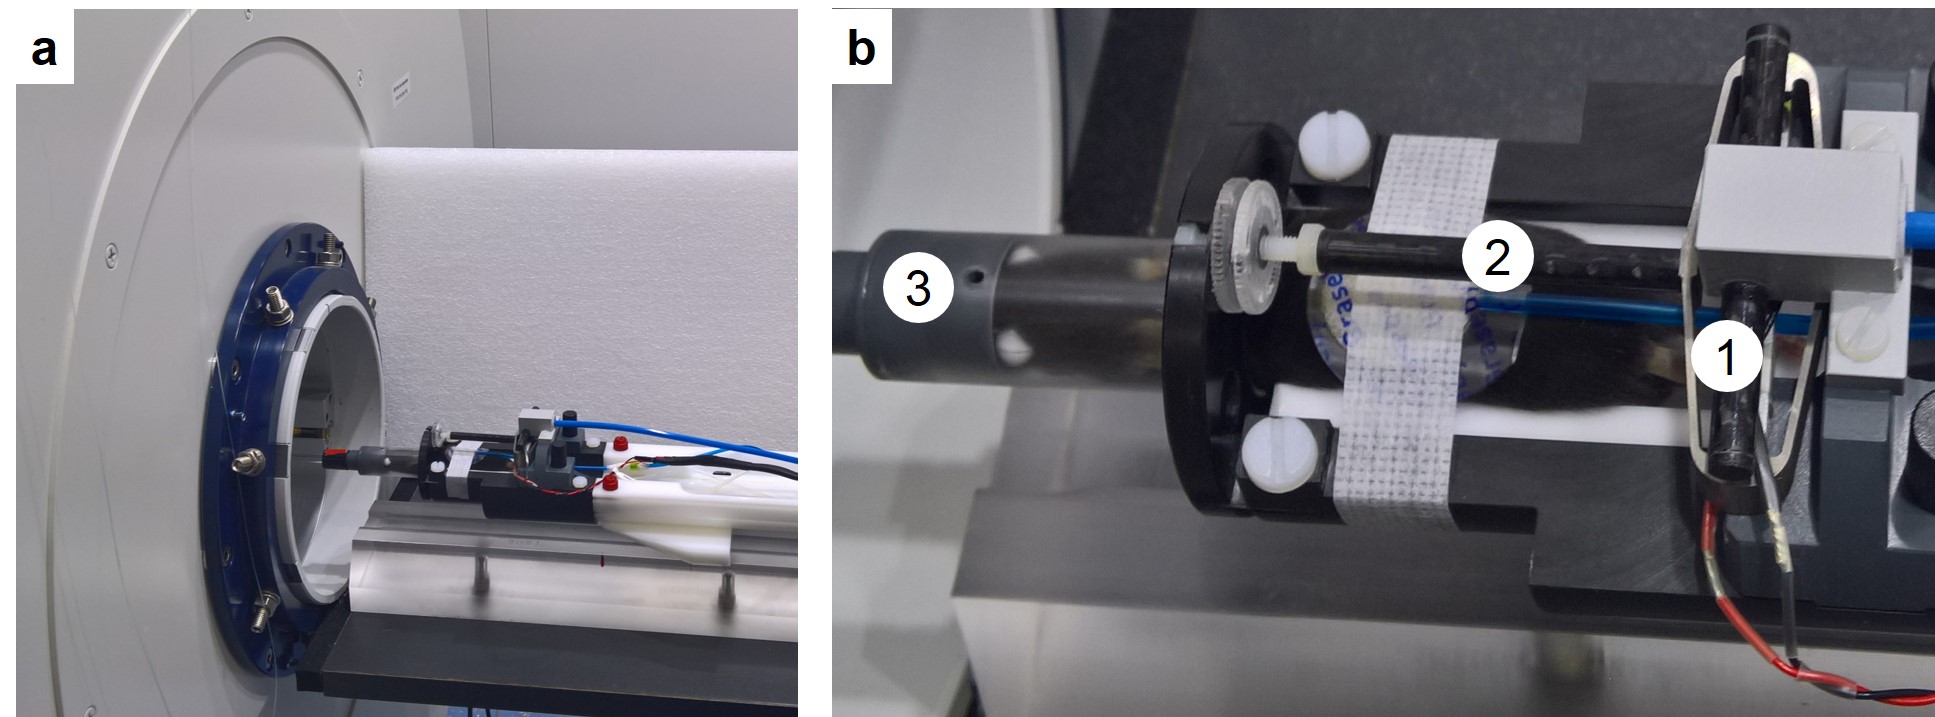
10 healthy female C57BL-6 mice were investigated in a 7T small animal MRI scanner (Bruker Biospec, Ettlingen, Germany). The mice were anesthetized with 1.5% isoflurane in air. All mice received a lethal dose of ketamine/xylazine subcutaneously after completion of in vivo baseline imaging. Afterwards, a series of ultra-fast EPI-MRE1 scans with 1200Hz mechanical vibration and SLIM2 sampling strategy were acquired with 40sec temporal resolution using a custom made driver setup (figure 1). Tissue water content was estimated by MRS performed at two time points: before ketamine/xylazine injection and 1.5h post mortem (PM). T2* relaxation maps (scanner integrated software) were derived for the same time points as MRS. For three mice, MRE was combined with DWI in interleaved meaner. Shear wave speed (SWS) values derived with k-MDEV3 inversion from complex MRE wave images were evaluated for the whole brain (WB) and the hippocampus (HIP). ADC and water content were assessed for HIP only. Statistical significance was determined using the Wilcoxon test.Results
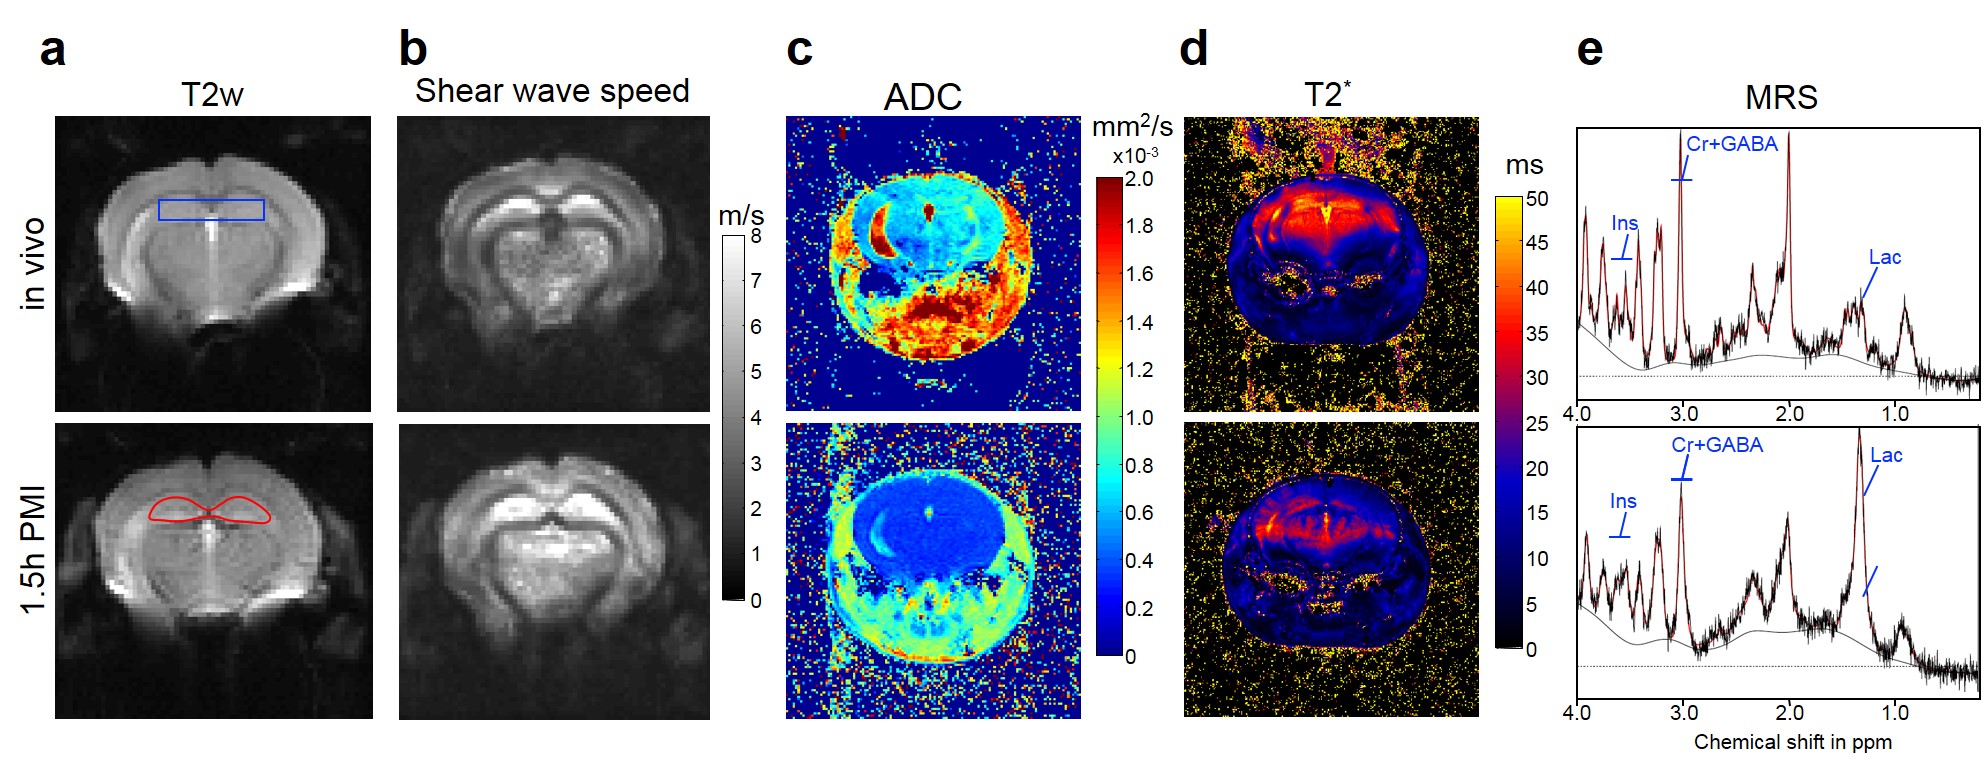
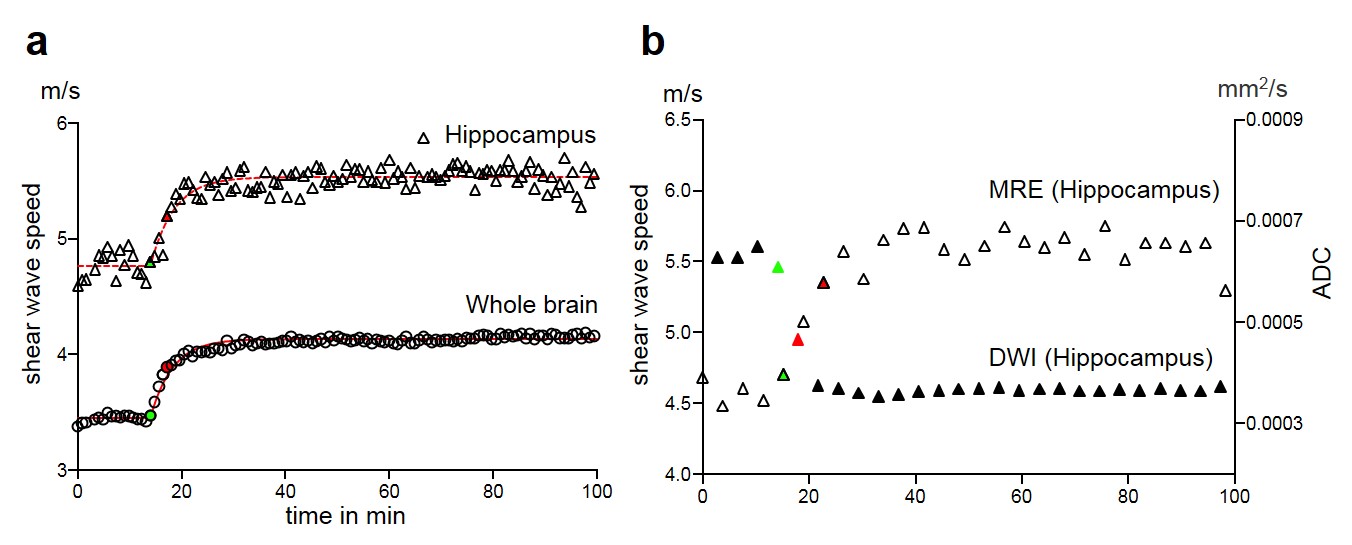
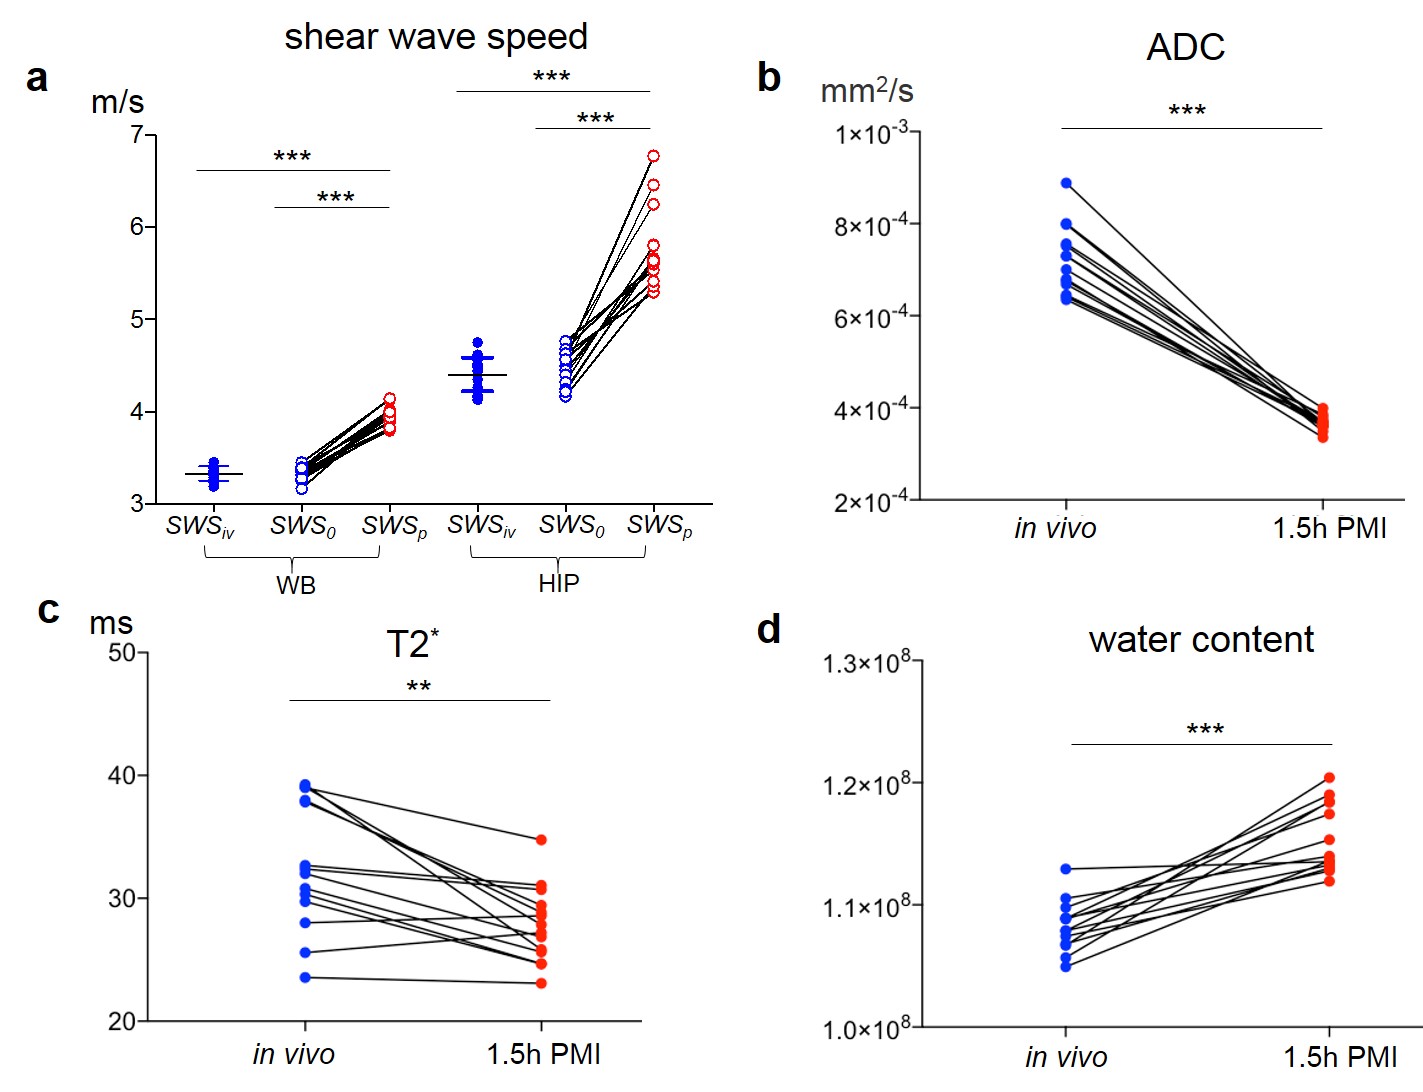
Representative maps of T2w, SWS, ADC, T2* and MRS spectra are shown in Figure 2 for the time points prior to ketamine/xylazine administration (in vivo) and 1.5h PM. Figure 3a shows the time course of SWS in WB and HIP for one animal. Figure 3b shows the temporal development for interleaved ADC and SWS in the HIP for another animal. The stiffness of both WB and HIP started to increase after RA, while cardiac function was still preserved. Average changes of SWS, ADC, T2* and water content between living and death state are shown in figure 4. The average time between ketamine/xylazine administration and RA was 15±2 min. In all mice, stiffness increased significantly within 40sec of RA by 6±3% in WB (P=0.002) and 8±9% in HIP (P=0.037) compared with baseline SWS (figure 4a). Averaged increases in stiffness between initial and plateau SWS in WB and HIP were 17±3% and 30±11%, respectively (figure 4b). SWS increase in the HIP was correlated with ADC decrease (figures 3b, 4b). Group mean values of ADC decreased significantly by 50±6% at 1.5h PM compared with in vivo values (figure 4b). T2* values were significantly higher in vivo than at 1.5h PM (P=0.0012, figure 4c). Water content of brain parenchyma obtained from MRS of all mice increased significantly from in vivo to 1.5h PM (P=0.002, figure 4d).Discussion/Conclusion
To our knowledge, this is the first time-resolved investigation of dynamic changes in mechanical properties in the dying brain. In all animals, we observed a significant HAI-related increase in stiffness after RA. Brain tissue was significantly stiffer post mortem than in vivo. This finding is consistent with post mortem MRE measurement of porcine brain tissue4. The HAI-related reduction of blood oxygenation observed in T2* maps confirmed that cerebral function was diminished 1.5h PM. Established markers for the formation of cytotoxic edema in the brain are i) decreased ADC reflecting restricted water movement5,6,7 and ii) increased lactose concentration in the spectrum of MRS indicating brain lactacidosis8,9. Furthermore, the observed increase of water content 1.5h PM indicates that water influxes into the extracellular space leading to both brain swelling and cytotoxic edema10. Cytotoxic edema is an osmotically driven increase of intracellular pressure, which might contribute to the observed macroscopic increase of brain stiffness. In conclusion, our results show that stiffening is the mechanical signature of the dying brain, which can be attributed to two main effects, cytotoxic edema and brain swelling, both induced by hypoxia and post-RA anoxia.Acknowledgements
The work was funded by the Deutsche Forschungsgemeinschaft (DFG, German Research Foundation) – GRK2260 (BIOQIC) and SFB 1340/1 2018.References
[1] Bertalan G et al., Fast tomoelastography of the mouse brain by multifrequency single-shot MR elastography, Magn Reson Med, DOI: 10.1002/mrm.27586.
[2] Klatt D et al., Simultaneous, multidirectional acquisition of displacement fields in magnetic resonance elastography of the in vivo human brain, J Magn Reson Imaging, 42(2):297-304, 2015.
[3] Tzschätzsch H et al., Tomoelastography by multifrequency wave number recovery from time-harmonic propagating shear waves, Med Image Analysis (30):1-10, 2016.
[4] Weickenmeier J et al., Brain stiffens post mortem, J Mech Behav Biomed Mater 84:88-98, 2018.
[5] Fukuda AM et al., Delayed increase of astrocytic aquaporin 4 after juvenile traumatic brain injury: possible role in edema resolution?, Neuroscience (222):366-378, 2012.
[6] Scheurer E et al., Forensic application of postmortem diffusion-weighted and diffusion tensor MR imaging of the human brain in situ, Am J Neuroradiol 32(8):1518-1524, 2011.
[7] Van Putten HP et al., Diffusion-weighted imaging of edema following traumatic brain injury in rats: Effects of secondary hypoxia, J Neurotraums 22(8):857-872, 2005.
[8] Plesnila N et al., Effect of lactacidosis on cell volume and intracellular pH of astrocytes, J Neurotrauma 16(9):831-841, 1999.
[9] Staub F et al., Swelling and death of neuronal cells by lactic acid, J Neurol Sci 119(1):79-84, 1993.
[10] Stokum JA et al., Molecular pathophysiology of cerebral edema, J Cereb Blood Flow Metab 36(3):513-538, 2016.
Figures