3217
The generalized effect of diffusion on quantitative T2 mapping in preclinical scanners1Department of Biomedical Engineering, Tel Aviv University, Tel Aviv, Israel, 2School of Chemistry, Tel Aviv University, Tel Aviv, Israel, 3Sagol School of Neuroscience, Tel Aviv University, Tel Aviv, Israel, 4Center for Advanced Imaging Innovation and Research (CAI2R), New-York University Langone Medical Center, New York, NY, United States
Synopsis
Diffusion has a clear effect on qT2 measurements especially at high resolutions, caused by the imaging gradients. SSE and MSME protocols were used to scan a phantom and an in-vivo brain. An equation representing the effective b value of the applied pulse sequence (MSME) was developed to estimate the attenuation of the signal caused by diffusion. T2 values calculated without correcting the diffusion effect showed high variability between scans with different parameter sets. After correction T2 values increased and showed excellent agreement. The method demonstrated here is generalized and can apply to different pulse sequences, it improves accuracy and stability.
Introduction
In contrast to basic NMR spectroscopy, MR imaging involves the application of additional spatial-encoding gradients as part of a pulse sequence along all three dimensions (PE, RO and SS). In high-field preclinical scanners, the gradients values can be significant, leading to amplification of diffusion weighting, and spurious attenuation of the signal. This is highly significant in spin-echo (SE) based acquisitions, whether single SE (SSE), or multi-echo SE (MESE) where the diffusion effect accumulates along the echo train.
Attempting to map T2 values on preclinical scanners is thus twice challenged: first, due to diffusion bias in SE and MESE causing consistent underestimation of T2 values; and second due to the well-known distortion of MESE protocols by stimulated and indirect echoes. This problems is further exacerbated as different parameter sets will produce different diffusion and stimulated-echoes signal bias, impairing the reproducibility of measured values.
Recently we introduced the echo modulation curve (EMC) algorithm, it can efficiently overcome these limitations to produce accurate T2 values, which are moreover reproducible across scanners and scan settings 1.
In this work we implement diffusion correction of SE and MESE protocol data, allowing to unravel the true and unbiased T2 values of the tissue.
Methods
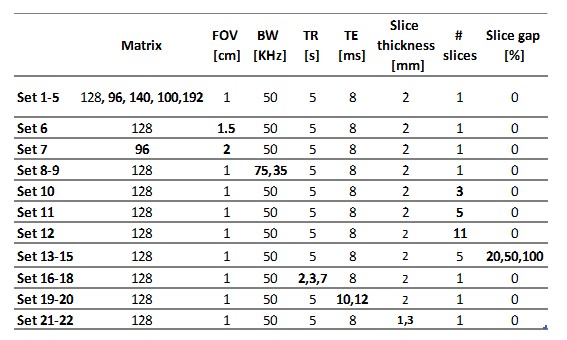
Two experiments were performed, one imaging a phantom and an in-vivo scan of a rat’s brain. The phantom, consisted of 6 compartments filled with concentrations of MnCl2 ranged from 0.04 mM to 0.5 mM was imaged on a 9.4T Bruker Biospin. Conventional SSE and MSME sequences were used with varied parameters (see table 1).
The equation representing the effective b value of the applied pulse sequence (MSME) was developed and with the diffusion coefficient, produced an estimation of the signal attenuation caused by diffusion:
$$$\frac{S(g)}{S_0}=E=\exp^{-\gamma^2DI}$$$ where $$$I=\int_{0}^{t}(\int_{0}^{t'}g^*(t'')dt'' )^2 dt'$$$ and $$$g^*$$$ is the effective gradient sequence2.
The acquired signals were corrected accordingly. The phantom’s ADC value was taken from the literature as the diffusion coefficient of water, 2.3 x 10⁻⁵ cm2/s 3. SSE data was fitted exponentially and the EMC algorithm was used to fit the MSME data and acquire T2 values.
The in-vivo scan was conducted on a 7T Bruker Biospec. Conventional MSME protocol with high resolution scan parameters were chosen. As before, results were fitted using the EMC algorithm after the attenuation due to diffusion was corrected.
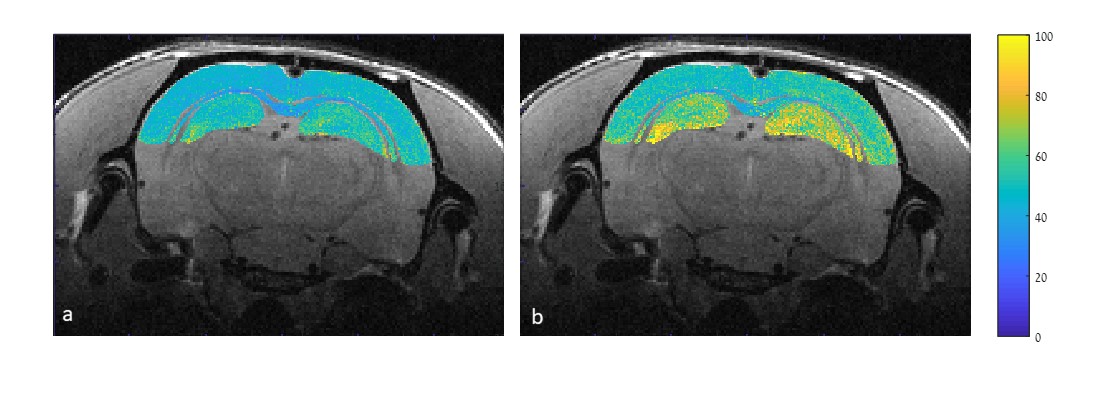
Three areas of the brain were segmented: the cortex, corpus callosum and the hippocampus with ADC values of 0.64 x 10⁻⁵ cm2/s 4, 0.70 x 10⁻⁵ cm2/s and 0.9245 x 10⁻⁵ cm2/s 5. T2 maps of the segmented areas were computed, with and without correction of the diffusion effect.
Results
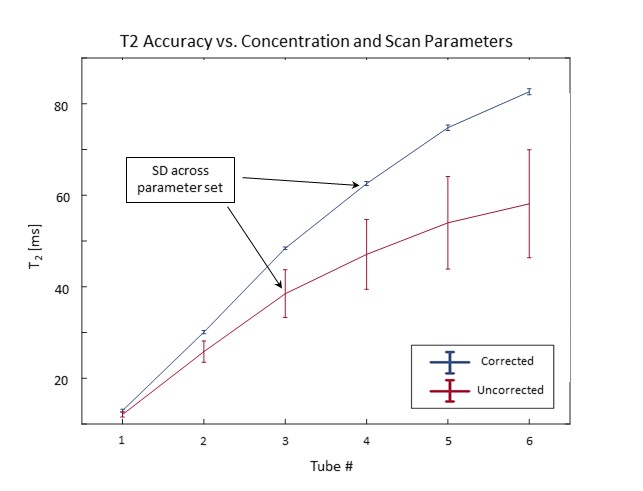
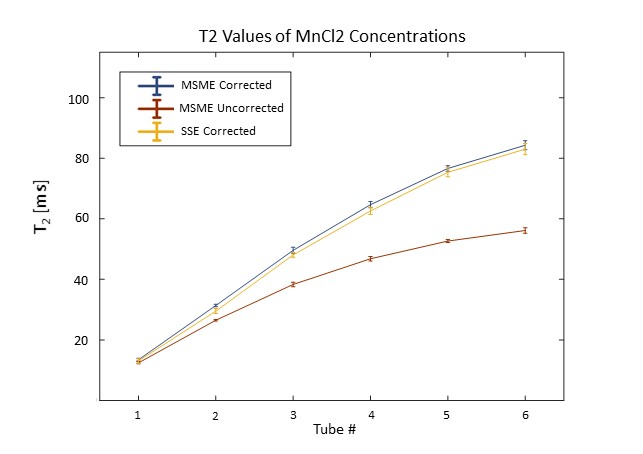
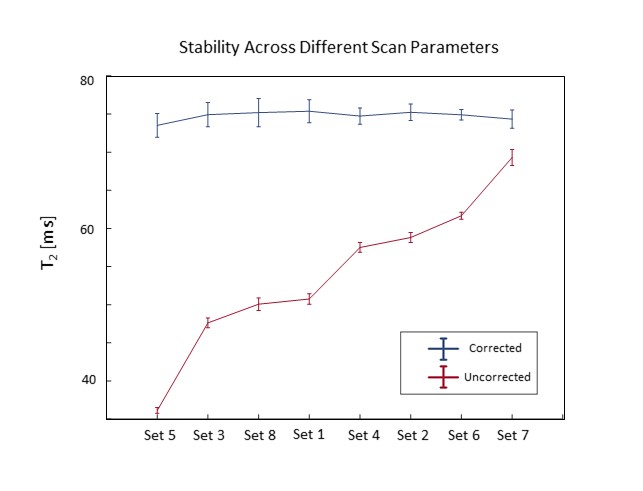
Uncorrected T2 values calculated from both the SSE and MSME data without taking into account the influence of diffusion showed high variability between scans with different parameter sets, as expected high resolution led to lower T2 values. After correcting the effect of diffusion, T2 values increased, became consistent and showed excellent agreement. The coefficient of variance was reduced to less than 1%.
In vivo results showed considerable rise in T2 values after the effect of diffusion was evaluated and corrected. In the hippocampus, T2 values were raised by more than 20% (it had the highest ADC of the segmented tissues).
Conclusion
Diffusion has a clear effect on qT2 measurements especially in high resolutions. In order to minimize this effect, the applied pulse sequence and gradients must be examined to produce a more accurate calculation of the attenuated magnetization. Implementing this in qT2 will improve to both the accuracy of measurements and their stability.Discussion
Diffusion clearly influence pre-clinical testing as they are done in high-field scanners. The method demonstrated here is generalized and can apply to different pulse sequences. Further examination of the effect on in-vivo data is required and how it comes into play with other parameters that affect in-vivo scans.
Looking into the future, next generation scanners will have stronger magnetic fields and higher resolutions. The effects of diffusion will be more significant and it is important to quantify them as accurately as possible.
Acknowledgements
ISF 2009/17References
1. Shepherd TM, Kirov II, Charlson E, Bruno M, Babb J, Sodickson DK, Ben-Eliezer N. New rapid, accurate T2 quantification detects pathology in normal-appearing brain regions of relapsing-remitting MS patients. NeuroImage: Clinical. 2017 Jan 1;14:363-70.
2. Callaghan PT. Translational dynamics and magnetic resonance: principles of pulsed gradient spin echo NMR. Oxford University Press; 2011 Sep 15.
3. Holz M, Heil SR, Sacco A. Temperature-dependent self-diffusion coefficients of water and six selected molecular liquids for calibration in accurate 1H NMR PFG measurements. Physical Chemistry Chemical Physics, Vol. 2, 4740–4742 (2000). DOI: 10.1039/B005319H
4. Yuen N, Anderson SE, Glaser N, Tancredi DJ, O'Donnell ME. Cerebral blood flow and cerebral edema in rats with diabetic ketoacidosis. Diabetes. 2008 Jul 11.
5. López-Larrubia P, Cauli O. Alterations of apparent diffusion coefficient (ADC) in the brain of rats chronically exposed to lead acetate. Toxicology. 2011 Mar 15;281(1-3):1-6.
Figures