3211
MRI Discriminates between the Aged and Aged Diabetic Brain of Rats1Henry Ford Hospital, Detroit, MI, United States, 2Oakland University, Rochester, MI, United States
Synopsis
Aging and diabetes both affect brain structure and physiology. To distinguish changes in brain induced by normal aging from diabetes in the aging brain, MRI measurements were performed on three groups of young, aged non-diabetic and correspondingly aged diabetic rats. MRI measurements, i.e., T1, T2, CBF, CE-T1WI, MD, FA, MK and Entropy were performed. Our data indicate that select MRI metrics FA of white and grey matter, and combination of T1 and T2 of grey matter are able to discriminate cerebral changes caused by aging and age-equivalent diabetes.
Introduction
Aging is known to increase the prevalence of metabolic disorders such as diabetes.1 Diabetes is also a recognized cause of accelerated aging.1 However, the mechanisms linking diabetes and aging are not well understood.1, 2 The central commonalities between diabetes-induced and age-related CNS changes have led to the hypothesis of advanced brain aging in diabetic patients.3 Therefore, being able to distinguish CNS changes caused by normal aging from diabetes would provide insight into how the aging brain interacts with diabetes, which may impact the management of older patients with diabetes.Materials and Methods
Type 2 diabetes mellitus (T2DM) was induced in male Wistar rats 13 months of age by single intraperitoneal injection of both 210 mg/kg of nicotinamide (NTM) and 60 mg/kg of streptozotocin (STZ). Rats with non-fasting plasma glucose concentrations >250 mg/dL at 2 weeks later were selected (n=10) and are referred to as diabetic rats. These rats were subjected MRI scan at an average of 1.5 months after STZ-NTM administration. This rat model of T2DM produces non-insulin dependent diabetic syndromes that resemble human T2DM.4, 5 A group (n=10) of age-matched (14-15 months) healthy older male Wistar rats (referred as aged rats) and a group (n=10) of young healthy adult (250-300g, 2-3 months) male Wistar rats (referred as young rats) along with the T2DM rats were subjected to MRI evaluation. MRI scans were performed with a 7T system. During MRI scans, rats were anesthesized using medical air (1.0L/min) with isoflurane (1.0-1.5%). Three dimensional variable flip angle (2°, 5°, 10°, 15°, 20°, 25°) spoiled gradient recalled echo sequence was used for in vivo T1 mapping.6 T2 mapping was acquired using a multi-slice and multi-echo (6 echoes: TE as 15ms and equally to 90ms) T2-weighted imaging sequence. Contrast enhanced T1-weighted imaging (CE-T1WI) consisted of two T1WIs, prior to and 6 minutes after tail vein injection of Gd-DTPA. Cerebral blood flow (CBF) was estimated using perfusion MRI by employing a pulsed arterial spin labeling technique, PICORE Q2TIPS.7, 8 Diffusion measures included q-ball imaging were performed using 64 directions of diffusion gradients with b=1500s/mm2 and diffusion kurtosis imaging (DKI) using 20 directions of diffusion gradients with b=900 and 1800s/mm2, respectively.9, 10 All metric maps, i.e. T1, CBF, CE-T1WI, FA (fractional anisotropy), Entropy, MD (mean diffusivity) and MK (mean kurtosis), were co-registered with the T2 map slice by slice. MRI measurements of the cortex provided metrics of grey matter, and the corpus callosum metrics of white matter. Data analysis was performed in a blinded fashion. Analysis of variance was performed.Results
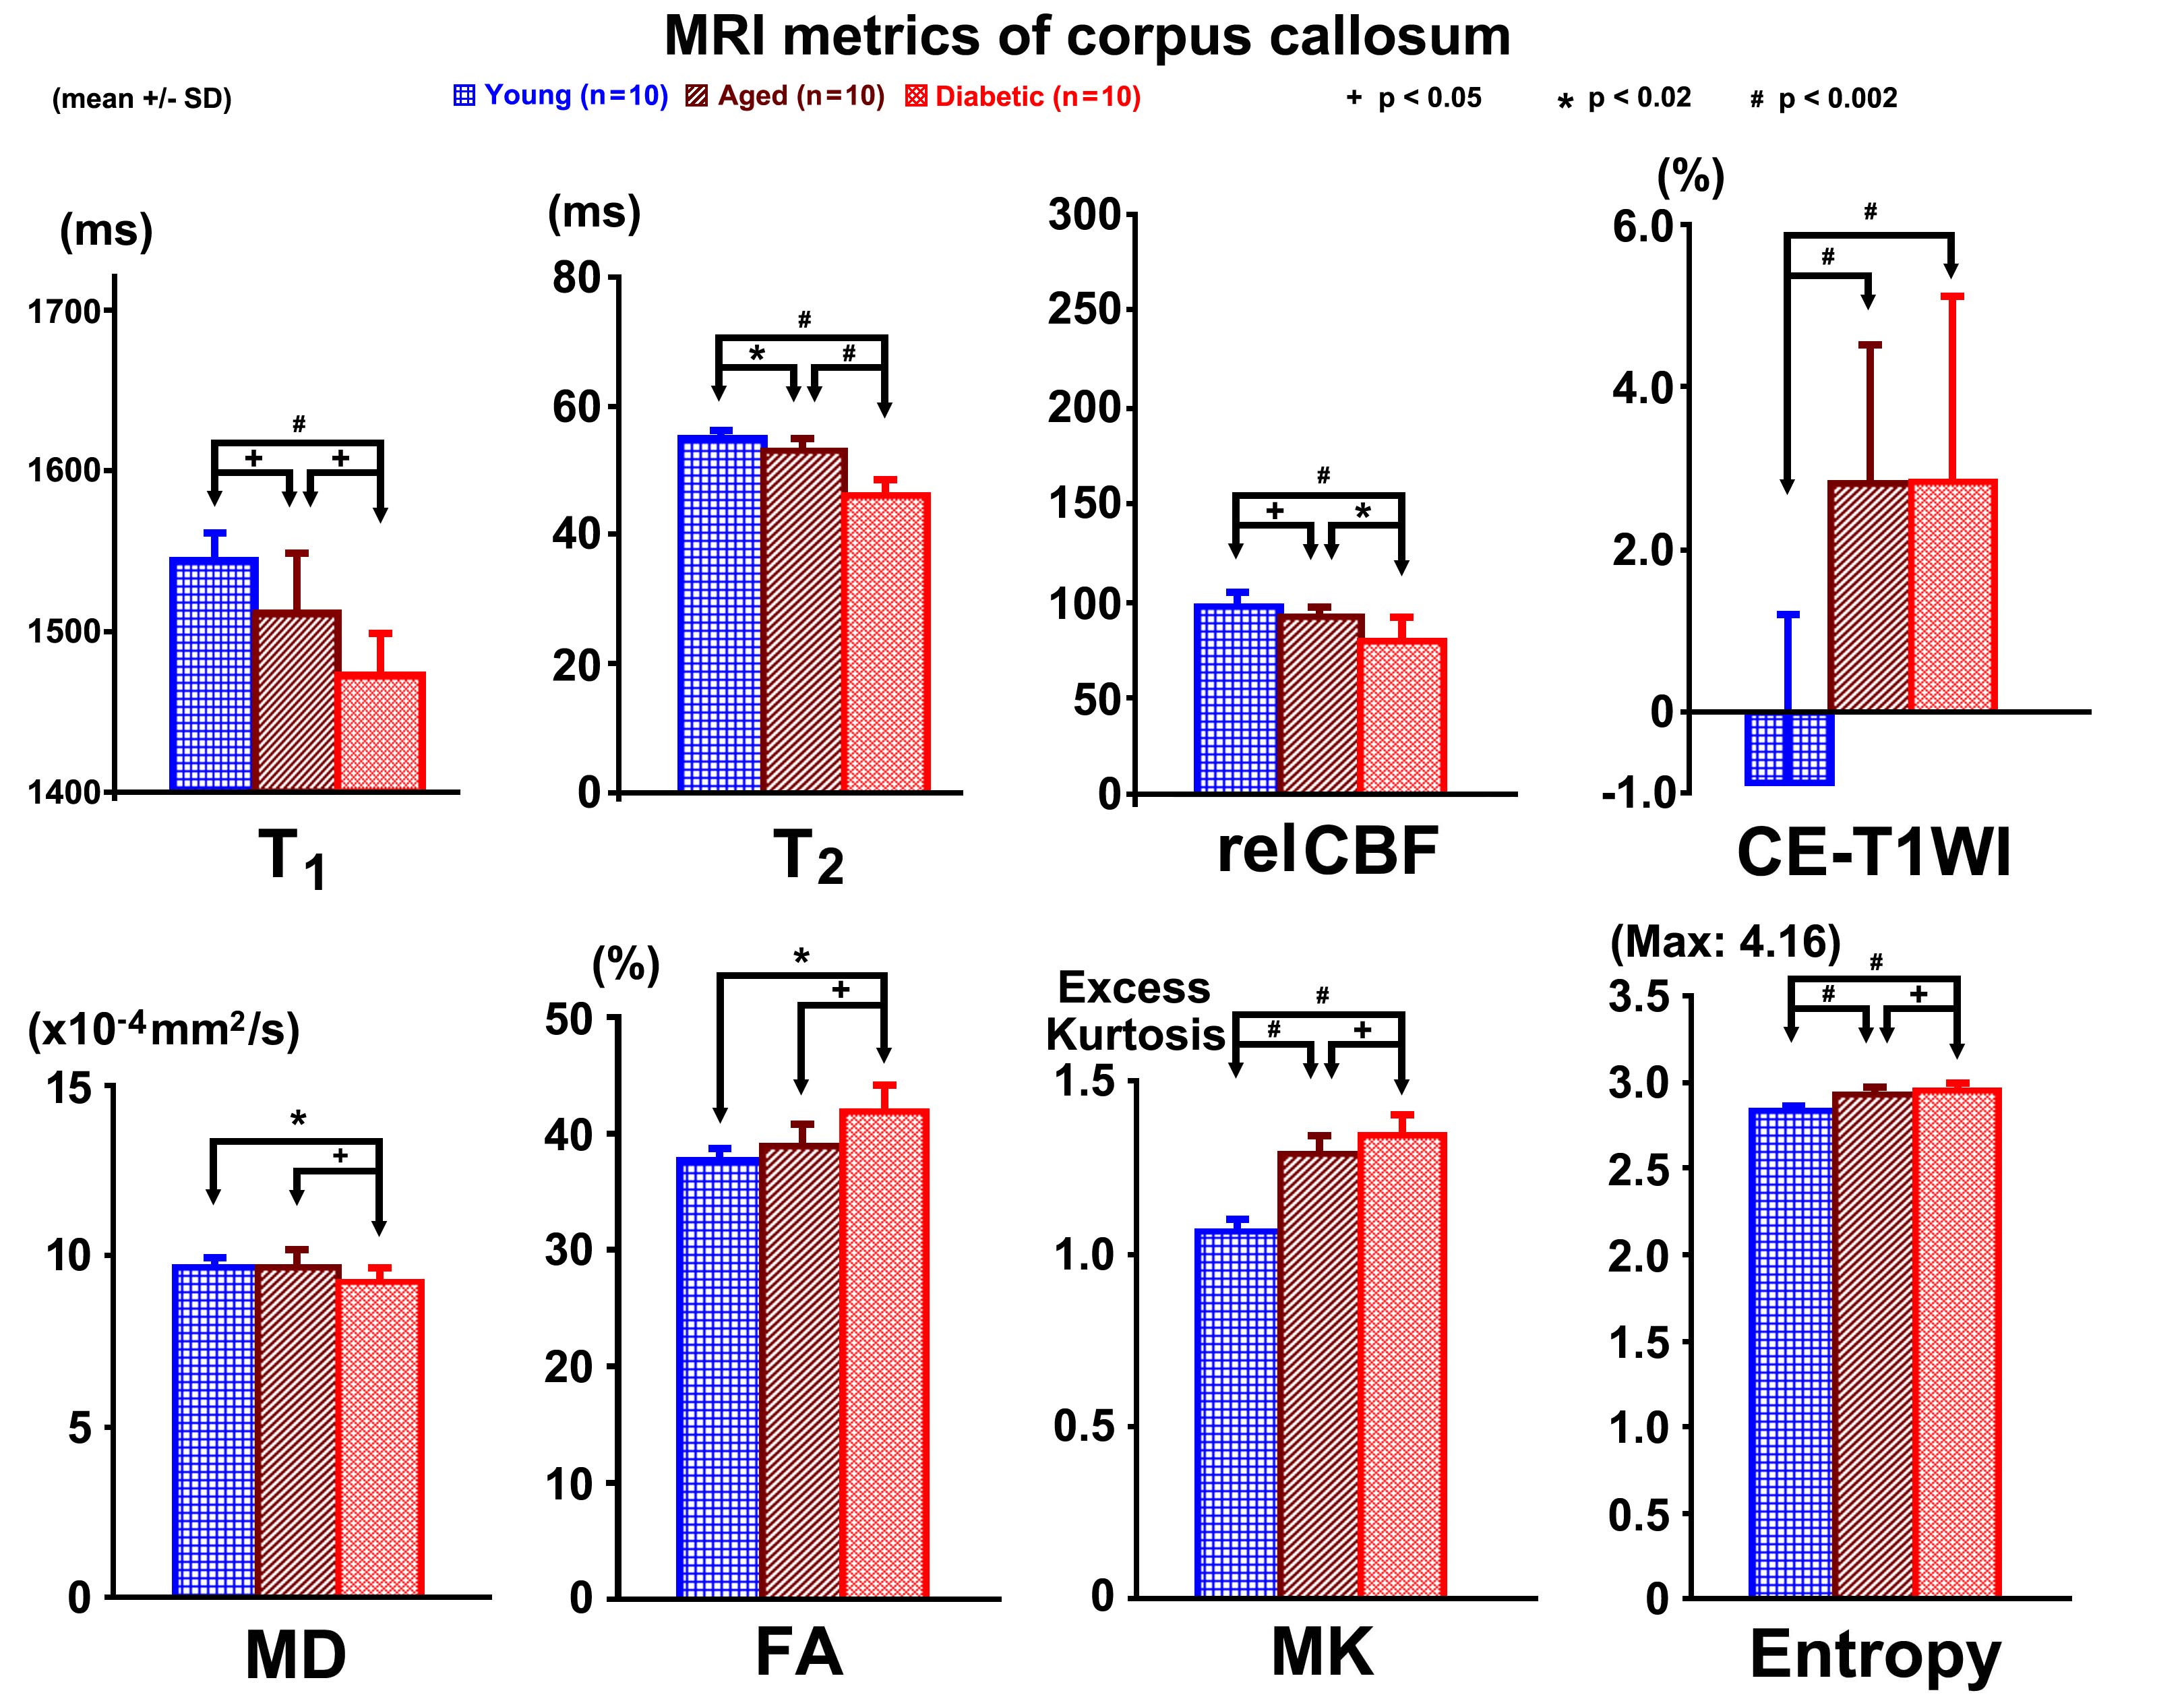
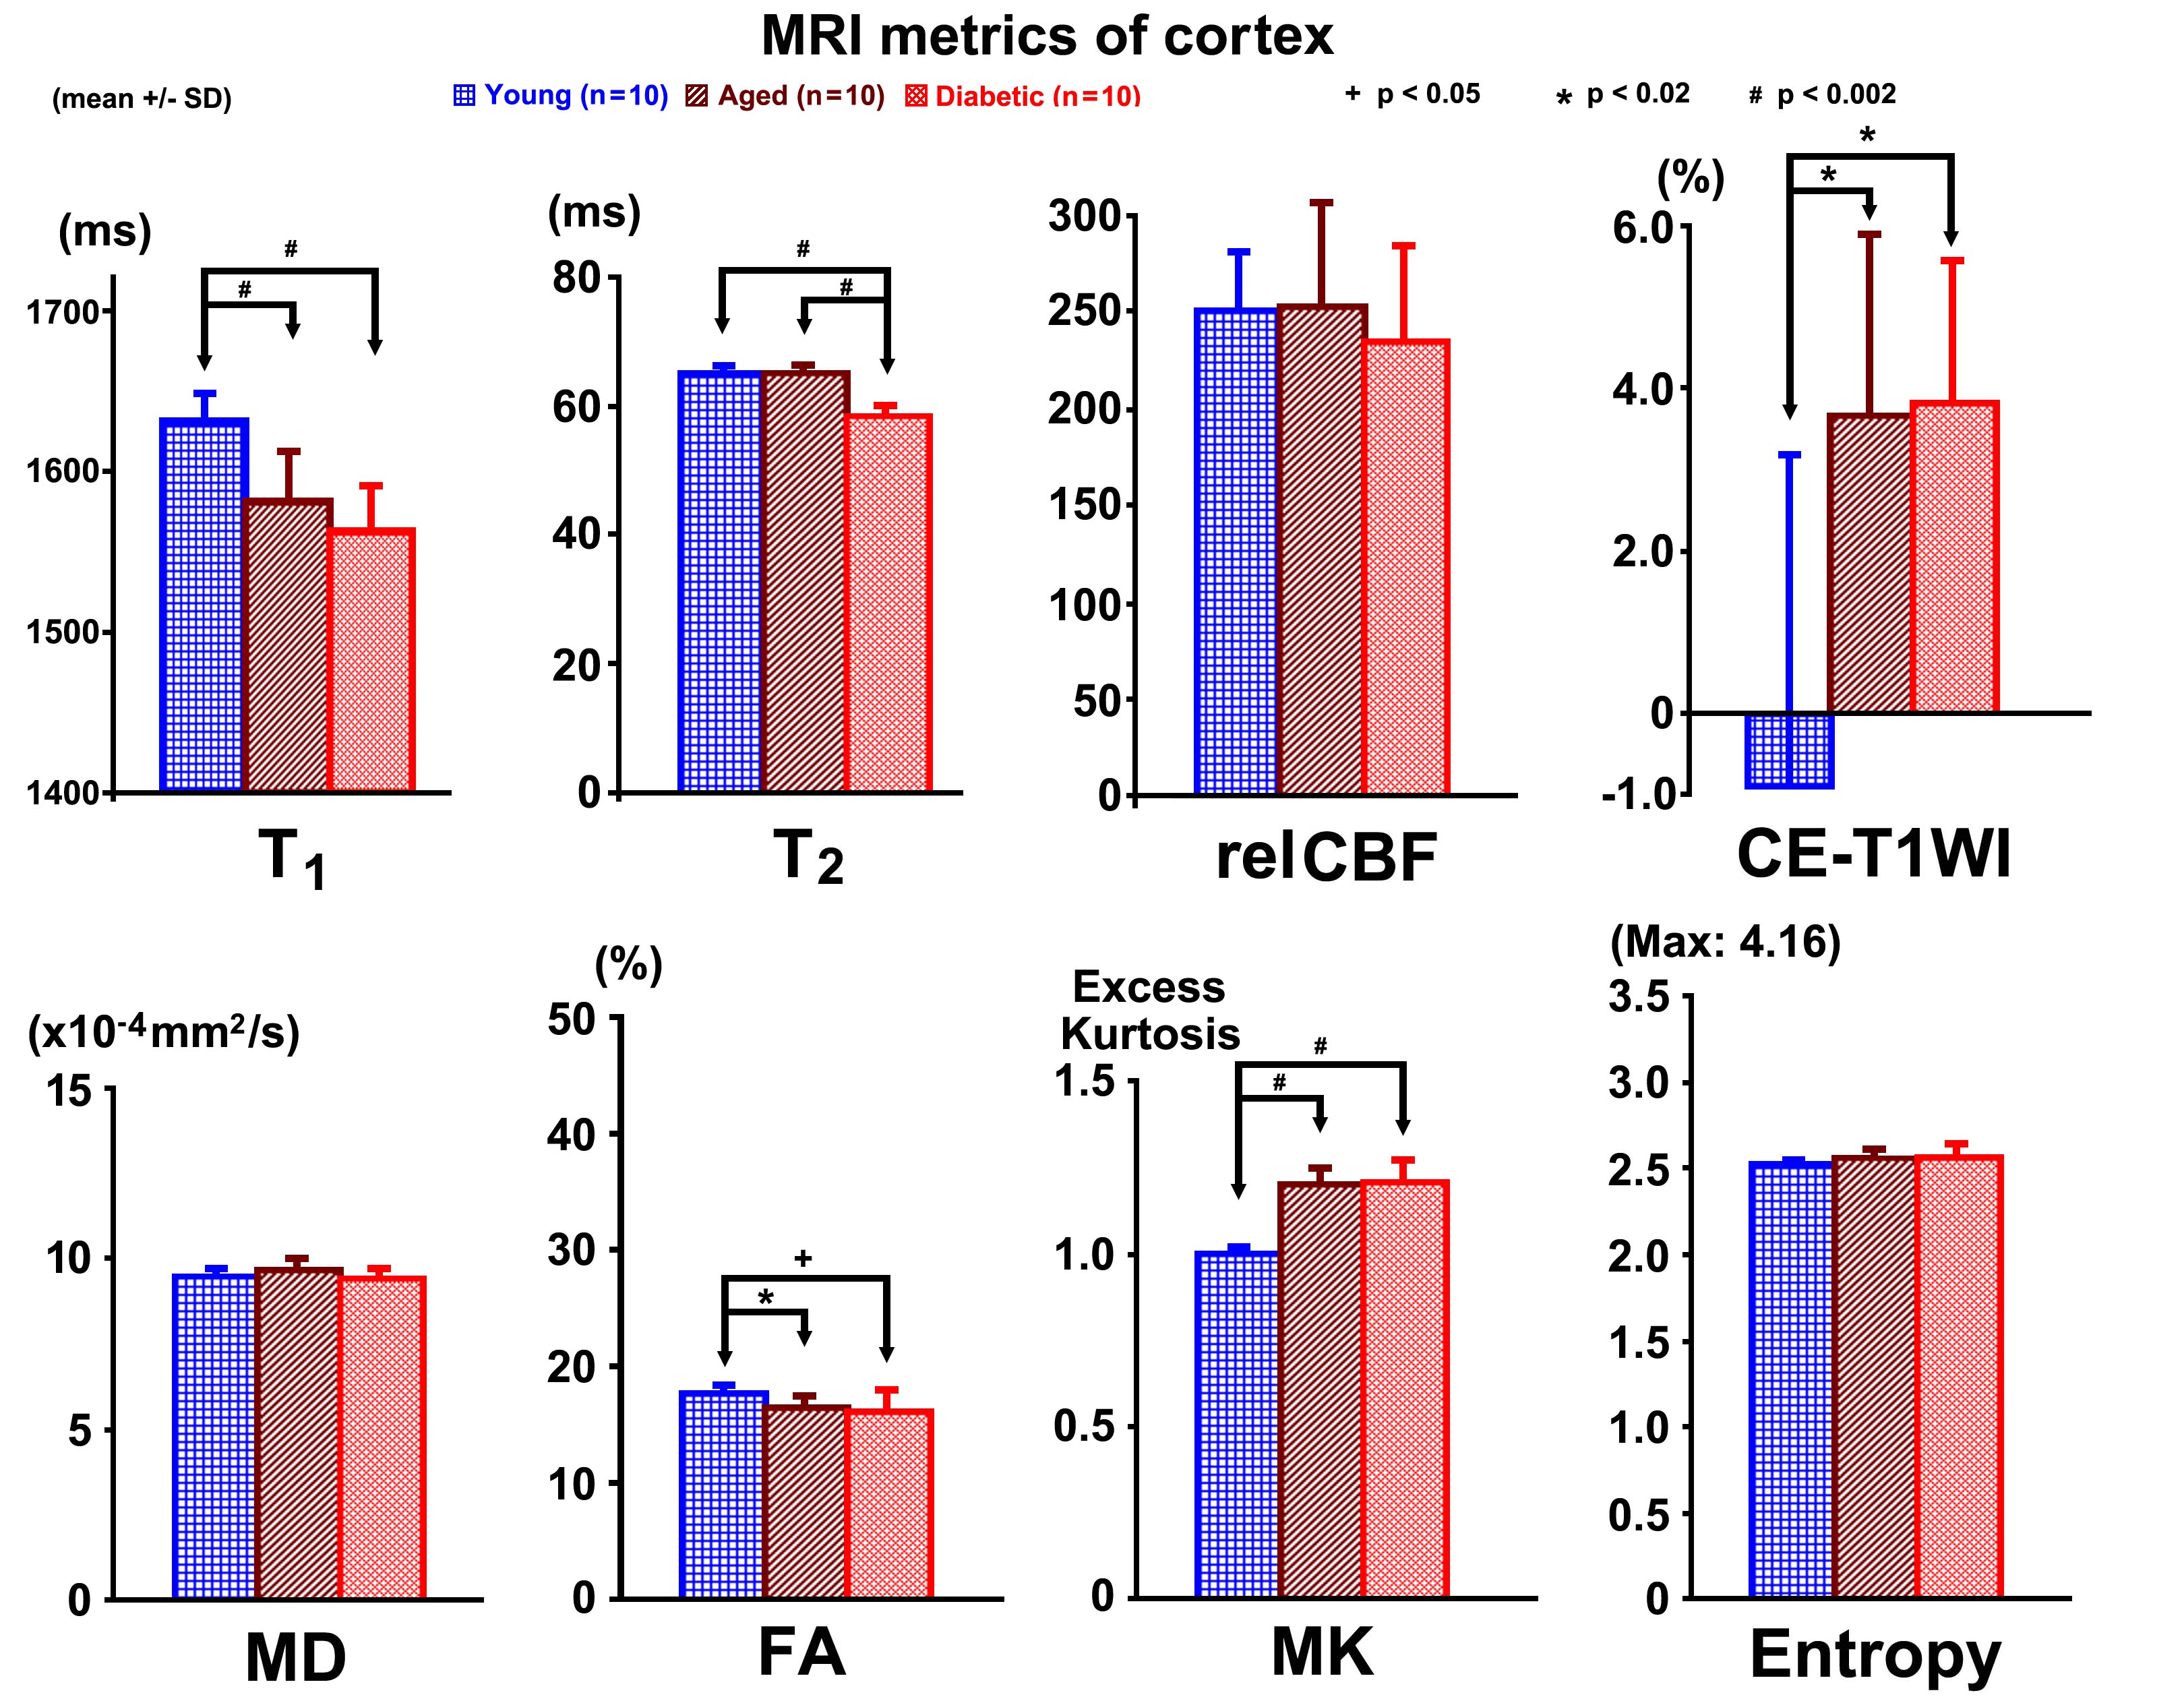
MRI measurements, as shown in figure 1 and figure 2, of white matter (corpus callosum) and grey matter (cortex) demonstrated heterogeneous significant differences (p<0.05) for all eight metrics. In general, metrics of white matter are more sensitive to detect cerebral changes caused by either aging or diabetic factors than those of grey matter. CBF, MD and Entropy failed to detect any significant differences in grey matter between young, aged and diabetic rats. All MRI metrics detected white matter changes caused by aging or/and diabetes. Furthermore, except MD, FA and CE-T1WI, MRI metrics can distinguish white matter changes induced by either aging or diabetes, respectively. Interestingly, FA was able to detect diabetic changes in white matter, and changes induced by aging in grey matter.Discussion
Multiple MRI measurements were individually employed to characterize brain changes in aged and in aged diabetic brain. The differences of MRI indices in cerebral tissue caused by aging or diabetic are generally dependent on age (infant, adolescent, adult or older), region of brain tissue and duration of hyperglycemia.1 Our data indicate that FAs of white and grey matter can be used to distinguish between cerebral changes in the aged brain from those in the diabetic aged brain. In grey matter (cortex), combination of T1 and T2 can also be employed to distinguish between the diabetic cerebral changes and aging cerebral changes.Conclusion
Common MRI indices can distinguish brain changes due to normal aging from aged diabetes: by employing both white and grey matter FAs, or grey matter T1 and T2 combination.Acknowledgements
This work was financially supported by NIH RF1 AG057494, RO1 NS108463 and R21 AG052735. The content is solely the responsibility of the authors and does not necessarily represent the official view of the National Institutes of Health.References
1. Ahima RS. Connecting obesity, aging and diabetes. Nat Med. 2009;15:996-997
2. Minamino T, Orimo M, Shimizu I, Kunieda T, Yokoyama M, Ito T, et al. A crucial role for adipose tissue p53 in the regulation of insulin resistance. Nat Med. 2009;15:1082-1087
3. Wrighten SA, Piroli GG, Grillo CA, Reagan LP. A look inside the diabetic brain: Contributors to diabetes-induced brain aging. Biochim Biophys Acta. 2009;1792:444-453
4. Masiello P, Broca C, Gross R, Roye M, Manteghetti M, Hillaire-Buys D, et al. Experimental niddm: Development of a new model in adult rats administered streptozotocin and nicotinamide. Diabetes. 1998;47:224-229
5. Su HC, Hung LM, Chen JK. Resveratrol, a red wine antioxidant, possesses an insulin-like effect in streptozotocin-induced diabetic rats. American journal of physiology. Endocrinology and metabolism. 2006;290:E1339-1346
6. Trzasko JD, Mostardi PM, Riederer SJ, Manduca A. Estimating t(1) from multichannel variable flip angle spgr sequences. Magnetic resonance in medicine : official journal of the Society of Magnetic Resonance in Medicine / Society of Magnetic Resonance in Medicine. 2013;69:10.1002/mrm.24401 7. Luh WM, Wong EC, Bandettini PA, Hyde JS. Quipss ii with thin-slice ti1 periodic saturation: A method for improving accuracy of quantitative perfusion imaging using pulsed arterial spin labeling. Magn Reson Med. 1999;41:1246-1254
8. Wong EC, Buxton RB, Frank LR. Quantitative imaging of perfusion using a single subtraction (quipss and quipss ii). Magn Reson Med. 1998;39:702-708
9. Jensen JH, Helpern JA, Ramani A, Lu H, Kaczynski K. Diffusional kurtosis imaging: The quantification of non-gaussian water diffusion by means of magnetic resonance imaging. Magn Reson Med. 2005;53:1432-1440
10. Tuch DS, Reese TG, Wiegell MR, Wedeen VJ. Diffusion mri of complex neural architecture. Neuron. 2003;40:885-895
Figures