3207
Brain GABA Levels of P5 Wild Type and Fragile X Mouse Model (FMR1 KO): Comparison of Mass Spectroscopy and In vivo 1H MRS1Stanford University, Palo alto, CA, United States
Synopsis
An imbalance between excitatory glutaminergic and inhibitory GABAergic processes is one of the leading hypotheses for fragile X syndrome. We investigated GABAergic differences by measuring brain GABA levels of male five-day-old mouse pups (P5) in Wild-Type (WT) and Fragile X knockout (FMR1 KO) models. .. Ex vivo mass spectrometry detected thalamus and frontal differences in both WT and FMR1 KO models and lower GABA levels in the FMR1 KO animals. In vivo 1H spectra at 7T found similar regional GABA differences between thalamus- and frontal-rich regions, but was unable to detect Wild-Type versus FMR1 KO differences.
Introduction
Fragile X Syndrome (FXS), a well-known single-gene defect exhibiting significant symptom overlap with Autism Spectrum Disorder (ASD), is caused when the FMR1 gene is silenced, leading to the absence of fragile X mental retardation protein (FMRP). FXS is characterized by various phenotypes such as cognitive impairment, seizures, and anxiety (1,2). An imbalance between excitatory glutamatergic and inhibitory GABAergic systems is one of the leading hypotheses for these deficits (3, 4). The availability of a fragile X murine model (FMR1 KO), provides an opportunity for studying endogenous GABA levels in various brain regions during neurodevelopment. We used liquid chromatography-mass spectrometry (LC-MS) to evaluate GABA levels in homogenates of frontal cortex and thalamus of P5 FMR1 KO and Wild-Type (WT) mice, and compared these findings with in vivo 1H spectroscopy.Materials and Methods
All animal experiments were carried out in accordance with the guidelines set out by the local Animal Care Committee of Stanford University, with animals having access to food and water ad libitum and kept under a 12 h light/dark cycle. Mass spectroscopy was performed on P5 WT(N=5) and FMR1 KO (N=5) frontal cortex and thalamus homogenates separately. For LC-MS experiments, brains were harvested from mice sacrificed via cervical dislocation. The frontal cortex and thalamus were collected in microfuge tubes, immediately frozen on dry ice and homogenized in PBS at a concentration 150 µL PBS per gram of tissue. The analyte was extracted using ethyl acetate. The samples were ionized via electrospray (ESI) with the instrument was operating in the positive mode using selected reaction monitoring (SRM). The components of the sample were chromatographically separated on the RP C18 column and then analyzed using Quattro Premier triple quadrupole mass spectrometer coupled to an HP1100 HPLC system. Data were normalized to protein concentration for each sample. 1H MRS experiments were performed on anesthetized male P5 ± 1 day WT (N=10) and FMR1 KO (N=5) mice using a Bruker 7T animal MR scanner using a cryogenically cooled RF surface coil (CryoProbe, Bruker Instruments). Mice were anesthetized with a mixture of ketamine (50 mg/kg) + dexmedetomidine (1 mg/kg), and body temperatures were maintained at 37°C for the duration of scan. We performed in vivo single-voxel spectroscopy using the PRESS sequence (with Vapor and out-of-volume water-suppression) on thalamus-rich and frontal-rich regions-of-interest (ROIs) of mouse brain with the following parameters: 2x2x2 mm3 voxels, TE = 16 ms, TR = 3000 ms, spectral bandwidth = 5000 Hz, and 256 averages. Finally, an unsuppressed-water spectrum was acquired from each voxel for B0 and eddy current corrections.Results and Discussion
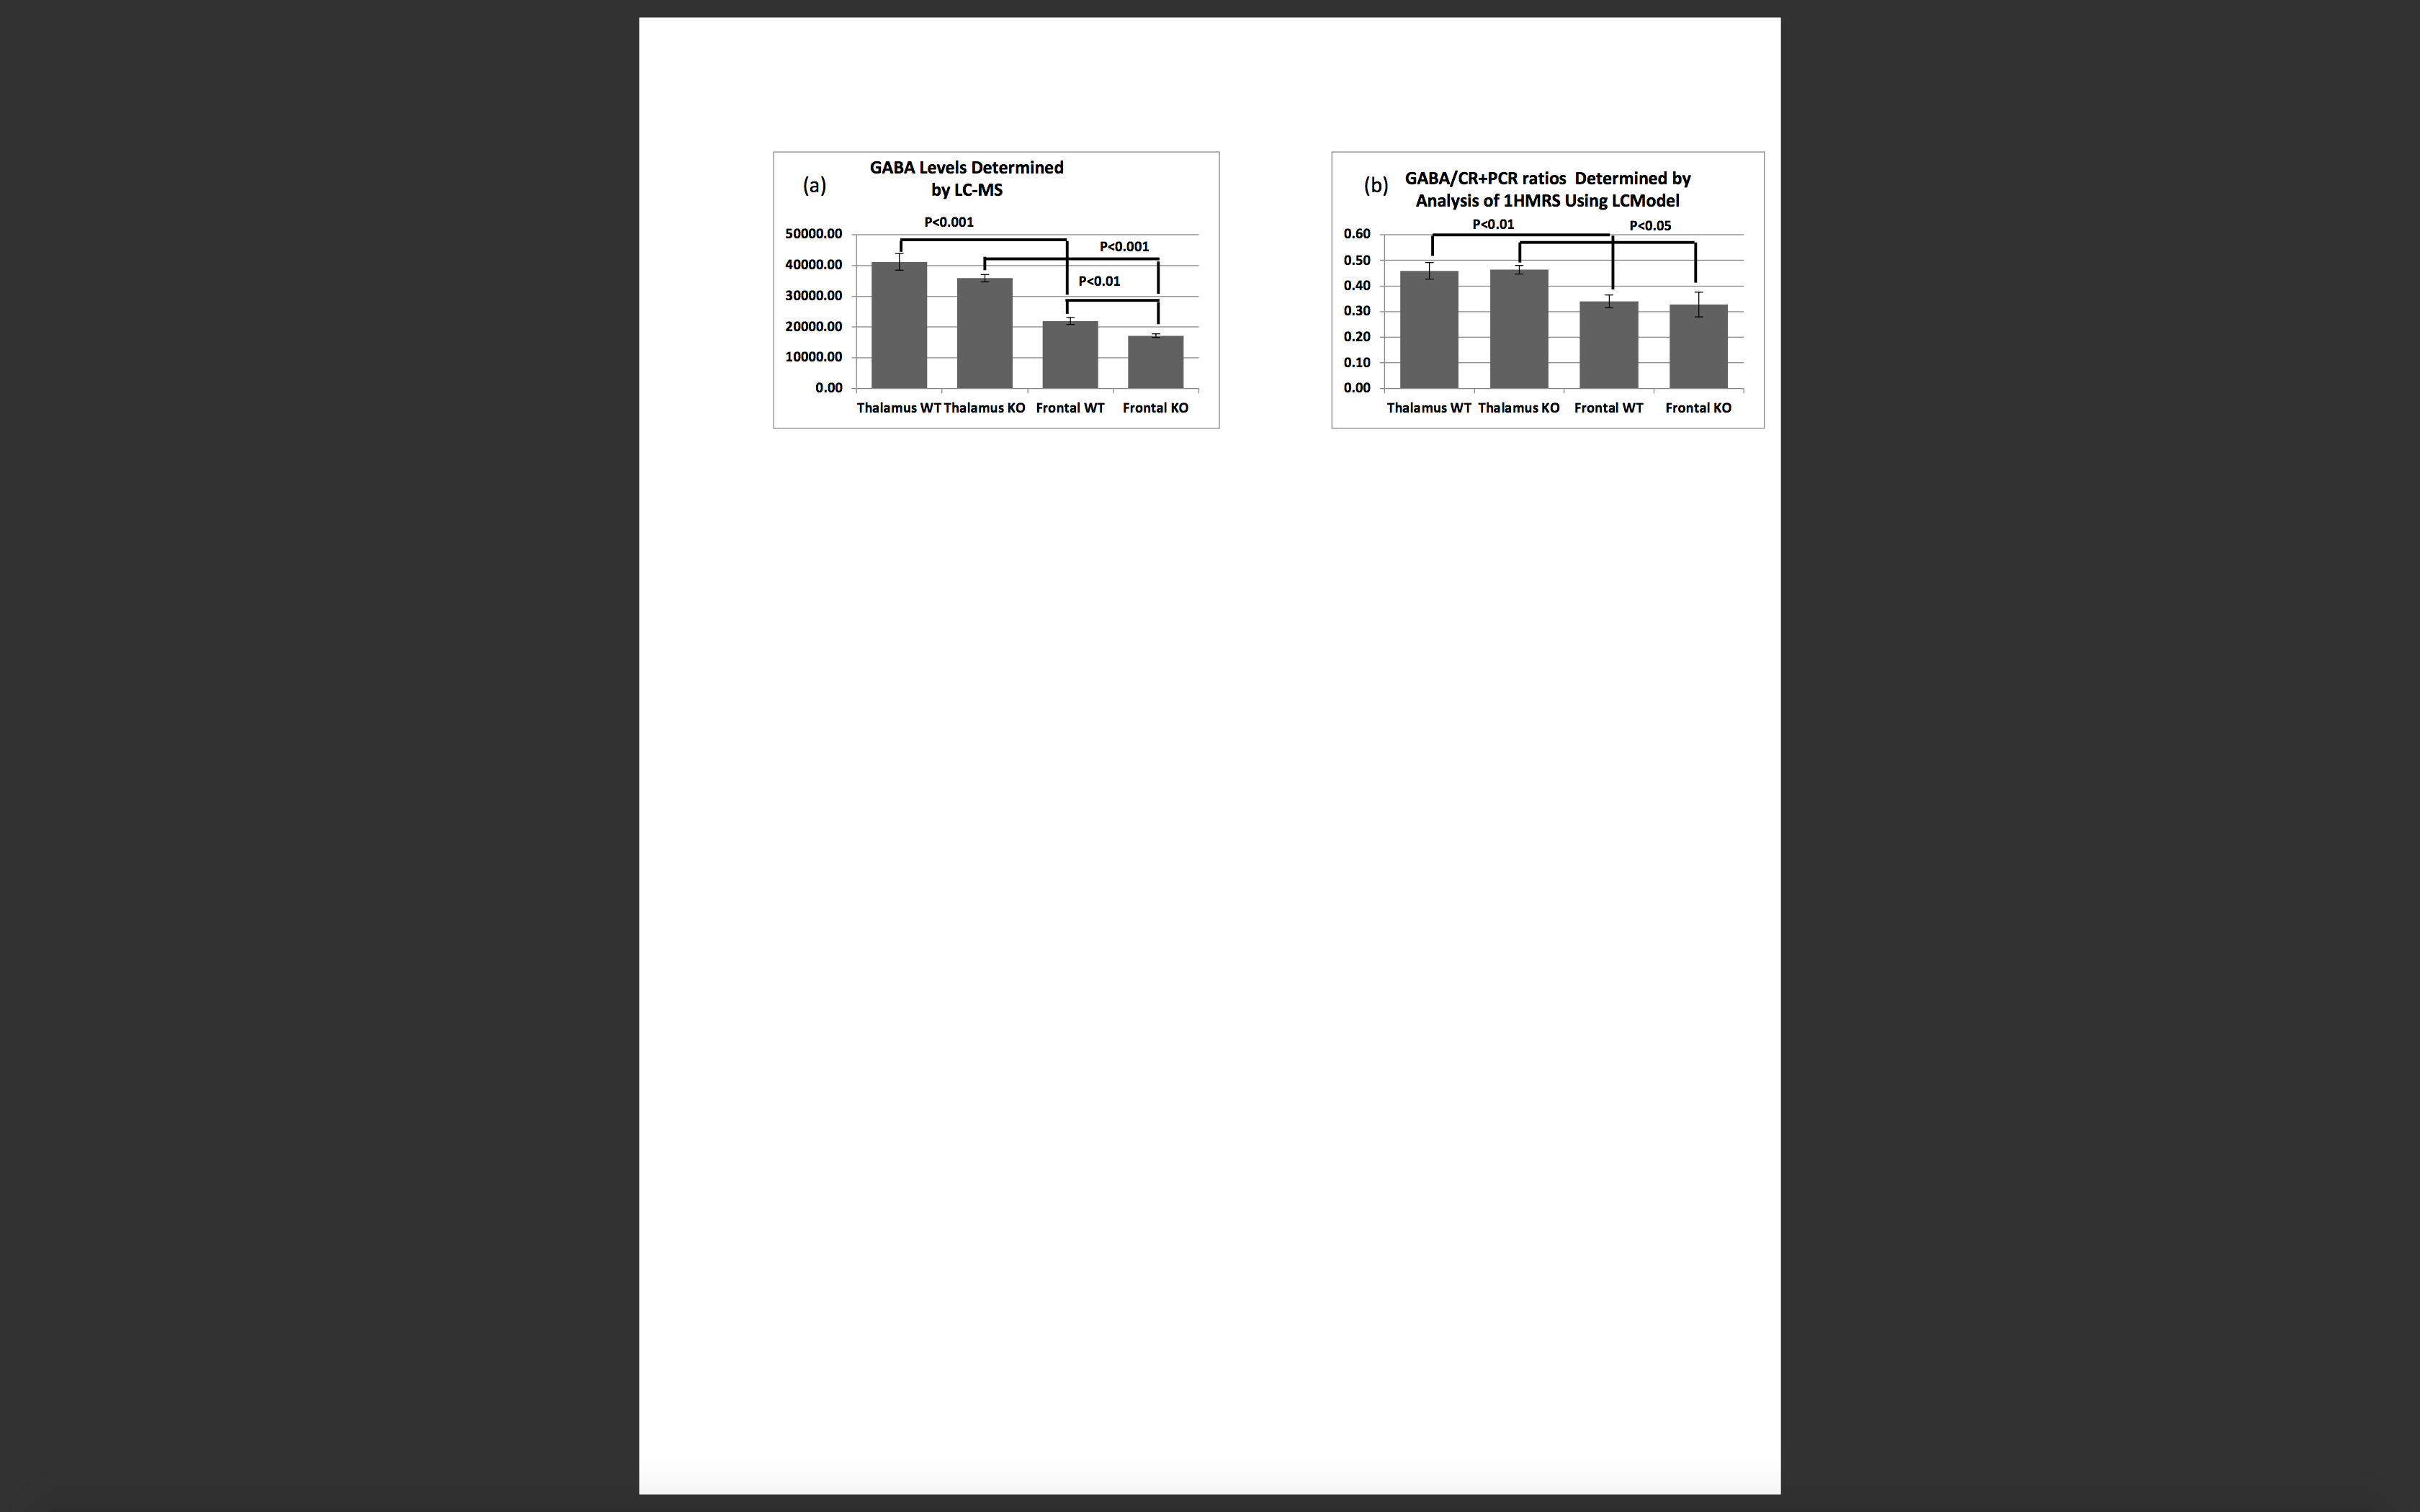
Figure 1 (a) compares the normalized GABA levels in thalamus and frontal cortex of P5 WT and FMR1 KO mice measured using LC-MS, and (b) shows 1H MRS GABA/CR+PCR ratios from thalamus and frontal-rich ROIs as quantified using LCModel software. LC-MS measured GABA levels in thalamus (WT: 41196.13±2713.31, KO: 35865.66±1183.88, mean ± S.E) were significantly higher than frontal cortex (WT: 21967.57±1131.19, KO: 17190.15±601.15) both for WT (p<0.0001) and FMR1 KO (p<0.0001) mice in the same animal within each cohort using paired t-test. LC-MS also detected significantly lower frontal cortex GABA levels in the KO as compared to WT animals (WT: 21967.57±1131.19, KO: 17190.15±601.15, p<0.01). 1H-MRS findings show similarly higher GABA levels between thalamus-rich (WT: 0.46±0.03, KO: 0.46±0.02) and frontal-rich (WT: 0.34±0.03, KO:.33±0.05) ROIs both in WT (p<0.01) and KO (p<0.05) mice in the same animal within each cohort using paired t-test. However, 1H-MRS failed to detect difference between the WT and KO animals.Conclusions
Our study was the first to detect statistically significant differences in frontal cortex GABA levels in P5 WT and FMR1 KO mice using LC-MS. In vivo 1HMRS was promising by detecting regional differences between thalamus and frontal regions within the same animal, however it failed to detect differences between WT and KO mice. Improvement in SNR and using higher magnetic fields may help to overcome the limitations of this study.Acknowledgements
NIH grants P41EB015891, R01MH110683, and R01HD084214, NICHD R01 HD084214, The Ben & Catherine Ivy FoundationReferences
1- Lozano R, Rosero CA, Hagerman RJ. Intractable Rare Dis Res. 2014;3(4):134–146.
2- Kidd SA, Lachiewicz A, Barbouth D, et al. Pediatrics. 2014;134(5):995–1005.
3- Gatto CL, Broadie K. Front Synaptic Neurosci. 2010;2:4.
4- Erickson CA, Davenport MH, Schaefer TL, et al, J Neurodev Disord. 2017 Jun 12;9:7
Figures