3203
Effects of daily high and low frequency low-intensity repetitive transcranial magnetic stimulation in rats: A longitudinal rs-fMRI study1Experimental and Regenerative Neurosciences, The University of Western Australia, Crawley, Australia, 2Brain Plasticity Group, Perron Institute for Neurological and Translational Research, Nedlands, Australia, 3Centre for Microscopy, Characterisation and Analysis, The University of Western Australia, Nedlands, Australia, 4School of Veterinary and Life Sciences, Murdoch University, Murdoch, Australia
Synopsis
Repetitive transcranial magnetic stimulation (rTMS), a novel non-invasive brain stimulation technique, has been shown to modulate dysfunctional brain networks in humans. However, despite anecdotal evidence that rTMS effects tend to wear off, there are no reports of fMRI studies, even in humans, mapping the therapeutic duration of rTMS effects. Here, we investigated the cumulative effects of daily low-intensity rTMS on rodent resting-state networks using rs-fMRI and mapped for persistence for up to three weeks. Our study confirms the frequency-specific effects of rTMS and shows that 1 Hz stimulation has milder, but longer-lasting effects on functional connectivity than 10 Hz stimulation.
Introduction
Repetitive transcranial magnetic stimulation (rTMS) is a novel non-invasive neuromodulation technique that is being applied widely in therapeutic and investigative studies of neurological and psychiatric conditions including depression 1,2, schizophrenia 3 and Parkinson’s disease 4. Compared to healthy individuals, people with neurological and psychiatric disorders have been identified with resting-state network (RSN) dysregulation 5 and several lines of evidence suggest that rTMS is able to modulate the resting brain activity and therefore alter dysfunctional RSNs.6 However, these effects tend to wear off 7,8 and there have been no reports of longitudinal MRI studies, even in humans, investigating the therapeutic duration of rTMS effects. Here, we studied the longitudinal effects of repeated low-intensity rTMS (LI-rTMS) on rodent RSNs using resting-state functional MRI (rs-fMRI).Methods
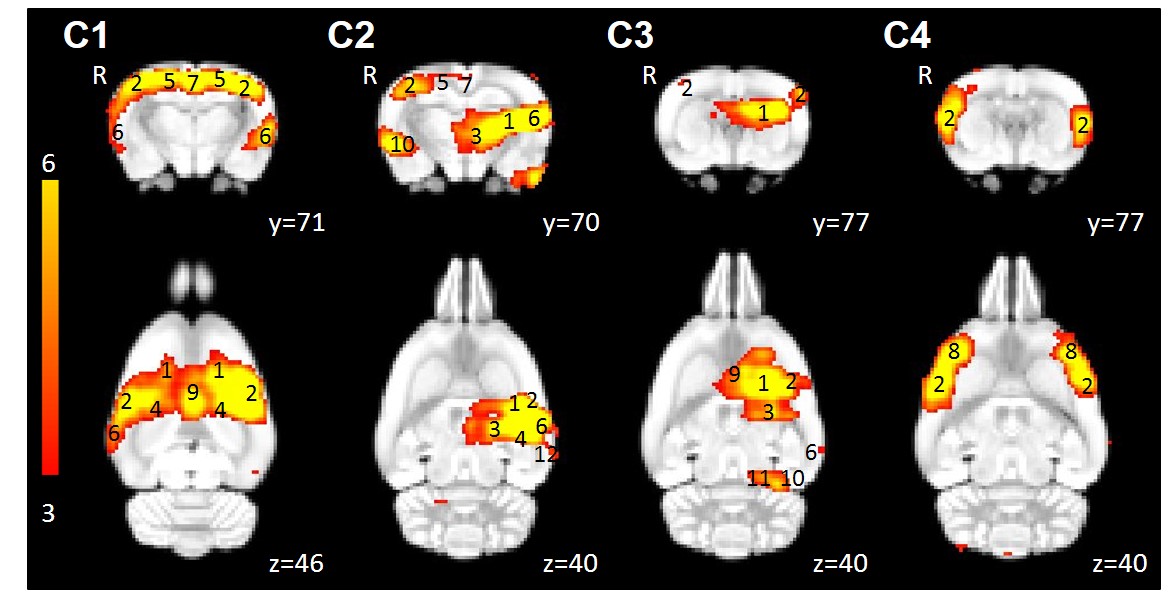
Sprague-Dawley rats received LI-rTMS for 10 minutes over the right brain hemisphere daily for 14 days using a custom-built round coil (10 Hz or 1 Hz stimulation, n=9 per group). Rs-fMRI data were acquired at 9.4 Tesla at baseline, after seven days of stimulation and after 14 days of stimulation to determine the cumulative effects of LI-rTMS. We investigated the persistence of these effects for up to three weeks by performing two more imaging sessions seven days and either 20 (10 Hz group) or 14 (1 Hz group) days after stimulation was ceased. Rs-fMRI data was acquired using single-shot EPI with 300 repetitions as described in our previous study.9 During each imaging session, the animal was under a combination of isoflurane and medetomidine anaesthesia. Baseline rs-fMRI data were analysed using the group-ICA (Independent component analysis) algorithm to identify template rodent RSNs (Figure 1) and dual-regression was used to uncover changes in the RSNs.Results and Discussion
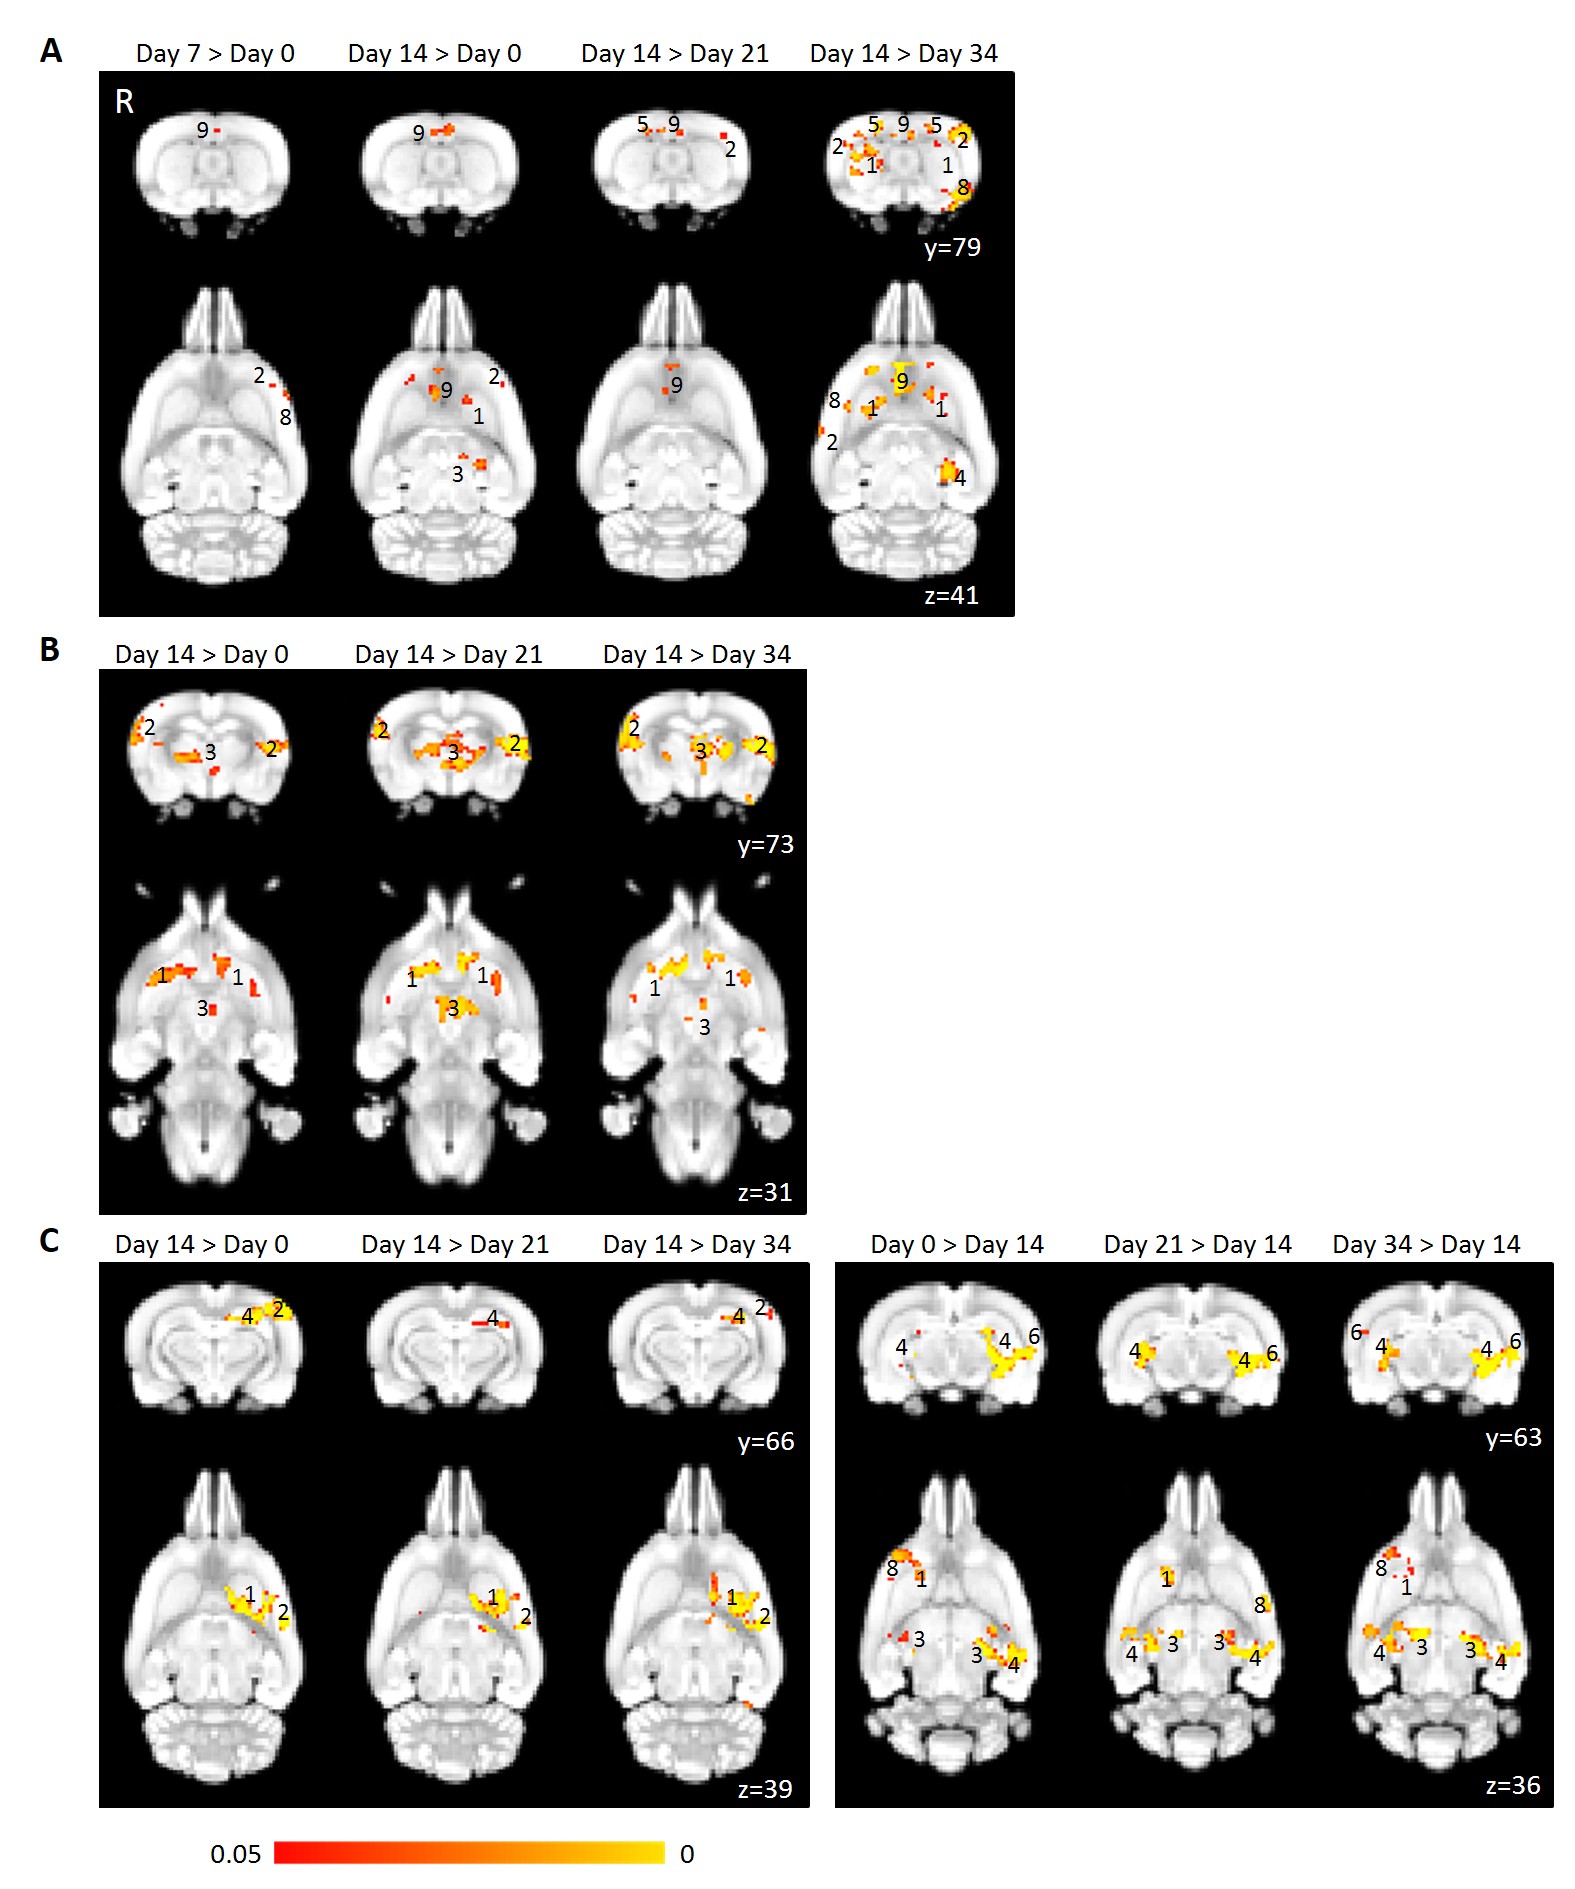
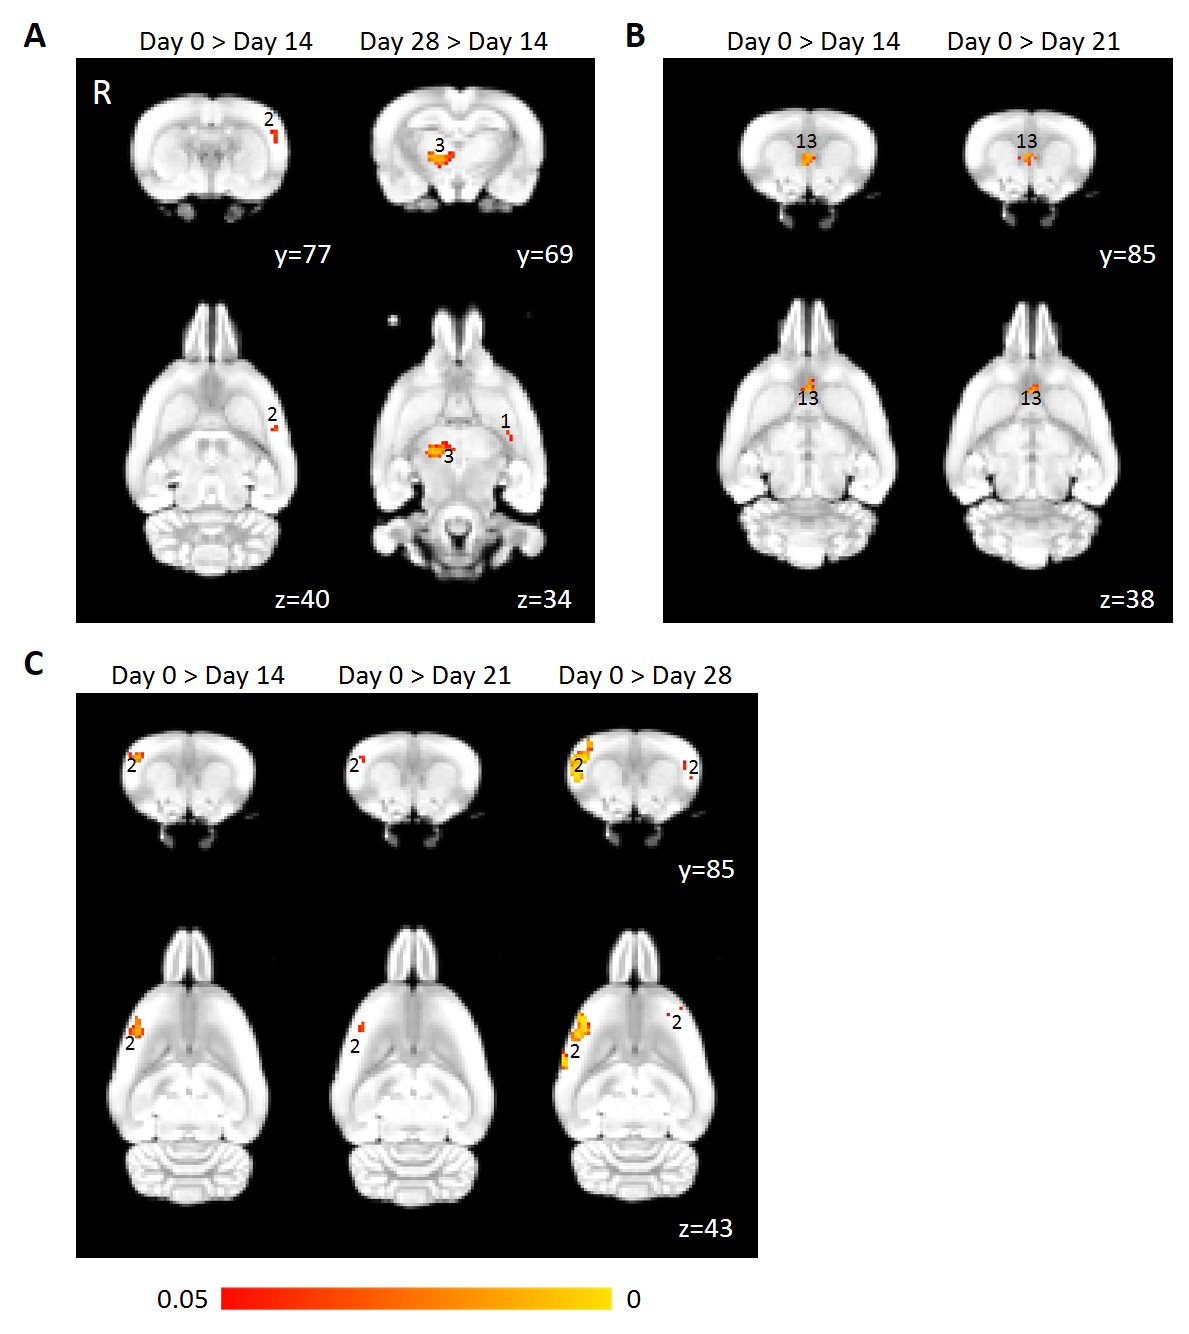
Four relevant RSNs were found by group-ICA: the interoceptive and default mode network (C1), cortico-striatal-thalamic network (C2), basal ganglial network (C3) and salience network (C4). Overall, 1 Hz stimulation had less widespread effects on functional connectivity compared to 10 Hz stimulation. The milder effect of 1 Hz LI-rTMS compared to 10 Hz LI-rTMS was also observed in our previous study looking at the immediate effect of one 10 min LI-rTMS session.9 Repeated 10 Hz stimulation induced significant potentiation of functional connectivity in C1, C2 and C3 (Figure 2) while 1 Hz stimulation significantly attenuated functional connectivity in C2, C3 and C4 (Figures 3). The differential effect-size and effect-direction between high- and low-frequency rTMS has been observed in previous studies; 10 induction of rTMS-related changes is known to be more likely with high- than low-frequency rTMS when using parameters within the safety-margins, and when changes are induced, the effect-direction is more frequently positive following high-frequency rTMS and negative following low-frequency rTMS. After cessation of stimulation, the change in connectivity in all three networks decreased gradually over a period of 20 days and dropped back to baseline levels in the 10 Hz group. In contrast, in the 1 Hz group, while the C2 connectivity increased back to baseline levels, the decrease in connectivity was sustained for at least seven days within C3. Within C4, the decrease in connectivity compared to baseline was even more widespread 14 days post-stimulation cessation than seven days post-stimulation cessation. The continuous decrease in connectivity compared to baseline following cessation of 1 Hz LI-rTMS in C4 was surprisingly strong and may be related to either a decrease in excitatory circuits or an increase in inhibitory mechanisms.Conclusion
Information about the duration of the after-effects of rTMS therapy is vital for the development and improvement of rTMS use as a treatment in a clinical setting. This study provides a framework to use brain imaging to explore the duration of LI-rTMS effects on rodent resting brain activity. To our knowledge, our results provide the first preclinical in vivo demonstration of the cumulative and post-stimulation effects of repeated LI-rTMS on rodent neuronal network dynamics. Our study confirms the frequency-specific effects of rTMS and further suggests that effects of 1 Hz stimulation, although milder, may persist longer after cessation of treatment compared to those of 10 Hz stimulation. Additionally, the decreasing connectivity changes post-cessation of 10 Hz stimulation is consistent with the widespread recommendation for regular “top up” 10 Hz rTMS treatments in patients with depression.7,11-13 Further studies in animals and humans are warranted in effort to investigate potential prolongation of functional connectivity effects through maintenance or “top-up” rTMS sessions weeks or months after the first set of treatment.Acknowledgements
The authors thank Ms Marissa Penrose-Menz, Dr Alexander Joos, Ms Katherine Fisher and Ms Michelle Carey for their assistance with the experiments. The authors acknowledge the facilities and scientific and technical assistance of the National Imaging Facility, a National Collaborative Research Infrastructure Strategy (NCRIS) capability, at the Centre for Microscopy Characterisation and Analysis, The University of Western Australia. BJS is supported by a Forrest Research Foundation Scholarship, an International Postgraduate Research Scholarship, and a University Postgraduate Award. KWF is an Australian National Imaging Facility Fellow, a facility funded by the University, State and Commonwealth Governments. JR was supported by an NHMRC Senior Research Fellowship.References
1. Xia G, Gajwani P, Muzina DJ, et al. Treatment-emergent mania in unipolar and bipolar depression: Focus on repetitive transcranial magnetic stimulation. Int J Neuropsychopharmacol. 2008;11(1):119–130.
2. Gaynes BN, Lloyd SW, Lux L, et al. Repetitive transcranial magnetic stimulation for treatment-resistant depression: A systematic review and meta-analysis. Journal of Clinical Psychiatry. 2014;75(5):477–489.
3. Dlabač-de Lange JJ, Knegtering R and Aleman A. Repetitive transcranial magnetic stimulation for negative symptoms of schizophrenia: Review and meta-analysis. J Clin Psychiatry. 2010;71(4):4411–418.
4. Arias-Carrion O. Basic mechanisms of rTMS: Implications in Parkinson's disease. Int Arch Med. 2008;1(1):2.
5. Van den Heuvel MP and Hulshoff Pol HE. Exploring the brain network: A review on resting-state fMRI functional connectivity. Eur Neuropsychopharmacol. 2010;20(8):519–534.
6. Seewoo BJ, Etherington SJ, Feindel KW and Rodger J. Combined rTMS/fMRI studies: An overlooked resource in animal models. Front Neurosci. 2018;12:180.
7. Abraham G and O'Brien S. Repetitive transcranial magnetic stimulation is useful for maintenance treatment. The Canadian Journal of Psychiatry. 2002;47(4):386–386.
8. Janicak PG, Nahas Z, Lisanby SH, et al. Durability of clinical benefit with transcranial magnetic stimulation (TMS) in the treatment of pharmacoresistant major depression: assessment of relapse during a 6-month, multisite, open-label study. Brain Stimulation: Basic, Translational, and Clinical Research in Neuromodulation.2010;3(4):187–199.
9. Seewoo BJ, Feindel KW, Etherington SJ and Rodger J. Resting-state fMRI study of brain activation using low-intensity repetitive transcranial magnetic stimulation in rats. Sci Rep. 2018;8(1):6706.
10. Thut G and Pascual-Leone A. A Review of Combined TMS-EEG Studies to Characterize Lasting Effects of Repetitive TMS and Assess Their Usefulness in Cognitive and Clinical Neuroscience. Brain Topogr. 2010;22(4):219-232.
11. Li X, Nahas Z, Anderson B, Kozel FA and George MS. Can left prefrontal rTMS be used as a maintenance treatment for bipolar depression? Depress Anxiety. 2004;20(2):98–100.
12. O'Reardon JP, Blumner KH, Peshek AD, Pradilla RR and Pimiento PC. Long-term maintenance therapy for major depressive disorder with rTMS. J Clin Psychiatry. 2005;66(12):1524–1528.
13. Wang H-N, Wang X-X, Zhang R-G, et al. Clustered repetitive transcranial magnetic stimulation for the prevention of depressive relapse/recurrence: a randomized controlled trial. Transl Psychiatry. 2017;7(12):1292.
Figures