3201
Pre- and post-symptomatic longitudinal metabolic assessment of the Twitcher mouse model of Krabbe Disease at 9.4 Tesla1Department of Medical Physics, University at Buffalo, The State University of New York, Buffalo, NY, United States, 2Buffalo Neuroimaging Analysis Center, Department of Neurology, Jacobs School of Medicine and Biomedical Sciences, University at Buffalo, The State University of New York, Buffalo, NY, United States, 3Department of Biochemistry, Hunter James Kelly Research Institute, Buffalo, NY, United States, 4Center for Biomedical Imaging at the Clinical and Translational Science Institute, University at Buffalo, The State Univeristy of New York, Buffalo, NY, United States
Synopsis
Krabbe Disease (KD) is a rare progressive globoid cell leukodystrophy caused by a deficiency of galactocerebrosidase (GALC), necessary for the metabolism of galactosylceramide and psychosine. Accumulation of these neurotoxic sphingolipids results in demyelination, neuroinflammation and ultimately death in infancy. This study aimed to investigate if localized proton magnetic resonance spectroscopy (1H-MRS) may serve as useful markers to detect pre-symptomatic metabolic alterations related to KD.
INTRODUCTION
Krabbe Disease (KD) is a rare, progressive leukodystrophy, caused by a deficiency of galactocerebrosidase (GALC), an enzyme necessary for the metabolism of galactosylceramide and psychosine. Accumulation of these neurotoxic sphingolipids results in demyelination, neuroinflammation and ultimately death in infancy. The only effective treatment for KD is pre-symptomatic Hematopoietic Stem Cell Transplant (HSCT) which is only efficacious in pre-symptomatic patients. This highlights the importance of finding a robust diagnostic tool for Krabbe disease. Furthermore, there are limited prognostic tools available to evaluate the beneficial effect of therapies like HSCT or gene therapy on patients. This study aimed to investigate if localized proton magnetic resonance spectroscopy (1H-MRS) may serve as a useful diagnostic tool to detect subtle pre-symptomatic metabolic alterations related to KD, as well as early metabolic changes in disease progression. We obtained the metabolic fingerprint of the pons region in the Twitcher (Twi) mouse, a well-validated genetic model of human Krabbe Disease. Twi mice have a well-characterized course of pathology and survive to 40-45 days. We analyzed twitcher mice at three time-points starting from a very early pre-symptomatic time point. Globoid cells and demyelination have been shown to occur throughout the nervous system, and occur particularly early in the hindbrain. The pons/brainstem area is one of the first areas in which pathology develops and in which globoid cells accumulate.13-15Methods
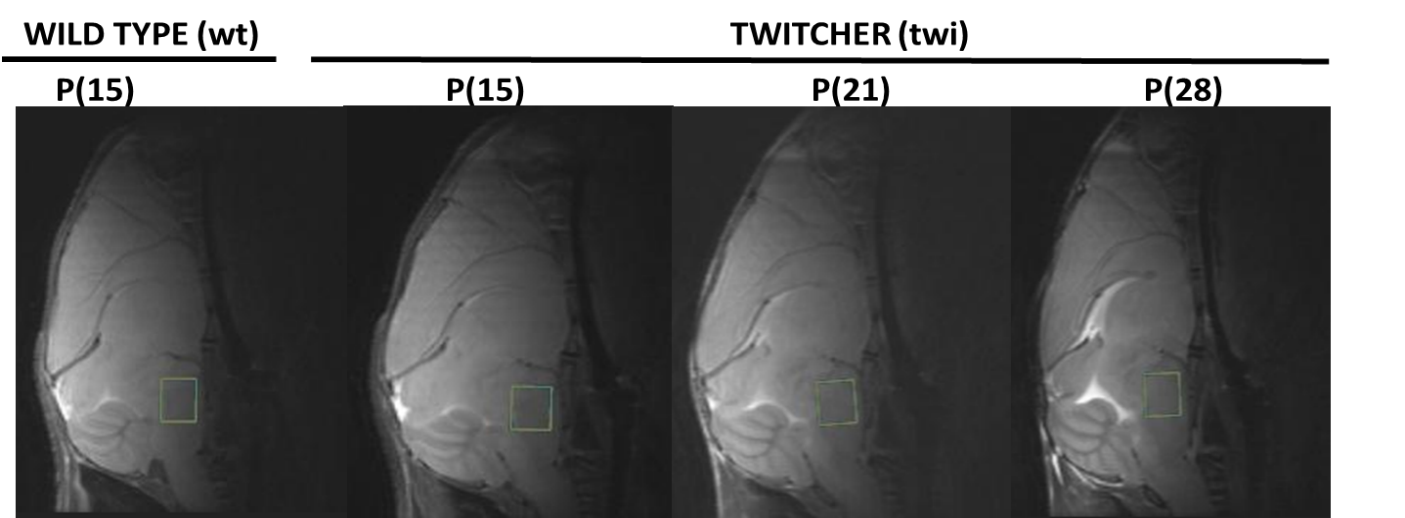
All procedures involving animals were performed according to the guidelines of Institutional Animal Care and Use Committee (IACUC). Six C57BL/6N Twi and six wild-type (WT) mice were genotyped at postnatal (P) day 5. Isoflurane anaesthetized mice were scanned longitudinally at P15 (pre-symptomatic), P21 (just prior to first symptoms), P28 (early structural and behavioral changes). We used a 9.4 Tesla horizontal bore magnet (Bruker Biospec USR94/20) and a cryogenic transceiver coil. 1H-MRS data was acquired from the pons (Figure 1) using an in-house developed Ultra Short Echo Time-Stimulated Echo Acquisition Mode (UTE-STEAM) sequence with TE/TR = 3.16/2000ms, 1.4x1.7x1.7mm3, 60kHz spectral width, 512 averages, and 17min acquisition time. Time-domain data was analyzed using LCModel3-6. Metabolites for which the average Cramér-Rao lower bound (CRLB) exceeded 50% within the animal group at a certain time-point were considered as unreliable11.
Results
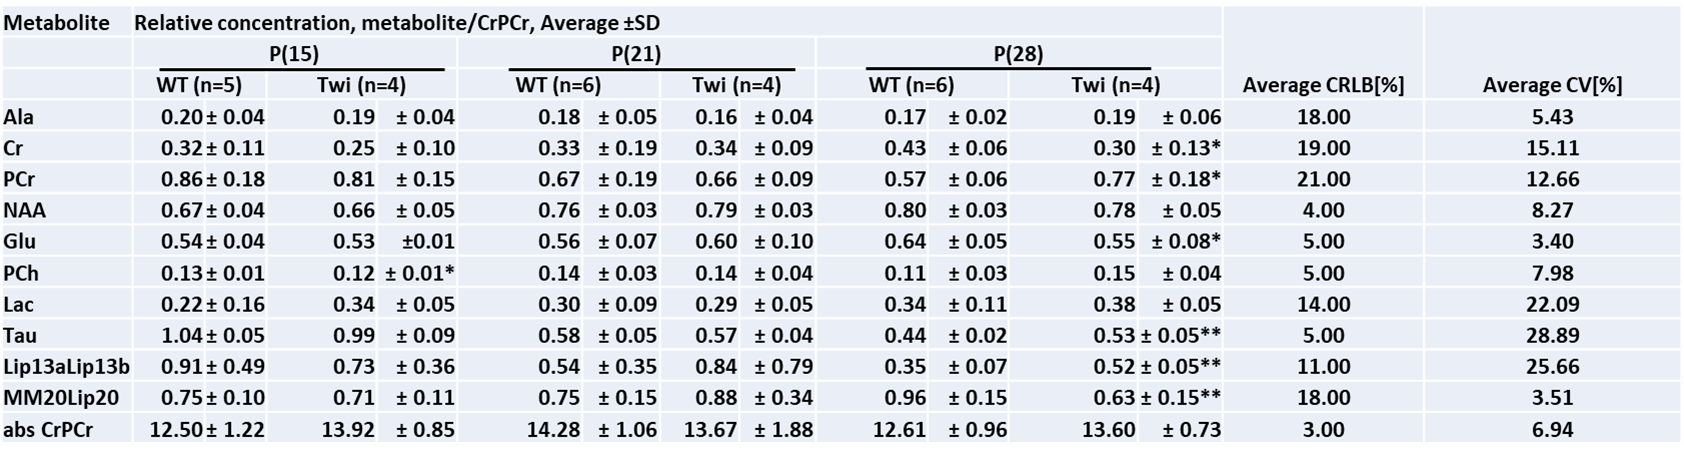
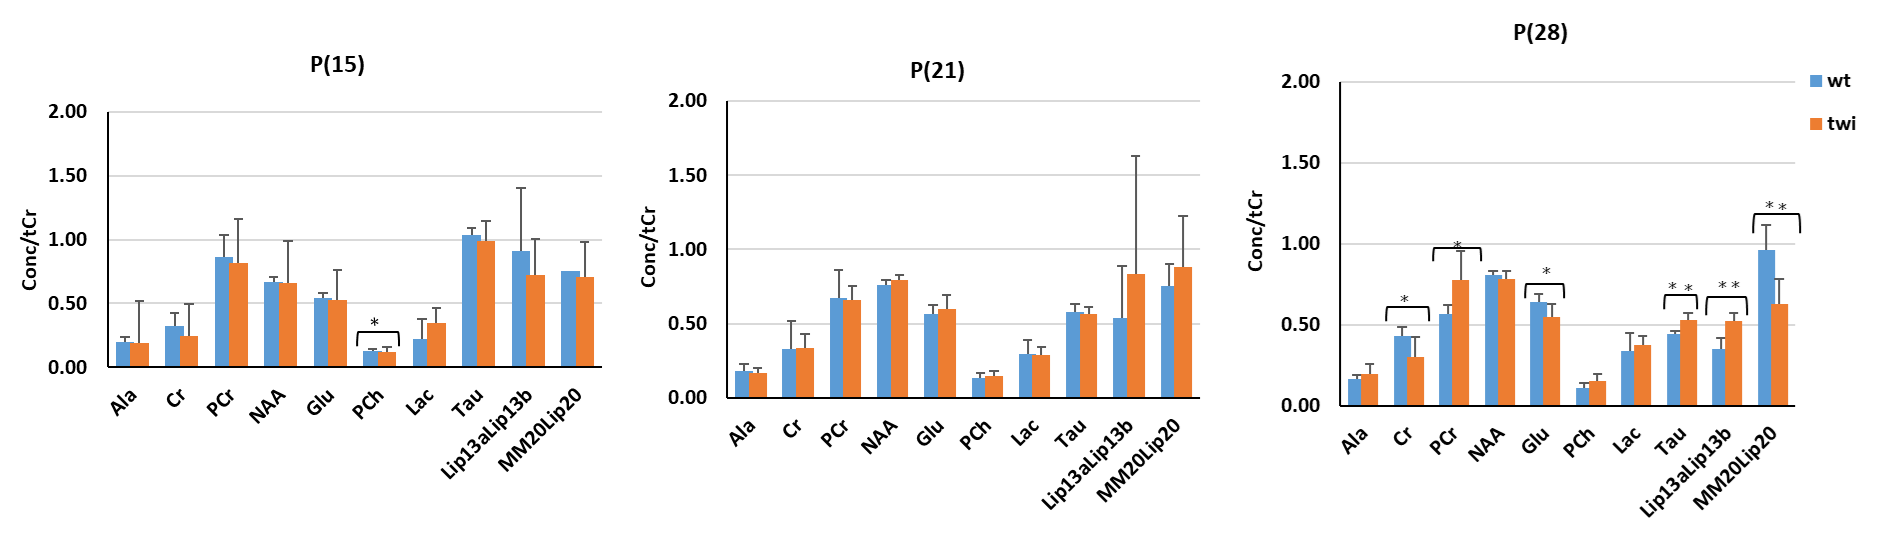
The group-average metabolic profiles of the pons region at the tree time-points are summarized in Figure 2 and Table 1 along with the coefficient of variation (COV) over time in the WT group, the number of animals (n) for which the data acquisition was successful, and average CRLB values. Absolute Creatine (tCr; μmol/g) was not significantly different between groups at any time point (p>0.05), justifying the referencing of metabolite concentration to tCr. As expected, the majority of significantly changed metabolites occurred at P28, when pathology has developed. Surprisingly, we observed significantly decreased phosphocholine (PCh) in Twi (p=0.04) mice at the pre-symptomatic stage (P15). At P(28), Glutamate (Glu) (p=0.02) and Creatine(Cr) (p=0.03) decreased significantly, while taurine (tau) (p=0.001) and phosphocreatine (PCr) increased (p=0.01). A significant decline in lipids and macromolecules in Twi at (P28) (p=0.001) was also seen. N-Acetyl aspartate (NAA) did not differ between groups at any time point (p=0.09).Discussion
We found pre-symptomatically (P15) decreased PCh which may indicate altered neurodevelopment or the beginning of neuronal death and cerebral atrophy19. As expected, most neurochemical changes were seen post-onset at P(28) and were indicative of reduced myelination and demyelination similar to previous clinical KD studies,7,8,12,11 such as decreased Cr, Glu, and lipid concentrations. These metabolic changes may be useful in assessing disease course and warrant further evaluation. The decrease in Cr and simultaneous increase in phospho-creatine (PCr) in Twi is likely related to phosphorylation of Cr for conversion of ADP to ATP10. Increased taurine (tau) in Twi suggests osmotic stress in glial cells13,16,17. Decreased Glu in Twi was previously reported in metabolomics data of Twi mice16 and suggests glial, neuron impairment and under-development of oligodendrocytes20. WT mice showed a developmental decrease in the lipids Lip13aLip13b, which did not occur in Twi mice. These changes may be indicative of the previously reported decrease in phospholipid turnover of Twi hindbrains16 or may reflect a change in myelination patterns. Declining macromolecules at P(28) may also indicate reductions in myelin17.Conclusion
The post-onset alterations in metabolites of the twitcher pons are in line with the known pathology of Krabbe disease. Our findings confirm that these metabolic changes are among the first altered neurochemical changes seen in disease, and may be useful as prognostic measures for disease development and treatment efficacy. The surprising pre-symptomatic decrease in Phosphocholine represents a promising finding that needs to be confirmed in a larger cohort of animals. In our future work, the longitudinal trajectory of each animal will be analyzed in more detail using statistical analysis.Acknowledgements
This work was supported in part by the University at Buffalo Center for Advanced Biomedical and Bioengineering Technology (UB CAT), and by the National Center for Advancing Translational Sciences of the National Institutes of Health under award Number UL1TR001412.
References
[1] N. De Stefano, M.L. Bartolozzi, L. Guidi, M.L. Stromillo, A. Federico, “Magnetic resonance spectroscopy as a measure of brain damage in multiple sclerosis,” J. Neurol. Sci., 233:203-208; 2005.
[2] J.M. Duarte, H. Lei, V. Mlynarik, R. Gruetter, “The neurochemical profile quantified by in vivo 1H NMR spectroscopy,” NeuroImage, 6:342-362; 2012.
[3] S.W. Provencher, “Estimation of metabolite concentrations from localized in-vivo proton NMR-spectra,” Magn. Reson. Med., 30:672-679; 2001.
[4] M. Marjanska, G.L. Curran, T.M. Wengenack, P.G. Henry, R.L. Bliss, J.F. Poduslo, C.R.Jack Jr., K. Ugurbil, M. Garwood, “Monitoring disease progression in transgenic mouse models of Alzheimer's disease with proton magnetic resonance spectroscopy,” Proc. Natl. Acad. Sci. U. S. A., 102:11906-11910; 2005.
[5] G. Oz, C.D. Nelson, D.M. Koski, P.G. Henry, M. Marjanska, D.K. Deelchand, R. Shanley, L.E.Eberly, H.T. Orr, H.B. Clark, “Noninvasive detection of presymptomatic and progressive neurodegeneration in a mouse model of spinocerebellar ataxia type 1,” J. Neurosci., 30:3831-3838; 2010.
[6] I. Tkac, P.G. Henry, P. Andersen, C.D. Keene, W.C. Low, R. Gruetter, “Highly resolved in vivo 1H NMR spectroscopy of the mouse brain at 9.4 T,” Magn. Reson. Med., 52:478-484; 2014.
[7] L. Farina, A. Bizzi, G. Finocchiaro, D. Pareyson, A. Sghirlanzoni, B. Bertagnolio, M. Savoiardo, S. Naidu, B. S. Singhal, and D. A. Wenger, ”MR imaging and proton MR Spectroscopy in adult Krabbe Disease,” American Journal of Neuroradiology, 21(8):1478-1482; 2000.
[8] M. K. Zarifi, A. A. Tzika, L. G. Astrakas, T. Y. Poussaint, D. C. Anthony, and B. T. Darras, “Magnetic Resonance Spectroscopy and Magnetic Resonance Findings in Krabbe’s Disease,” Journal of child neurology, 16(7):522-526; 2001.
[9] D. Dolcetta, S. Amadio, U. Guerrini, M. I. Givogri, L. Perani, F. Galbiati, L. Sironi, U. D. Carro, M. G.Roncarolo, E. Bongarzone, “Myelin Deterioration in Twitcher Mice: Motor evoked Potentials and Magnetic Resonance Imaging as In Vivo Monitoring Tools,” Signs, 604:597-604; 2005.
[10] U. Schlattner, M T Schlattner, T. Wallimann T, "Mitochondrial creatine kinase in human health and disease," Biochimica et Biophysica Acta (BBA) - Molecular Basis of Disease, 1762 (2): 164–180; 2005
[11] I Tkac, J Ozy, G Adriany, KUgurbil, R. Gruetter, “In Vivo 1H NMR Spectroscopy of the Human Brain at High Magnetic Fields: Metabolite Quantification at 4T vs. 7T”, Magn Reson Med, 62(4):868-79; 2009.
[12] C. Wang, A. Melberg, L Weis, JE Manson, R Rainio, “The earliest MR imaging and proton MR spectroscopy abnormalities in adult-onset Krabbe Disease, ”Acta Neurol Scand,116: 268-272; 2007.
[13] JY. Wu, H. Prentice, “Role of taurine in the central nervous system,” J Biomed Sci, 17:1423-1427; 2010.
[14] K. Suzuki, K. Suzuki, “The twitcher mouse. A model of human globoid cell leukodystrophy (krabbe's disease),” Am J Pathol, 111(3):394-7; 1983.
[15] H JY. Wu, H. Prentice, “Spacio-temporal progression of demyelination in twitcher mouse: with clinico-pathological correlation,” cta Neuropathologica, 88(3):228-236; 1994.
[16] N. Weinstock, L. Wrabetz, M. L. Feltri, D. Shin, “Metabolic profiling reveals biochemical pathways and potential biomarkers associated with pathogenesis of Krabbe disease,” J. Neurosci Res, 949(11):1094-1107; 2016.
[17] J. Orije, F. kara, C. Gulielmetti, J. Paret, A. V. Linden, P. Ponsarets, M. Verhoye, “Longitudinal monitoring of metabolic alterations in cuprizone model of multiple Sclerosis using 1H-magnetic resonance spectroscopy,” Neuroimage, 114:128-135; 2015.
[18] R. Dingledine, C J. McBain, ”Glutamate and Aspartate are the major Excitatory Transmitters in the Brain,” Basic Neurochemistry, Lippincott-Raven; 1999.
[19] L Parry, A Shores, C Rae, A Kemp, M Waugh, R Chaseling, O Joy, “An investigation of neuronal integrity in severe traumatic brain injury,” Child Neuropsychology, 10(4):248-61; 2001
[20] R. Káradóttir, D. Attwell, ” Neurotransmitter receptors in the life and death of oligodendrocytes,” Neuroscience, 145(4-5):1426-1438; 2007
Figures