3200
Longitudinal 9.4 Tesla 1H MRS in the thalamus of the Theiler’s encephalomyelitis virus (TMEV) mouse model of multiple sclerosis1Department of Medical Physics, University at Buffalo, The State University of New York, Buffalo, NY, United States, 2Buffalo Neuroimaging Analysis Center, Department of Neurology, Jacobs School of Medicine and Biomedical Sciences, University at Buffalo, The State University of New York, Buffalo, NY, United States, 3Center for Biomedical Imaging at the Clinical and Translational Science Institute, University at Buffalo, The State University of New York, Buffalo, NY, United States
Synopsis
This study investigated thalamic metabolic alterations related to acute and chronic inflammation in mice infected with TMEV, a model of MS. TMEV-inoculation causes a biphasic neurological disease starting with an early acute inflammation of the subcortical gray matter (<1 month) and progressing into a late chronic demyelinating phase associated with oligodendroglial damage that develops into a neurodegenerative phase (>4 months).
Our hypothesis was that the influx of immune cells will result in increased glutamate and myoinositol in the acute
Introduction
Iron is essential for many metabolic processes in human body but it’s role in normal human aging-brain is not yet fully understood. Recent advances in MRI have dramatically improved the in vivo visualization and quantification of iron and metabolites of deep gray matter brain regions providing a novel tool to study the poorly understood iron homeostasis in the human brain. A recent study4 demonstrated a progressive reduction of thalamic iron with disease duration in patients with multiple sclerosis (MS). Due to its rich connectivity profile, the thalamus is highly susceptible to cortical injuries5-7 and iron reduction may be a consequence to inflammation-induced oligodendroglial damage in this region. In the present study, we investigated thalamic metabolic alterations related to acute and chronic inflammation in mice infected with TMEV, a model of multiple sclerosis. TMEV-inoculation causes a biphasic neurological disease starting with an early acute inflammation of the subcortical gray matter (< month 1) and progressing into a late chronic demyelinating phase associated with oligodendroglial damage that develops into a neurodegenerative phase (>4 months)11. Throughout the disease, cytokine levels are markedly increased11. Our hypothesis was that the influx of immune cells will result in increased glutamate (Glu) and myoinositol (mI)12 in the acute phase, and that Glu will further increase in the chronic phase whereas gamma-aminobutyric acid (GABA, inhibited by cytokines),13-15 M-acetylaspartate (NAA), and choline (neuropathology) decrease.Methods
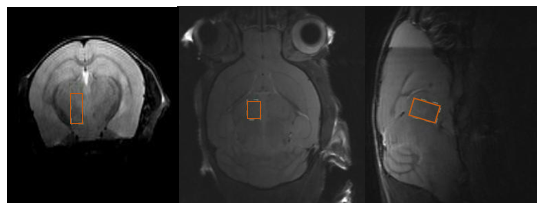
38 Swiss Jim Lambert (SJL/J) animals were enrolled at 6 weeks of age. After acclimatizing them for 1 week, at 7 weeks of age, animals were anaesthetized with ketamine+xylazine to deliver the TMEV virus into the central nervous system by minimally invasive intracerebral injection in 19 out of 38 animals. In remaining 19 animals (shams), we injected phosphate buffer solution instead of the virus. Successful infection with TMEV was confirmed with the mouse TMEV enzyme-linked immunosorbent assay (ELISA) kit at baseline and two months post induction. Isoflurane anesthetized mice were scanned at months 1, 2, 6, and 8 post-infection using a cryogenic transceiver coil at 9.4 Tesla (Bruker Biospec USR20/94). We used an Ultra Short Echo Time-Stimulated Echo Acquisition Mode (UTE-STEAM) with TE/TR=3.16/2000ms, 60kHz spectral width, NEX=512, 17min acquisition time, and a 2.1x1.1x1.6mm3 voxel placed in the hemisphere contralateral to the injection site (Figure 1). Time-domain data were analyzed using LCModel3. Metabolites for which the average Cramér-Rao Lower Bound (CRLB) exceeded 50% within the animal group at a certain time-point were considered as unreliable8 .Results
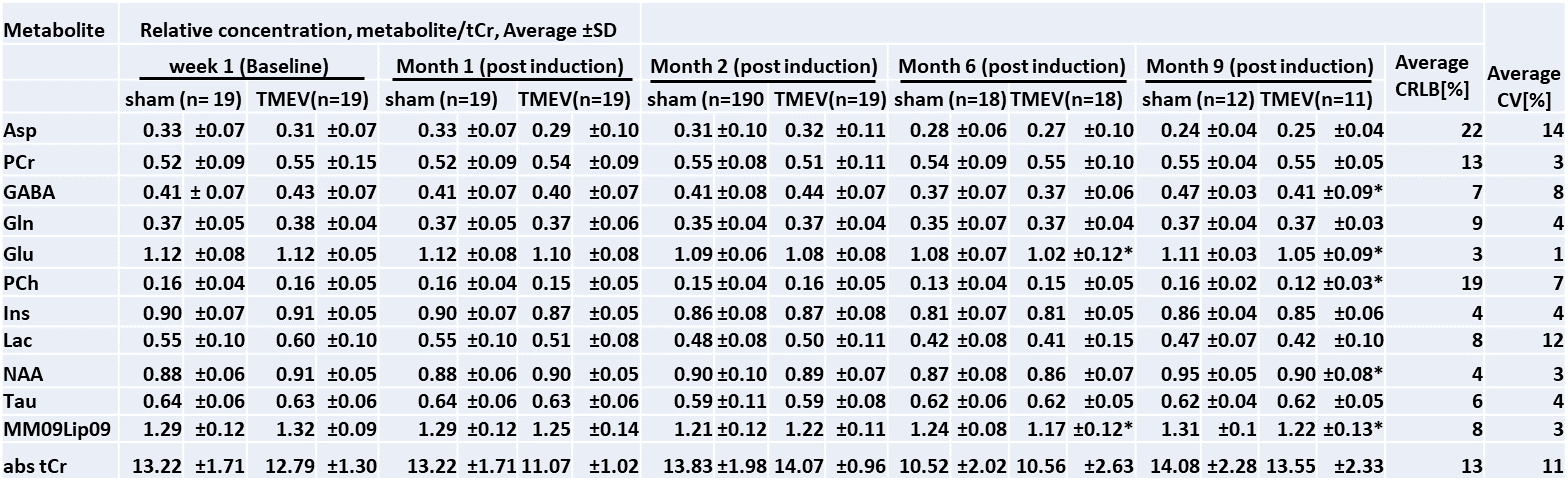
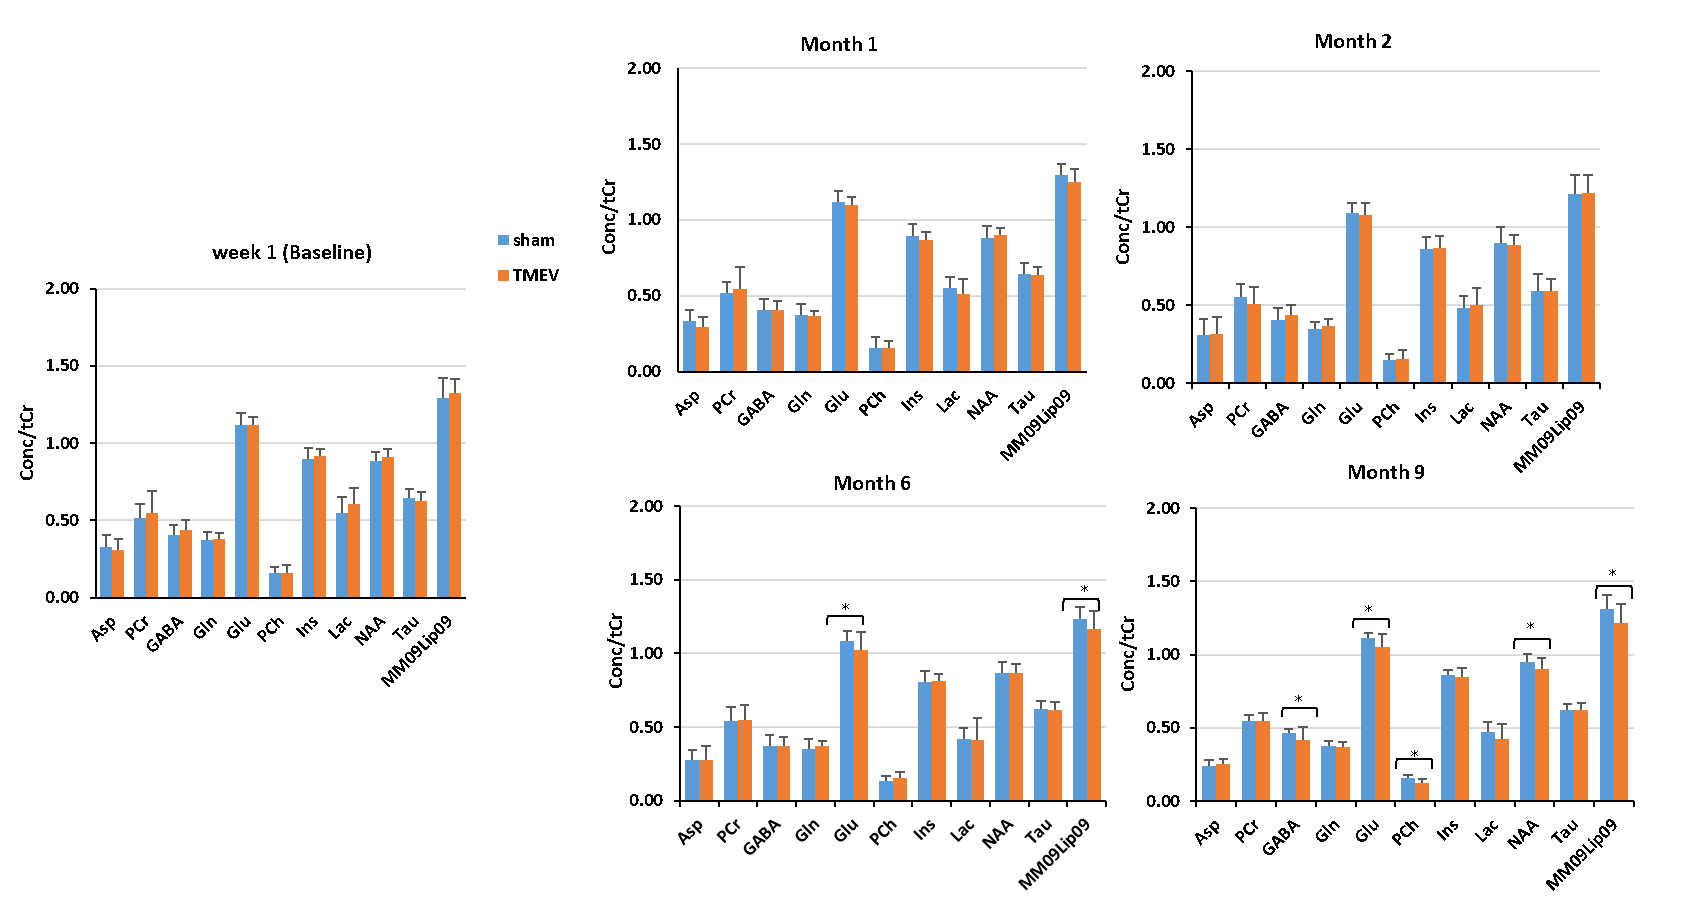
Figure 2 and Table 1 summarize the metabolic profiles for each group at different time-points. As expected, metabolite concentrations were similar at baseline (p>0.07). At month 6 (peak atrophy), Glu (p=0.04) (and lipids; p=0.02) were lower in TMEV mice than in shams, which continued throughout the chronic phase (month 9). Here, GABA (p=0.04), Glu (p=0.02), Phosphocholine (PCh) (p=0.001) and NAA (p=0.04) were significantly reduced in the TMEV model. The Glu/GABA ratio was reduced in TMEV (p=0.05) at 2 months post induction but differences did not reach significance at other time points (p>0.06). Glu/NAA15 ratio was reduced in TMEV at 1 month (p=0.01) and 6 months (p=0.04) post induction and GABA/NAA at 2 months post induction (p=0.03).Discussion
This is the first study that employs MRS in TMEV to investigate the effect of acute inflammation and chronic demyelination (MS pathology) in the thalamus. No significant difference in metabolites at the baseline indicates precise experimental and analysis measures taken in this study. Decrease in PCh in the chronic phase reflects neuronal death and cerebral atrophy8. Decrease in Glu at peak atrophy and in the chronic phase suggests glial, neuron impairment and under-development of oligodendrocytes8,10. In the chronic phase, decreased NAA, PCh, and GABA reflects neurodegeneration,1,2 reduced inhibitory input, and may be related to chronic cytokine exposure9. We could not detect increased Glu at any stage, which would reflect excitotoxicity. Future analyses will correlate metabolite concentrations with disability and iron concentrations indicative of oligodendrocyte density and account for the longitudinal trajectory of each animal.Conclusion
The quantification of changes in metabolites at chronic stage implies earlier phases of TMEV infection cannot be detected using MRS. However, late chronic phase provides a model to study metabolic alterations in secondary progressive MS. The role of iron depletion from oligodendrocytes in influencing metabolite alterations in chronic stage needs to be investigated using Quantitative Susceptibility Mapping (QSM).Acknowledgements
This work was supported in part by the University at Buffalo Center for Advanced Biomedical and Bioengineering Technology (UB CAT), by the National Center for Advancing Translational Sciences of the National Institutes of Health under award Number UL1TR001412. The content is solely the responsibility of the authors and does not necessarily represent the official views of the NIH.References
[1] N. De Stefano, M.L. Bartolozzi, L. Guidi, M.L. Stromillo, A. Federico, “Magnetic resonance spectroscopy as a measure of brain damage in multiple sclerosis,” J. Neurol. Sci., 233:203-208; 2005.
[2] J.M. Duarte, H. Lei, V. Mlynarik, R. Gruetter, “The neurochemical profile quantified by in vivo 1H NMR spectroscopy,” NeuroImage, 6:342-362; 2012.
[3] S.W. Provencher, “Estimation of metabolite concentrations from localized in-vivo proton NMR-spectra,” Magn. Reson. Med., 30:672-679; 2001.
[4] F. Schweser, A. Deistung, B. W. Lehr, and J. R. Reichenbach, “Quantitative imaging of intrinsic magnetic tissue properties using MRI signal phase: An approach to in vivo brain iron metabolism?” NeuroImage, 54(4):2789–2807; 2011.
[5] L. Haider, C. Simeonidou, G. Steinberger, S. Hametner, N. Grigoriadis, G. Deretzi, G. G. Kovacset, A. Kutzelnigg, H. Lassman, J. M. Frischer, “Multiple Sclerosis deep grey matter: the relation between demyelination, neurodegeration, inflammation and iron,” J Neurol Neurosurg Psychiatry, 85(12):1386–1395; 2014.
[6] S. Hametner, I. Wimmer, L. Haider, S. Pfeifenbring, W. Bruck, H Lassmann, “Iron and neurodegeneration in the multiple Sclerosis brain,” Ann Neurol, 74(6):848–861; 2013.
[7] S. M. LeVine, “ Iron deposits in multiple sclerosis and Alzheimer's disease brains,” Brain Res, 760(1-2):298–303, 1997.
[8] L. Parry, A. Shores, C. Rae, A. Kemp, M. Waugh, R. Chaseling, O. Joy, “An investigation of neuronal integrity in severe traumatic brain injuiry,” Child Neuropsychology, 10(4):248-61; 2001
[9] M. Lee, C. Schwab, P. L. McGeer, “Astrocytes are GABAergic cells that modulate microglial activity,” Glia, 59(1):152–165; 2011.
[10] R. Káradóttir, D. Attwell ,” Neurotransmitter receptors in the life and death of oligodendrocytes,” Neuroscience, 145(4-5):1426-1438; 2007.
[11] E. L. Oleszak , J. R. Chang JR, H. Freidman, C. D. Katsetos, C. D. Paltsoucas, “Theiler's virus infection: a model for multiple sclerosis,” Clin Microbiol Rev, 17(1):174–207; 2004.
[12] N. Bertolino, R. Zivadinov, F. Schweser (BNAC, UB). Proc Intl Soc Mag Reson Med 24, p1319, 2016.
[13] D. Stellwagen, E C. Beattie, J. Y. Seo, R. C. Malenka, “ Differential Regulation of AMPA Receptor and GABA Receptor Trafficking by Tumor Necrosis Factor-α,”J Neurosci, 25(12):3219–3228; 2005.
[14] C. M. Modica, F. Schweser, M. L. Sudyn, N. Bertolino, M. Preda, P. Polak, D. M. Siebert, J. C. Krawiecki, M. Sveinsson, J. Hagemeier, M. G. Dwyer, S. Pol, R. Zivadinov, “Effect of teriflunomide on cortex-basal ganglia-thalamus (CxBGTh) circuit glutamatergic dysregulation in the Theiler's Murine Encephalomyelitis Virus mouse model of multiple sclerosis,” PLoS One.,12(8):1371; 2017.
[15] N. Cawley, B. S. Solanky, N. Muhlert, C. Tur C, R. A. Edden, C. A. Wheeler-Kingshott, D. H. Miller, A. J. Thompson, O. Ciccarelli, “Reduced gamma-aminobutyric acid concentration is associated with physical disability in progressive multiple sclerosis”, Brain, 138(9):2584-95; 2015.
Figures