3199
In Vivo MRI Reveals Increased Brain Prefusion in Carbamoylated Erythropoietin Treated Mice1Radiology, University of Nebraska Medical Center, Omaha, NE, United States, 2Basic Biomedical Sciences, University of South Dakota, Vermillion, SD, United States, 3Sioux Falls VA HealthCare System, Sioux Falls, SD, United States
Synopsis
In vivo MRI was used to detect and measure the brain hemodynamic action of carbamoylated erythropoietin (Cepo) in mice. Brain perfusion was measured using dynamic susceptibility contrast MRI, and BBB permeability was detected by pre- and post-contrast T1 mapping. It was found that Cepo caused increased cerebral blood flow and volume. Consistent pre- and post-contrast T1 values indicated no gadolinium leakage from vascular system to brain tissue. In summary, chronic Cepo treatment induced increased brain perfusion and this can be detected using in vivo MRI.
INTRODUCTION
Carbamoylated erythropoietin (Cepo) - a chemically engineered erythropoietin (Epo) - is non-erythropoietic but reproduces Epo’s neurotrophic and behavioral actions in mice and rats. Previous studies have shown Epo increases angiogenesis and restores cerebral blood flow after focal ischemia in mice1. This study is to noninvasively and quantitatively measure the blood flow increase by Cepo using MRI. The aim of the study is to test the hypothesis that carbamoylated erythropoietin (Cepo) induces increased brain blood flow.METHODS
Both acute and chronic effects of Cepo were tested. The acute group (male Balb/c mice, n = 6) was treated with i.p. injection of 40 mg/kg Cepo, and scanned after 3 hours. The chronic group (n = 6) was injected with 5 doses of Cepo (i.p., 40 ug/kg/day), and scanned after 24 hours of the last dose. Two control groups were treated with acute and chronic PBS injections, respectively. The mice were first scanned with RARE VTR for pre-contrast T1 mapping. T2*-weighted MRI was performed using EPI GRE with TR = 1 s and scan time = 60 s. Gadolinium was injected through tail vein at 10 s with a dose = 0.1 mmol/kg followed by post-contrast T1 mapping. Relative Cerebral blood volume (rCBV), relative cerebral blood flow (rCBF), mean transit time (MTT) and time to peak (TPP) maps were generated using DSCoMAN2,3. K2 maps were also generated. T1 maps were calculated using an in-house fitting program4.RESULTS
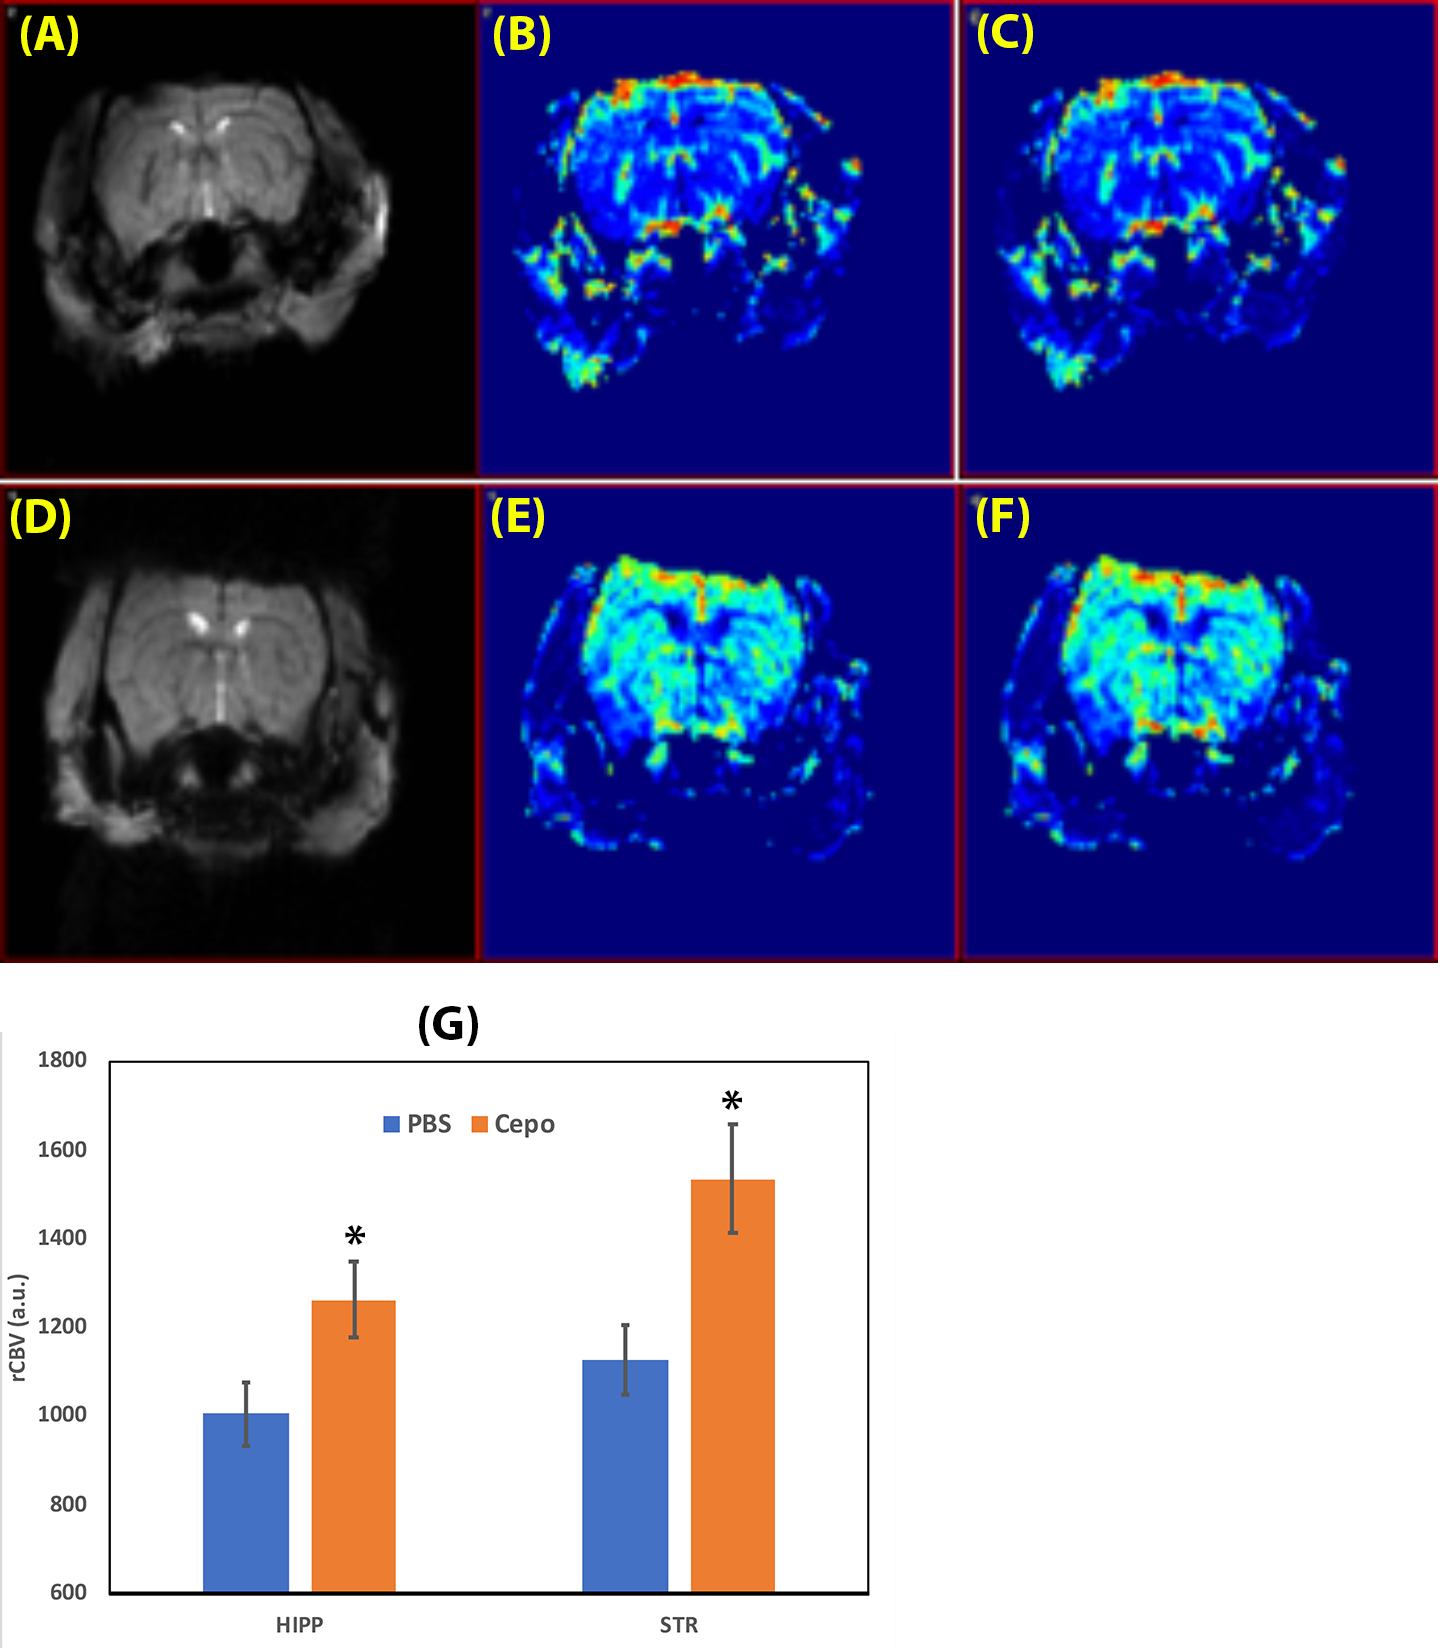
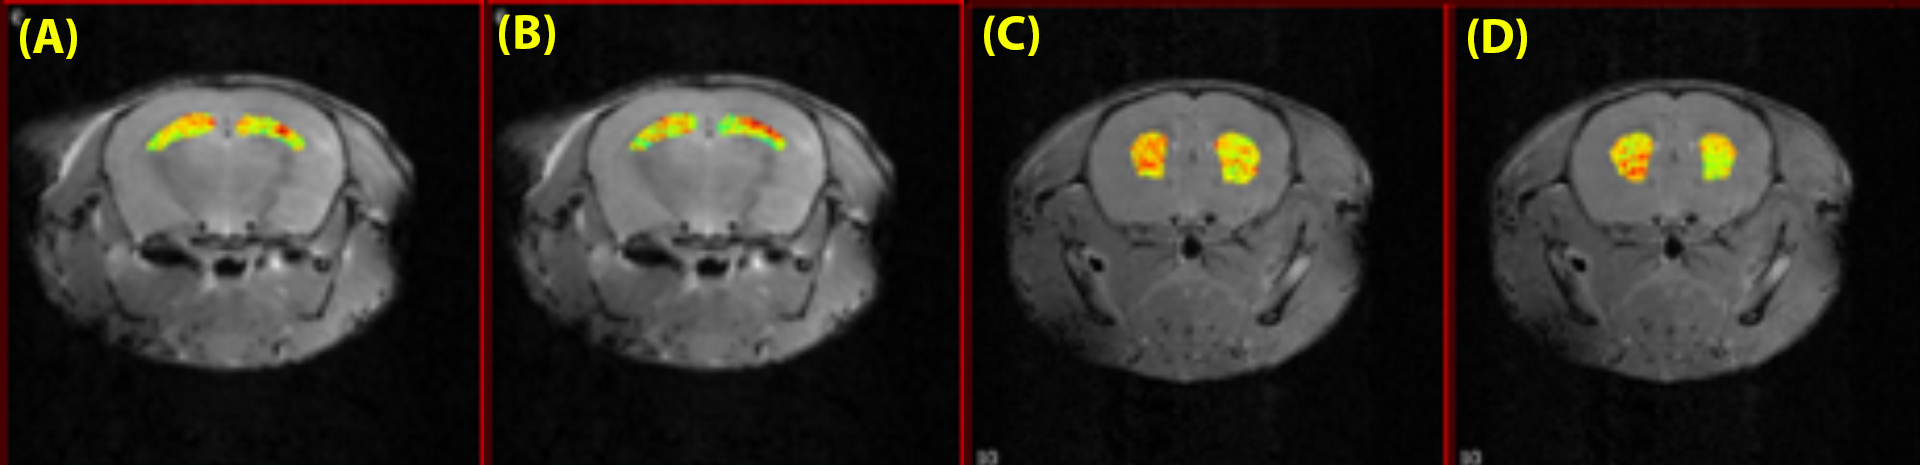
Increased perfusion was found in mice with chronic Cepo injection compared to controls. Figure 1B and E shows the rCBV maps of a chronic Cepo mouse and a control. Relative CBF maps are shown in Figure 1C and F for the Cepo and control mice, respectively. T2*-weighted EPI images are included in Figure 1A and D as anatomical references. Higher rCBV and rCBF can be observed on hippocampus and striatum in the Cepo mouse than in the control. The ROI analysis found significant rCBV increase in chronic Cepo mice on hippocampus (p = 0.023) and striatum (p = 0.012). Relative CBF showed the trend of increase on hippocampus in Cepo mice (p = 0.061) and significant increase on striatum (p = 0.044). No significant difference on MTT and TTP was found. The heat maps of T1 on hippocampus and striatum are superimposed on an anatomical image and shown in Figure 2. The ROI analysis found no significant difference between pre- and post-contrast T1 on hippocampus (pre-contrast T1 = 2103 ± 84 ms vs post-contrast T1 = 2010 ± 79 ms) and striatum (pre-contrast T1 = 1790 ± 69 ms vs post-contrast T1 = 1814 ± 41 ms). No significant difference was found between pre- and post-contrast T1 values in both Cepo mice and controls.DISCUSSION
Our study demonstrated in vivo MRI is able to detect and measure increased brain perfusion induced by chronic Cepo treatment. Cepo caused increased cerebral blood flow and volume, and the time course of gadolinium passage (as shown by MTT and TTP) in brain was not changed. Consistent pre- and post-contrast T1 values indicated no gadolinium leakage from vascular system to brain tissue. K2 maps also confirmed intact BBB. We did not find significant changes in perfusion in acute treated mice. In summary, chronic Cepo treatment induced increased brain perfusion and this can be detected using in vivo MRI.Acknowledgements
This study is partially supported by NIH RO1 MH106640 (SN) and Nebraska Research Initiative (YL).References
1. Li Y, Lu Z, Keogh CL, Yu SP, Wei L. Erythropoietin-induced neurovascular protection, angiogenesis, and cerebral blood flow restoration after focal ischemia in mice. J Cereb Blood Flow Metab. 2007 27:1043-1054.
2. 1.https://sites.duke.edu/dblab/dscoman/
3. Boxerman JL, Schmainda KM, Weisskoff RM. Relative cerebral blood volume maps corrected for contrast agent extravasation significantly correlate with glioma tumor grade, whereas uncorrected maps do not. AJNR Am J Neuroradiol. 2006 Apr;27(4):859-67
4. Bade AN, Gendelman HE, Boska MD, Liu Y. MEMRI is a biomarker defining nicotine-specific neuronal responses in subregions of the rodent brain. Am J Transl Res. 2017 Feb 15;9(2):601-610
Figures