3198
Imaging the evolution acute fear to anxiety: Longitudinal whole brain imaging in living mice of neural activity with MEMRIElaine L Bearer1,2, Daniel Barto3, and Rusell E Jacobs4
1Elaine Bearer, University of New Mexico Health Sciences Center, Albuquerque, NM, United States, 2Biology, California Institute of Technology, Pasadean, CA, United States, 3Pathology, University of New Mexico Health Sciences Center, Albuquerque, NM, United States, 4Physiology, Zilkha Neurogenetic Institute USC, Los Angeles, CA, United States
Synopsis
Life-threatening events cause extreme fear, which evolves in vulnerable people into a debilitating mental illness--post-traumatic stress disorder (PTSD). Here we directly address how acute fear evolves to anxiety using high field MR in mouse models of PTSD, applying systems-wide longitudinal manganese-enhanced magnetic resonance imaging (MEMRI) to image whole brain responses to unconditioned fear, predator stress (PS), and progression or resolution over time. We report that serotonin transporter knock-out results in sustained anxiety-like behavior and altered neural activity after predator stress. Automated segmentation of SPM maps identifies m regions correlated with progression to PTSD for the first time.
Introduction
Life-threatening events cause extreme fear, which evolves in vulnerable people into a debilitating mental illness--post-traumatic stress disorder (PTSD), affecting 6.8% of all Americans(1). Those who progress to PTSD display both anxiety-related (hyper-arousal) and depressive (avoidance) symptoms. PTSD is accompanied by changes in brain functional anatomy. Some experience relief from selective serotonin reuptake inhibitors (SSRI), some from 1 adrenergic receptor inhibitors, and some respond to combined inhibition of both noradrenergic and serotonergic transporters (NET and SERT), SNRI. Cross-talk between serotonergic and noradrenergic systems (SS and NS) is well known. Both are disturbed in PTSD(2-4). Early life adversity is a known risk factor for PTSD. There are no predictive or diagnostic tests, and no reliably effective prevention or intervention for PTSD. Using manganese-enhanced MRI (MEMRI) tract-tracing, we reported that SERT-KO mice have abnormal circuitry in the prelimbic system(5). To determine whether early life adversity affects this circuit and the behavioral and neural response by fear, SERT-KO and WT mice raised either normally or with maternal deprivation, were exposed to predator stress (PS) in young adulthood, a known naturalistic provocateur of PTSD in rodents. We use the light-dark box to quantify behavior and Mn2+-enhanced MRI (MEMRI) to witness behavior and brain activity. Mn2+ increases the relaxation rate of protons in water in T1-weighted pulse sequences, and thus produces a hyper-intense signal in T1-weighted MRI. Mn2+ is a metabolic contrast agent that reports on neural activity by entering active neurons through voltage-gated Ca2+ channels(6), and is transported along axons tracing multi-synaptic circuitry when injected locally(7, 8).Method
WT littermates and SERT KO mice (12 each) were either exposed to fragmented care during post-natal day P2-10 or raised normally and exposed to PS at 10 weeks of age. For PS, we used a synthetic fox odor, 2,3,5-Trimethyl-3-thiazoline (TMT). Behavior was recorded by Noldus video system in the light-dark box. Mice were imaged in an 11.7 T vertical bore Bruker MR scanner prior to and then after intraperitoneal (IP) injection of Mn2+ (0.3 mM/kg) and re-scanned 24hr later. Immediately following the 24hr scan, mice were exposed first to saline and then to PS in a light-dark box, their behavior recorded, and another MR image obtained. 9d later, behavior was again recorded and mice were re-scanned, injected IP with Mn2+ and scanned 24hr later to test for persistence of neural activity. Whole head images of living mice were skull-stripped and aligned(8, 9). Using statistical parametric mapping (SPM) tools we compared images by paired T-tests. Automated segmentation based on our InVivo MR Atlas(10) identifies sub-regions of brain activated by PS and in SERT-KO and ELS-exposed mice at 9d. We confirmed intensity changes by ROI analysis of locations detected by SPM as statistically different, and localized neural activation by c-Fos staining.Results and Discussion
We detected strong signals in the "resting" brain, prior to PS. This signal had maximal increase at 24hr and dissipated over 13d. After PS, signal increased specifically in amygdala, hypothalamus, hippocampus and reticular activating system, with more increase in ELS-exposed mice and SERT-KO than wild-type-normally raised animals. Both fearful behavior and brain activity in ELS and in SERT-KO mice was prolonged after PS. Comparisons of the 9d post PS detected statistically significant changes (p<0.001 uncorr) in 6 regions in SERT KO mice compared to WT by ANOVA (p<0.0001 uncorr). An ROI analysis demonstrated that the extent of difference in voxel intensity, after normalization, between groups at the 10d time-point was 2-6%. Activation of these brain regions was confirmed by c-Fos staining of the same mice. MEMRI tract-tracing of the prelimbic circuit was also affected by SERT KO, NET KO, PS and ELS. Hence SERT KO mice exhibited both sustained behavioral response to PS as well as prolonged neural activity in anviety-associated brain regions. Interestingly locations of activity evolve over time.Conclusion
PTSD-like behavior of SERT-KO animals at 9-24d after PS includes avoidance and hyper-arousal. Heightened activation of brain regions continued for 9d after PS in SERT-KO and ELS. Changes in location of signal at 9dsuggest that PTSD responses in the brain evolve. Thus, longitudinal MEMRI provides an experimental system to explore the dynamics of whole brain biological mechanisms that result in PTSD, with possible clues for diagnosis and interventions. These results show interactions between genotype, early life experience and context, suggesting a 2 or even 3-hit model for PTSD.Acknowledgements
Technical assistance from Xiaowei Zhang, Sharon Wu Lin, Daniel Perez Rodriquez and Kathleen Kilpatrick. Funding from NIH R01MH096093 (ELB).References
1.Harvard Medical School, “National Comorbidity Survey (NCS)” Boston, MA, (2017). 2. Hall et al., The effects of DAT, SERT and NET gene knockout on behavior in animal models of depression. Neuropsychopharm 31, S155 (2006). 3. Perona et al., Animal models of depression in dopamine, serotonin, and norepinephrine transporter knockout mice: prominent effects of dopamine transporter deletions. Behav Pharmacol 19, 566 (2008). 4. Vizi et al., Uptake and release of norepinephrine by serotonergic terminals in norepinephrine transporter knock-out mice: Implications for the action of selective serotonin reuptake inhibitors. J Neurosci 24, 7888 (2004). 5. Bearer et al., Reward circuitry is perturbed in the absence of the serotonin transporter. Neuroimage 46, 1091 (2009). 6. Malkova et al., Manganese-enhanced magnetic resonance imaging reveals increased DOI-induced brain activity in a mouse model of schizophrenia. PNAS 111, E2492 (2014). 7. Bearer et al., Role of neuronal activity and kinesin on tract tracing by manganese-enhanced MRI (MEMRI). Neuroimage 37 Suppl 1, S37 (2007). 8. Medina et al., Automated Computational Processing of 3-D MR Images of Mouse Brain for Phenotyping of Living Animals. CPMB 119, 29A 5 1 (2017). 9. Delora et al., A simple rapid process for semi-automated brain extraction from magnetic resonance images of the whole mouse head. J Neurosci Meth. 257, 185 (2016).10. MacKenzie-Graham et al., A multimodal, multidimensional atlas of the C57BL/6J mouse brain. J Anat. 204, 93 (2004).Figures
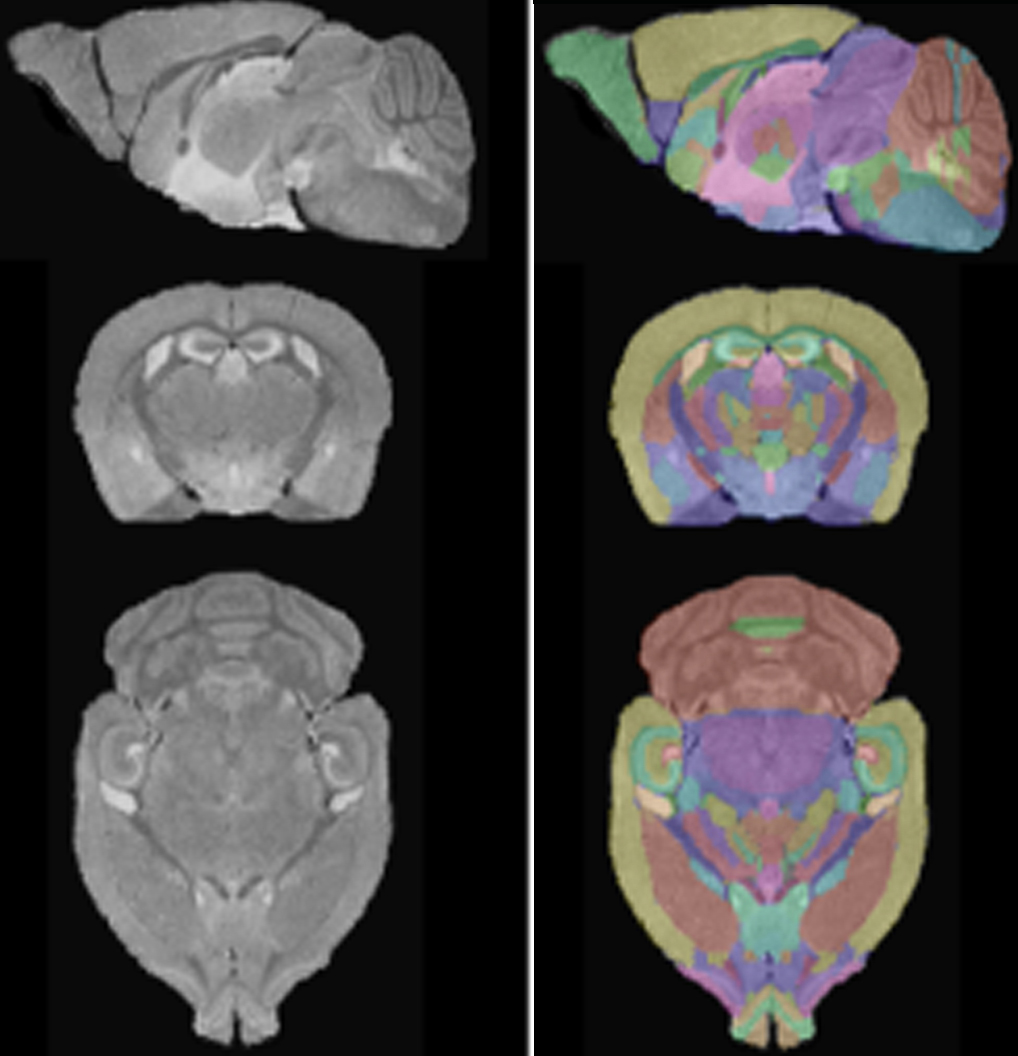
InVivo Atlas: Live mouse brain manually segmented in 3D according to Paxinos.
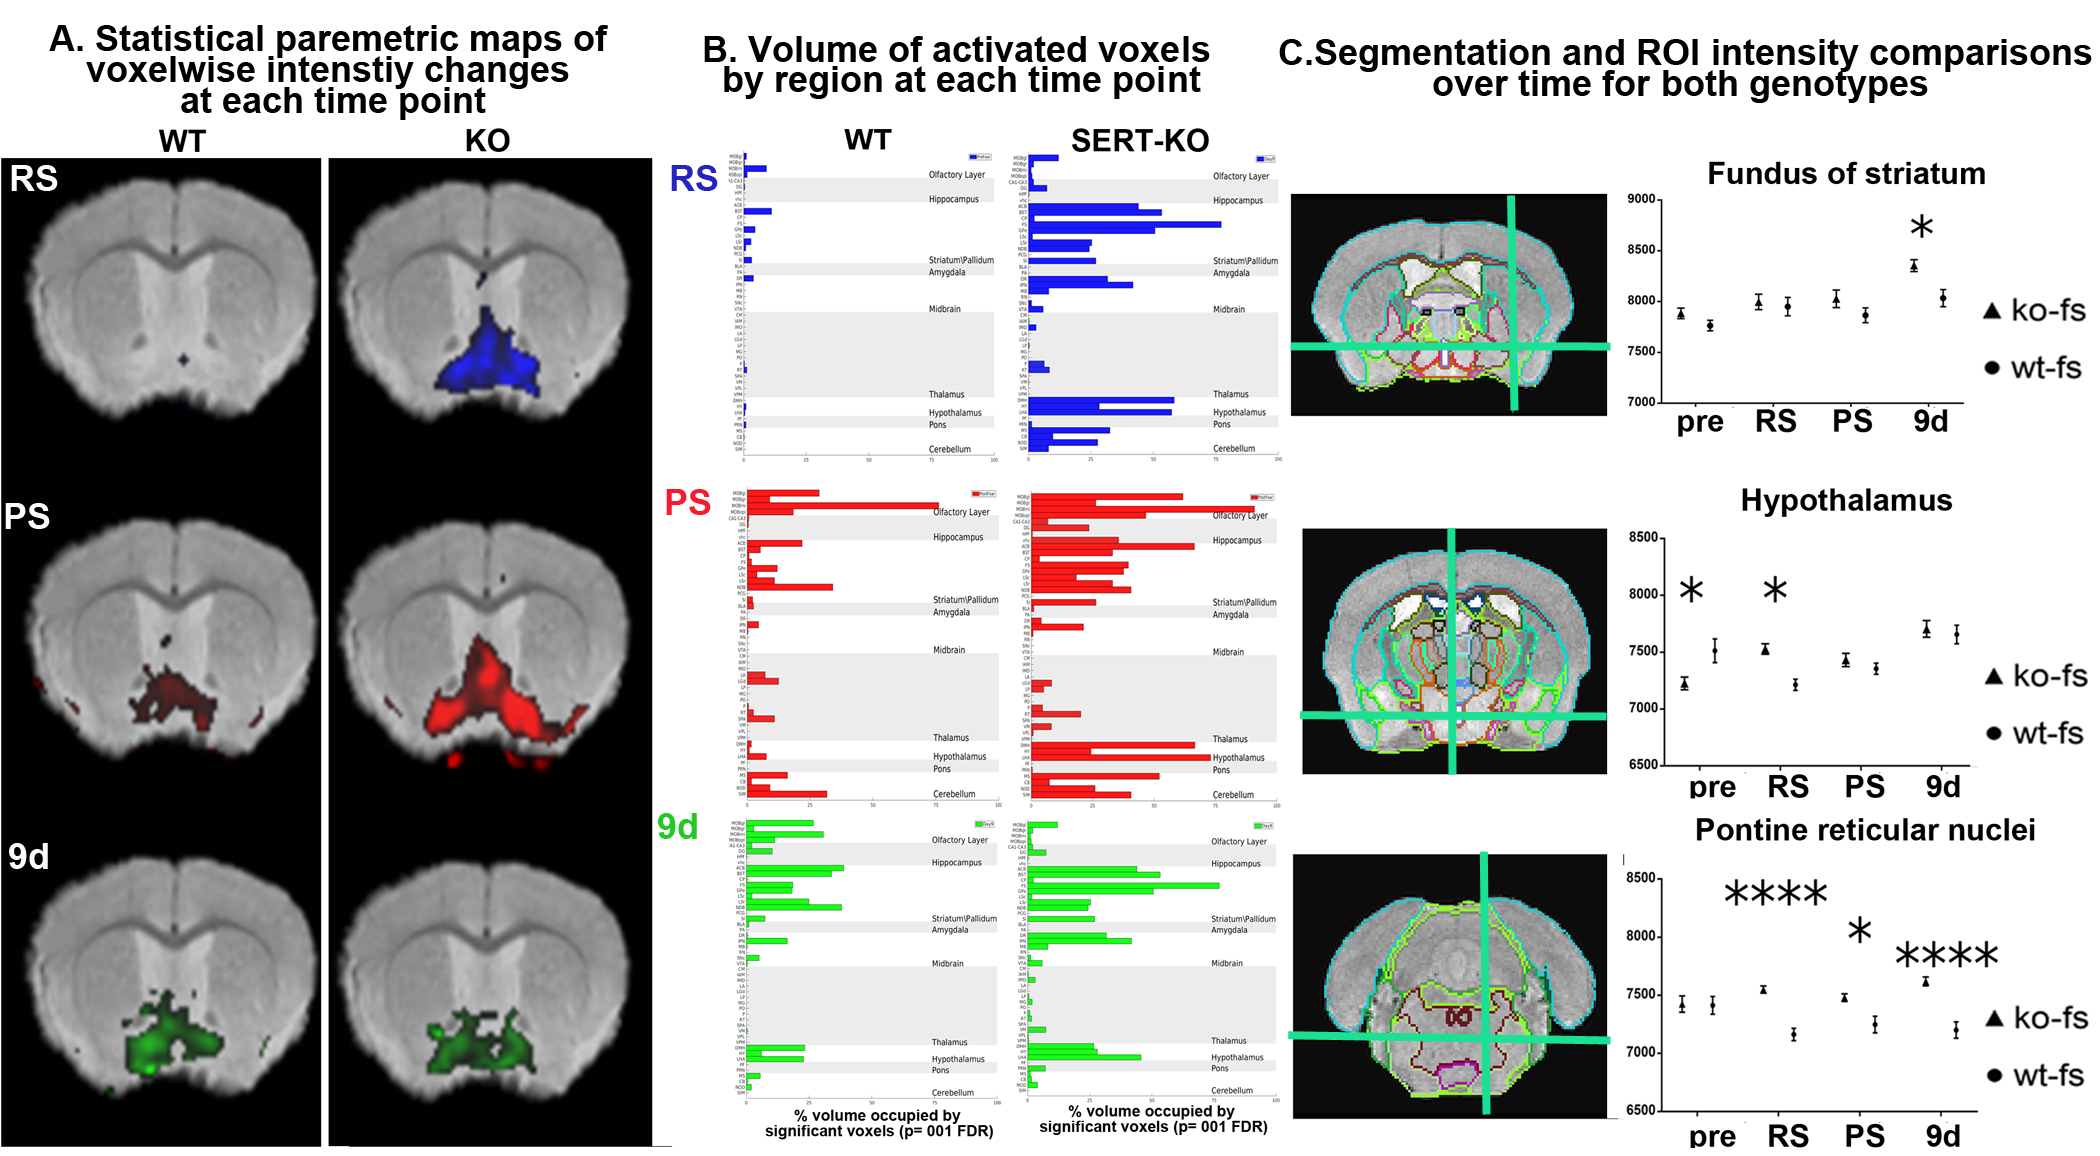
Transition from acute innate fear to anxiety in WT and SERT KO mice. A. SPM maps at each time point, RS, resting state; PS, immediately after predator stress; 9d, 9 days after PS; B, Relative volumes of 50 activated regions in WT and SERT KO mice; C. Segmentation and ROI measurements with statistical analysis of regions activated at 9 days. In a 11.7T Bruker Biospin scanner with(FLASH) imaging sequence that
gives a T1/T2 signal, 8 average sequences, TR/TEeff=25 ms/5 ms[d1] ; matrix size of 200×124×82 and FOV
20.0 mm×12.4 mm×8.2 mm, yielding 100 µm isotropic voxels with 34m scan time.